UNIVERSITY
OF TRENTO
DEPARTMENT OF INFORMATION AND COMMUNICATION TECHNOLOGY
38050 Povo – Trento (Italy), Via Sommarive 14
http://www.dit.unitn.it
FAST ESTIMATION OF A/D CONVERTER NONLINEARITIES
Fabrizio Stefani, Antonio Moschitta, David Macii, Paolo Carbone,
Dario Petri
July 2004
Fast Estimation of A/D Converter Nonlinearities
F. Stefani
1, A. Moschitta
1, D. Macii
2, P. Carbone
1, D. Petri
21
DIEI, University of Perugia – Via G. Duranti, 93 – 06125 Perugia (PG), Italy
Phone: +39 075 5853933; Fax: +39 075 5853654; e-mail: {stefani, moschitta, carbone}@diei.unipg.it
2DIT, University of Trento – Via Sommarive, 14 – 38050 Trento (TN), Italy
Phone: +39 0461 883902; Fax: +39 0461 882093; e-mail: {macii, petri}@dit.unitn.it
A b s t r a c t – This paper deals with an innovative strategy to shorten the record size required to estimate the Integral Non-Linearity (INL) of Analog-to-Digital Converters (ADC’s) through the so-called Sinewave Histogram Test (SHT). Such a size reduction is achieved by low-pass filtering the collected sequences of test samples using a simple moving average filter. After some preliminary simulations, the validity of the proposed approach have been confirmed by some experimental results.
I. Introduction
Nowadays, characterization and testing activities are a major factor of cost in integrated circuit (IC) manufacturing. In fact, testing mixed-signal circuits may cover nearly 50% of the whole production budget [1]. Among all the possible testing procedures, Histogram Tests are probably the best-known strategies to characterize the linearity features of an ADC. These techniques estimate the converter transition levels by analyzing the ADC output codes when the stimulus has a known probability density function [2]. The main advantage of Histogram based Tests, such as the Sinewave Histogram Test (SHT), is that the estimator variance can be made arbitrarily close to the Cramer-Rao lower bound, while the theoretical and computational complexity of the algorithm is very low [3][[5]. Unfortunately, for ADC with more than 12 bits of nominal resolution, achieving an estimator accuracy lower than a Least Significant Bit (LSB) may require data records consisting of millions of test samples [6]. Therefore, an accurate INL estimation can be very expensive and time-consuming, because of the large data acquisition and transfer times.
Several techniques have been proposed to decrease the total number of samples required by the SHT. Some of them are based on a frequency domain analysis of the estimated INL [6][7]. Others rely on proper analytical models describing the dependence of the INL patterns on the code bins [8][9]. In this paper, it is shown that the constraint on the record size can be relaxed by applying moving average (MA) filtering upon the SHT results obtained with a small size data set. In particular, the proposed technique allows a fast and very accurate estimation of the low frequency code component (LCF) of the INL sequence, which often represents a major information about converter nonlinearity [8]. Nevertheless, the high frequency code (HFC) component of the INL can still be estimated with a given accuracy, if a suitable tradeoff is found between the length of the MA filter and the size of the data record employed in the test.
The paper is organized as follows. At first, the general SHT design criteria are shortly recalled. Then, the theoretical effect of MA filtering on SHT outcomes is described and compared with meaningful simulation results. Finally, the results of an experimental validation of the proposed testing procedure are reported and commented.
II. Theoretical Analysis A. The design of the Sinewave Histogram Test
The SHT is based on the acquisition of a large number of data obtained by sampling a high-accuracy sinewave affected by a known amount of Additive White Gaussian Noise (AWGN). In fact, not only can sinusoidal stimuli be generated easily, but also they allow the frequency characterization of the
ADC under test. In SHT, the converter transition voltages Tk, k=1,…,N-1, are estimated by means of a
two-step procedure. At first, collected data are used to build a cumulative histogram in which the value
ck associated with the k-th column of the histogram represents the total number of acquired samples
exhibiting an output code equal to or lower than k. Then, the corresponding transition level Tk is
estimated by inverting the known probability distribution function of the input test stimulus. In fact, it
1 , , 1 cos ˆ = − − = k N M c A d Tk π k l ,
where A and d are the amplitude and the offset of the sinewave, respectively, M is the length of the collected record, and N is the number of ADC output codes. The SHT accuracy when a sinusoidal stimulus is affected by an AWGN has been already analyzed in previous research works, showing that the AWGN introduces both a random contribution and a bias into the estimator uncertainty [10],[11]. The estimator bias can be made negligible by overdriving the ADC, i.e. by applying a sinewave amplitude suitably higher than the ADC Full Scale (FS) [10]. Conversely, for large values of M, the variance of (1) is given by [4]: 1 1 78 1 78 1 2 2 2 ≅ − ≤ ≥ = − N k T A M A T A M k k Tk . , , ,..., . σ σ σ
,
σ being the standard deviation of the AWGN. Observe that the estimator variance tends to zero as M increases. Moreover, if the AWGN estimator bias is made negligible, (2) can be inverted to obtain the data record size M as a function of the target SHT accuracy [10], thus obtaining:
2 2 78 . 1 INL U K A M ≥ σ ν ,
where UINL is the target expanded INL uncertainty and Kν is the coverage factor corresponding to a
degree of confidence ν [11].
B. Effect of Moving-Average Filtering on SHT results
The traditional SHT procedure does not take advantage of the characteristics of the INL pattern, which may be decomposed in two components, a LCF and a HCF ones [5]. The idea behind this work is that the LCF component can be estimated by observing that the estimated INL sequence can be written as:
[ ]
k INL[ ] [ ]
k ek LN
Iˆ = + , k=1,…N-1, (4)
where it has been shown that the estimation error e
[]
⋅ can be assumed to be a white sequence ofrandom variables as long as the input noise level is lower than the code bin width ∆ [6]. Thus, an
appropriate low-pass filtering of the INL sequence provided by the SHT may remove high-frequency random contributions affecting the estimator, leading to a significant accuracy improvement in the estimation of the LCF-INL pattern.
Consider, for instance, the sequence INL obtained by applying a low-pass moving-average (MA)
[]
⋅filter over P estimated INL values related to adjacent code bins:
[ ]
[ ]
( ) ( )∑
−− − = + = 2 / 1 2 / 1 1 P P i i k INL P k INL , k= (P-1)/2,…, N-1-(P-1)/2 , P odd (5)It can easily be shown that the variance σINL2 at the output of the MA filter is
∆
<
≅
σ
σ
σ
INL2 e2/
P
,
. (6)where σe2 represents the variance of the estimation error. Thus, if the code bin width is smaller than
the input noise level [9], the MA filtering leads to an LCF-INL estimator variance that is proportional to 1/MP. Consequently, as long as the estimator bias is negligible, the same estimator uncertainty of an SHT performed on M’=MP samples may be achieved by averaging over P values the SHT results obtained using a record of M samples.
Notice that, if the input noise level exceeds the code bin width, the estimation errors in adjacent
transition levels are correlated. Hence, the resulting σINL2 could be quite greater than (6). Nevertheless,
the record size M may be noticeably lower than that usually required by conventional SHT.
One limitation of the proposed approach is that while the filtering process does not affect the LCF component of the INL pattern, the HCF content could be considerably smoothed if large values of P are used. Thus, a suitable tradeoff between the data record size M and the filter length P must be find . As a rule of thumb, in order to minimize the distortion introduced by filtering, 1/P should be at least (1)
(3) (2)
one order of magnitude larger than the bandwidth of the INL sequence.
III. Simulation Results
The proposed test strategy has been applied to a simulated 12-bit ADC converter with a Full Scale FS=10 V. The maximum INL error has been set equal to 0.7 Least Significant Bits (LSB). In order to minimize the estimator bias, a 25 kHz sinewave with a small overdrive of 0.04 V and no offset (A=10.04 V, d=0.0 V) has been chosen for the test [10]. The AWGN superimposed to the sinewave has
been assumed to have a standard deviation σ=0.5 LSB. The SHT has been initially designed to achieve
a target expanded uncertainty UINL=0.1LSB. Consequently, by assuming a coverage factor Kν=3,
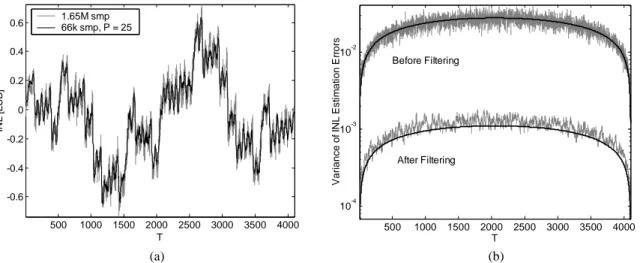
according to (3) the SHT requires a data record consisting of M’=1.650.000 samples. Alternatively, a faster test can be performed using only M=66.000 samples and a MA filter with length P=25. Fig. 1(a) shows the INL patterns estimated using both the conventional SHT and the MA filtered SHT as a function of the transition levels. Observe that the filtered results still provide a good estimate of the INL pattern, but using a data record size 25 times smaller. The estimator error variances for the SHT performed with M=66.000, before and after applying the MA filtering are plotted in Fig. 1(b). In Fig. 1: (a) Estimated INL patterns of a simulated 12-bit ADC, obtained with a conventional SHT for M’ = 1.650.000 (grey curve) and a MA filtered SHT for M=66.000, P=25 (black curve). (b) INL estimator error variances for the MA filtered SHT, both before and after averaging; the black curves correspond to the theoretical expressions (2) and (5), while the grey curves are simulation results. (a) 500 1000 1500 2000 2500 3000 3500 4000 -0.6 -0.4 -0.2 0 0.2 0.4 0.6 T IN L [L S B ] 1.65M smp 66k smp, P = 25 (b) 500 1000 1500 2000 2500 3000 3500 4000 10-4 10-3 10-2 T V a ri a n c e o f IN L E s ti ma ti o n E rro rs Before Filtering After Filtering
Fig. 2: (a) Estimated INL patterns of a simulated 12-bit ADC, obtained with a conventional SHT for M’ = 1.650.000 (grey curve) and a MA filtered SHT for M=16.400 and P=101 (black curve). (b) INL estimator error variances for the MA filtered SHT, both before and after averaging; the black curves correspond to the theoretical expressions (2) and (5), while the grey curves are simulation results. (a) 500 1000 1500 2000 2500 3000 3500 4000 -0.6 -0.4 -0.2 0 0.2 0.4 0.6 T IN L [L S B ] 1.65M smp 16.4k smp, P = 101 (b) 500 1000 1500 2000 2500 3000 3500 4000 10-3 10-2 10-1 T V a ri ance of I N L E s ti m a ti on E rr o rs Before Filtering After Filtering
particular, both the theoretical variance values obtained from (2) and (5), and the simulation results are reported as a function of the transition levels. Notice that the SHT accuracy is actually improved by the low-pass filtering, and that the simulation-based results show a good agreement with the theoretical model. The analysis has been repeated for different values of M and P. In particular, Fig. 2(a) and 2(b) are obtained considering a SHT on M=16.400 samples, followed by a MA filtering with P=101. Again, Fig. 2(b) shows that the record size can be considerably reduced without affecting the estimator variance. However, in this case the estimated INL looks slightly distorted with respect to the pattern resulting from the conventional SHT (see Fig. 2(a)). This is due to the narrow bandwidth of the adopted MA filter (i.e. to the large value of P), which reduces the sensitivity of the test procedure to fast INL variations.
IV. Experimental Results
In order to validate the results described in section II, several experiments have been performed to estimate the INL of an 8-bit ADC embedded in a NI 5911 high-speed digitizer. The device under test can be fully characterized using the default setting of the digitizer, i.e. a sampling rate equal to 100
Msamples/s and a Full Scale (FS) range equal to ±10 V. A 25 kHz low-distortion sinewave produced
by a Stanford Research DS360 function generator has been used as input stimulus for the test. The number of samples and the amount of overdrive required by the procedure depend on the desired
expanded uncertainty levels, and can be established after estimating the noise standard deviation σ. In
the considered case, UINL=2.5% LSB andσ=0.052 V, so that the overdrive voltage is Vod ≅ 0.45 V,
while the offset d of the waveform is assumed to be 0 V [2]. In order for the SHT random uncertainty
to be lower than 4% LSB, according to (3) about 106 test samples should be collected. On the other
hand, only 106/P samples are required to estimate the same INL pattern with the same accuracy when
the fast SHT procedure is applied. In Fig. 3 the estimated INL patterns using 106, 2·105, and 105 test
samples are shown before and after the appropriate MA filtering operations.In order to achieve the
same target estimation accuracy, the SHT results obtained from 106 samples are not filtered, whereas
the INL values calculated using 2·105 and 1·105 test data, are averaged over P=5 and P=9 values,
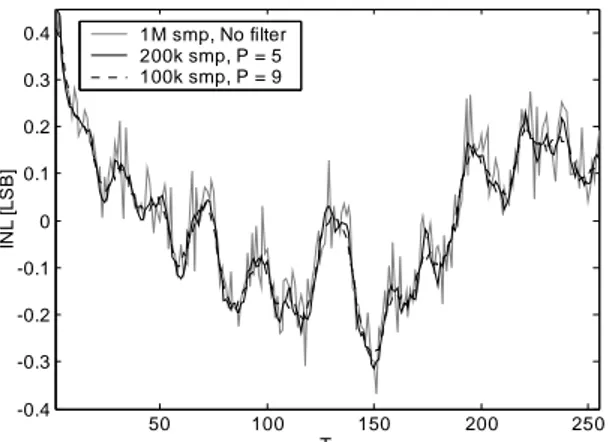
respectively. Observe that the low-frequency content of the INL pattern is estimated with good accuracy in all cases, whereas the high-frequency components are increasingly smoothed as the cut-off frequency of the MA filter decreases. The estimated and theoretical variances of the INL estimation errors before and after the averaging operations for P=5 and P=9 are shown in Fig. 4(a) and 4(b), respectively. Notice that while in the previously discussed simulation data sets case there is a very good accordance between theoretical and experimental variances, in present analysis, involving experimental data sets, the actual variance seems to be slightly larger than expected. Most probably, this is due to a certain amount of residual cross-correlation between subsequent INL estimators, which decreases the effectiveness of the averaging operation.
Fig. 3: INL patterns of the 8 bit ADC employed in an NI5911 digitizer, obtained with a conventional
SHT and two fast MA-based SHT. The INL values are estimated using 106, 2·105, and 105 test data
samples and with an appropriate MA filtering. In order to preserve the expected accuracy in the
estimation process, the INL values obtained from the record consisting of 2·105 data are averaged
over P=5, whereas the results derived using 105 samples are averaged over P=9.
50 100 150 200 250 -0.4 -0.3 -0.2 -0.1 0 0.1 0.2 0.3 0.4 T IN L [L S B ] 1M smp, No filter 200k smp, P = 5 100k smp, P = 9
V. Conclusions
In this paper a very simple strategy to speed up the INL estimation of high-resolution ADCs is presented. According to the proposed approach, by low-pass filtering the INL sequence estimated through the Sinewave Histogram Test, a remarkable accuracy improvement can be achieved, thus relaxing the usual record size requirements. In fact, since the INL estimation errors can be usually modeled as an almost white broadband process, a simple low-pass filter such as a moving average over an adequate number of adjacent INL values can greatly attenuate the high-frequency random contributions without affecting significantly the INL pattern. Simulations and experimental results in two different cases of study confirm that MA filtering can provide a considerable improvement in estimation accuracy, although such an improvement can be lower than expected when the input noise level is greater than the code bin width.
References
[1] A. Grochowski, D. Bhattacharya, T. R. Viswanathan, K. Laker, “Integrated Circuit Testing for Quality Assurance in Manufacturing: History, Current Status, and Future Trends,” IEEE Trans. Circuits Systems II, vol. 44, no. 8, pp. 610-633, Aug. 1997.
[2] IEEE Std. 1241-2000, “IEEE Standard for terminology and test methods for analog to digital converters”.
[3] P. Carbone, E. Nunzi, D. Petri, “Efficiency of ADC Linearity Estimators,” IEEE Trans. on Instrumentation and Measurement, Vol. 51, No. 4, pp. 849-852, Aug. 2002.
[4] P. Carbone, D. Petri, “Noise Sensitivity of the ADC Histogram Test,” IEEE Trans. on Instrumentation and Measurement, Vol. 47, No. 4, pp. 1001-1004, Jun. 1998.
[5] A. Moschitta, P. Carbone, D. Petri, “Statistical Performance of Gaussian ADC Histogram Test”,
Proc. 8th International Workshop on ADC Modelling and Testing (IWADC), Perugia, Italy, pp.
213-217, Sep. 8-10, 2003.
[6] J. M. Janik, “Estimation of A/D Converter Nonlinearities from Complex Spectrum”, Proc. 8th
International Workshop on ADC Modelling and Testing (IWADC), Perugia, Italy, pp. 205-208, Sep.8-10 2003.
[7] F. Adamo, F. Attivissimo, N. Giaquinto, I. Kale, “Measuring Dynamic Nonlinearity of A/D
Converters Via Spectral Methods”, Proc. 8th International Workshop on ADC Modelling and
Testing (IWADC) 2003, Perugia, Italy, pp. 167-170, Sep.8-10, 2003.
[8] A. C. Serra, M. F. da Silva, P. Ramos, L. Michaeli, J. Šaliga, “Fast ADC Testing by Spectral Analysis,” Proc. IEEE Instrumentation and Measurement Technology Conference (IMTC), Como, Italy, pp. 823-828, May 18-20, 2004.
[9] C. Wegener, M. P. Kennedy, “Linear Model-Based Testing of ADC Nonlinearities”, IEEE Trans. Fig. 4: INL estimator error variances for the MA filtered SHT performed on the ADC employed in an NI 5911 digitizer. In (a) the estimation variance is reported both before and after moving
averaging over P=5 values, for a SHT run using 2·105 samples and the corresponding error
variances are reported. In (b), similar results are shown using only 105 samples and P=9. Like in
Fig. 2, the black curves correspond to the theoretical variances resulting from (2) and (5), while the grey curves are based on experimental results.
(a) 50 100 150 200 250 10-4 10-3 T Var ian ce of I N L Es ti m a ti on Er ro rs Before Filtering After Filtering (b) 50 100 150 200 250 10-3 T V a ri a n c e o f IN L E s ti m a ti o n E rro rs Before Filtering After Filtering
on Circuits and Systems-I, Vol. 51, No. 1, Jan. 2004
[10] J. Blair, "Histogram measurement of ADC nonlinearities using sine waves," IEEE Trans. on Instrumentation and Measurement, Vol. 43, No. 3, pp. 373-383, Jun. 1994.