UNIVERSITA’ DEGLI STUDI DI NAPOLI “FEDERICO II”
PhD thesis in Industrial Products and Process Engineering
(XXXI cycle)
“
TUNEABLE HYDROGEL PLATFORM FOR
OLIGONUCLEOTIDE BIOMARKERS DETECTION
”
Tania Mariastella Caputo
Supervisors:
Coordinator:
Prof. Dr. Paolo Antonio Netti
Prof. Dr. Giuseppe Mensitieri
Prof. Dr. Filippo Causa
Advisor:
Dr. Edmondo Battista
I
TABLE OF CONTENTS
LIST OF FIGURES IV
LIST OF TABLES VIII
LIST OF ABBREVIATIONS X CHAPTER 1 ABSTRACT ... 1 1. INTRODUCTION ... 3 1.1 HYDROGELS IN BIOSENSING ... 3 1.1.1. CLASSIFICATION OF HYDROGELS ... 5 1.1.2. HYDROGEL MATERIALS ... 6 1.2. PROBE IMMOBILIZATION ... 7
1.2.1. DOUBLE STRAND PROBE ... 8
1.2.2. MOLECULAR BEACON ... 11
1.3. HYDROGEL CHARACTERISTICS FOR BIOSENSING ... 13
2. SYNTHESIS OF HYDROGELS ... 18
3. BIOMARKERS DESCRIPTION AND DETECTION BY HYDROGELS ... 21
4. AIM AND OUTLINE OF DISSERTATION ... 26
REFERENCES ... 28
CHAPTER 2 “TOEHOLD-MEDIATED STRAND DISPLACEMENT MICROGELS: BIOASSAY FOR CYTOMEGALOVIRUS INFECTION DIAGNOSIS”... 39
1. INTRODUCTION ... 40
2. EXPERIMENTAL SECTION ... 41
2.1. MATERIALS ... 41
2.2. PROBE DESIGN ... 42
2.3. MICROGEL SYNTHESIS AND FUNCTIONALIZATION ... 43
2.4. FLUORESCENCE MEASUREMENT ... 43
2.5. STATISTICAL ANALYSIS ... 45
3. RESULTS AND DISCUSSION ... 45
3.1. PROBE DESIGN ... 45
3.2. MICROGEL SYNTHESIS AND FUNCTIONALIZATION ... 48
3.3. ASSAY SET-UP ... 50
4. CONCLUSION ... 55
II
CHAPTER 3
“MOLECULAR BEACONS BIO-CONJUGATED MICROGELS: BIOASSAY FOR
MIRNA BIOMARKER DETECTION IN CANCER” ... 60
1. INTRODUCTION ... 61
2. EXPERIMENTAL SECTION ... 63
2.1. MATERIALS ... 63
2.2. MOLECULAR BEACON DESIGN... 63
2.3. MICROGEL SYNTHESIS ... 64
2.4. MOLECULAR BEACONS CONJUGATION. ... 65
2.5. SPECIFICITY ... 65
2.6. MICROGEL ASSAY. ... 66
2.7. HUMAN SERUM ANALYSIS ... 66
2.8. STATISTICAL ANALYSIS ... 67
3. RESULTS AND DISCUSSION ... 67
3.1. MOLECULAR BEACON DESIGN. ... 67
3.2. MICROGEL SYNTHESIS AND BIOCONJUGATION. ... 71
3.3. ASSAY SENSITIVITY AND KINETICS ... 72
3.4. ASSAY SPECIFICITY... 77
3.5. HUMAN SERUM ASSAY ... 79
4. CONCLUSION ... 81
REFERENCES ... 82
APPENDIX ... 86
CHAPTER 4 “MICROGELS FOR LONG OLIGONUCLEOTIDE SEQUENCE DETECTION” ... 89
1. INTRODUCTION ... 90
2. EXPERIMENTAL SECTION ... 91
2.1. MATERIALS ... 91
2.2. PROBE DESIGN ... 91
2.3. MICROGEL SYNTHESIS AND BIOCONJUGATION ... 93
2.4. MICROGEL ASSAY ... 93
2.5. STATISTICAL ANALYSIS ... 94
3. RESULTS AND DISCUSSION ... 96
3.1. DOUBLE STRAND-MICROGEL ASSAY ... 96
3.2. MOLECULAR BEACON-MICROGEL ASSAY ... 101
4. CONCLUSION ... 111
III
CHAPTER 5
“3D-HYDROGEL MICROPARTICLES: MIX-READ BIOASSAY FOR
OLIGONUCLEOTIDE DETECTION. CASE STUDY OF MIR-143-3P DETECTION AS
EARLY BIOMARKER IN AMYOTROPHIC LATERAL SCLEROSIS” ... 114
1. INTRODUCTION ... 115
2. EXPERIMENTAL SECTION ... 117
2.1. PROBE DESIGN AND DENSITY ... 117
2.2. MICROFLUIDIC SYNTHESIS OF 3D-HYDROGEL MICROPARTICLES AND CHARACTERIZATION ... 119
2.3. ASSAY SET UP IN BUFFER AND HUMAN SERUM ... 121
2.4. SPECIFICITY ASSAY... 121
2.5. STATISTICAL ANALYSIS ... 121
3. RESULTS AND DISCUSSION ... 122
3.1. PROBE DESIGN AND DENSITY OPTIMIZATION ... 122
3.2. THREE-DIMENSIONAL HYDROGEL MICROPARTICLES SYNTHESIS ... 128
3.3. ASSAY SET-UP AND HUMAN SERUM ANALYSIS ... 131
3.4. ASSAY SENSITIVITY AND SPECIFICITY ... 132
4. CONCLUSION ... 135
REFERENCE ... 136
CHAPTER 6 CONCLUSIONS AND FUTURE PERSPECTIVES ... 140
IV
LIST OF FIGURES
CHAPTER 1
Figure 1 Histogram showing the increase in publications related to the keyword “hydrogel” “biosensor” during the past
30 years. PubMed data ... 4
Figure 2 Classification of hydrogels ... 6 Figure 3 Double strand toehold mediated displacement assay. A) double strand probe structure. B) mechanism of
displacement mediated by toehold domains; C) Strand displacement rate constant plotted against toehold length and composition (A/C Reprinted from Nat. Chem 2011 reference 38;-Reprinted from J. Am. Chem. Soc. 2009 ref 37;). ... 9
Figure 4 Constant dissociation Kd predicted from solution-phase thermodynamic parameters(lines) compared with those
determined experimentally (empty circle) (Reprinted from Nucleic Acid Research, 1999, reference 42) ... 10
Figure 5 Acridyte™ group attached to oligonucleotide ... 11 Figure 6 Phase transitions of molecular beacons with targets in solution. Phase 1: fluorescent molecular beacon–target
duplex; phase 2: nonfluorescent stem–loop hairpin; and phase 3: fluorescent random coil (Reprinted from Springer. 2013, reference 51) ... 12
Figure 7 Swelling of hydrogel PEGDA microparticles synthetized with different molecular weight of starting monomer
(Reprinted from Biomed. Microdevices, 2008, reference 95) ... 15
Figure 8 Hydrogel particles. A) Core–shell microgels obtained by free-radical polymerization and seeded polymerization
(Reprinted by J. Am. Chem. Soc., 2015, reference 41; B) Hydrogel microparticles obtained by droplet generation; C) Flow-focusing microfluidic droplet generation device (Reprinted from Colloids Surf B Biointerfaces, 2016, reference 113); E) Microparticles synthetized by stop-flow lithography technique (Reprinted from Nat. Mater, 2006, 116); F) Janus particles by stop-flow lithography (Reprinted from Appl. Mater. Today, 2017, reference 117); F) Stop flow lithography mechanism (Reprinted from Nat. Mater, 2006, 116) ... 21
Figure 9 Relation of biomarkers to other technologies and health care (Reprinted from Springer, 2010, reference
120) ... 22
Figure 10 Circulating DNA is released in the serum of cancer patient by apoptosis, necrosis or secretion from the cancer
cells. The DNA circulating in human fluid have different size and is affected by mutation, methylation or alterations. Moreover, viral DNA is also detectable in some tumor caused by virus such as human papillomavirus (HPV), hepatitis B virus (HBV) and Epstein–Barr virus (EBV) (Reprinted from Nat Rev Cancer, 2011, 140)………23
CHAPTER 2
Figure 1 Overview of the assay: A) Double strand probe is designed based on specific biomarker selection. B) Microgel
functionalization and fluorescence recovery mechanism involved in target detection. C) Microgels assay working range (nM-aM) and D) LOD tunability is based on the number of microgels used for assay. ... 45
Figure 2 A) Representation of alignment results for hcmv-miRUS4-5p calculated by mirbase.org B)Fluorescence
emission intensity of the tail labelled strand(F, 5nM) and duplex tail-quencher strand (QF, 5nM 1:1 ratio). . C) Fluorescence recovery as a function of time in toehold-mediated strand displacement assay after addition 5nM (empty circle) and 50 nM (full circle) of hcmv-miR-US4-5p target, in homogeneous condition; D) Fluorescence recovery in presence of 10-fold excess of non-matching miRNA alone (black column) and mixed with the target (red column) ... 46
Figure 3 A-B) Quencher strand (Q) and C) Tail strand (T) folding simulations and their relative free energy... 47 Figure 4 A) Schematic representation of the toehold mediated strand displacement assay on microgel beads; B)
Fluorescence intensity measured for 50µg/mL of microgels with different functionalization grade before the quenching step. In the inset, coupling efficiency obtained for a fixed fluorescent tail and microgels amount increasing the EDC concentrations. Data are presented as fluorescence ratio between the reporter (Atto647N) and the reference dye(Rhodamine); C) Quenching efficiency of the above-mentioned functionalised microgels; D) Fluorescence recovery as a function of time in toehold mediated strand displacement assay after addition 5nM (empty circle) and 50 nM (full circle) of hcmv-miR-US4-5p target. ... 50
V
Figure 5A) Images collected by CLSM and B) analysed with the software dedicate; Fluorescence intensity recovery, in
presence of hcmv-miR-US4-5p (106-10-1 fM) obtained using with 50µg/mL (C), 25µg/mL (D) and 0.5µg/mL(E) of
microgels ... 51
Figure 6 A) Microgels fluorescence recovery measured by spectrofluorometer: using 50 and 25 µg/mL of microgels. B) Comparison between homogenous (5nM of free double strand probe, empty square) and heterogeneous (50µg/mL of functionalised microgels, full black square) assay in human serum in presence of excess of target (50nM); C) Microgel stability measured over a range of 1 years. Black square corresponding to quenched microgels, while red dots to un-quenched microgels. Data are presented as fluorescence intensity ratio between the reporter (Atto647N) and the reference dye(Rhodamine). ... 52
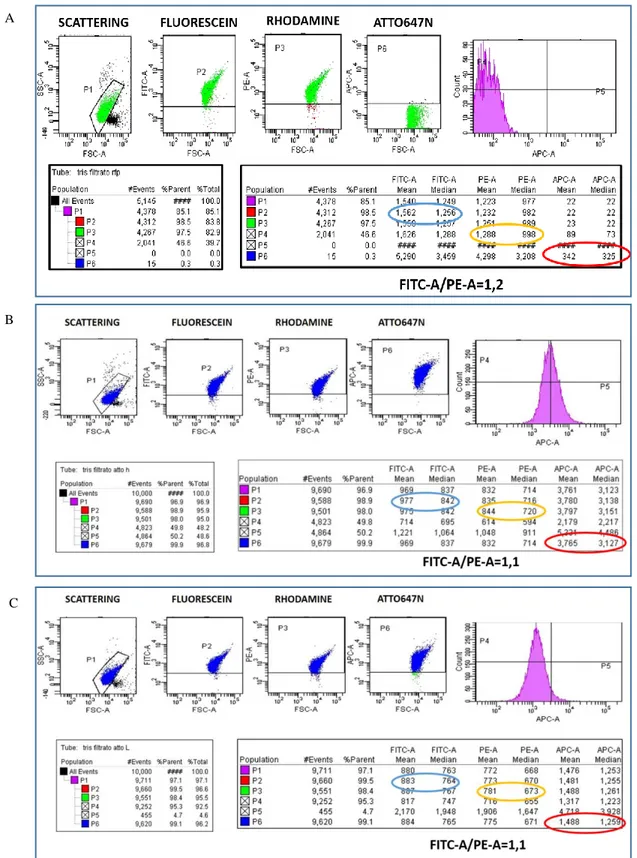
Figure 7 FACS measurements: A) Microgel without functionalization; B) Unquenched microgel; C) Quenched microgel ... 54
CHAPTER 3 Figure 1 Folding simulation prediction of MBS5 and MBS6 and predicted thermodynamic parameters... 68
Figure 2 Hybridization kinetics of molecular beacon MBS5 (A) and MBS6(B) in the presence of wild-type target miR-21 in hybridization buffer at rt. ... 68
Figure 3 Melting and annealing profiles of MBS5(A) and MBS6 (B). Molecular beacons were melted from 20 to 95°C (red circle) and annealed (black square) in hybridization buffer. Moreover, MBS5 and MBS6 were priory melted to 95°C and then annealed until 20°C in presence of 500nM (10fold excess respect to MB) of miR-21 wild type (blue triangle). ... 69
Figure 4 Hybridization kinetics of molecular beacon MBS5 (A) and MBS6 (B) in the presence of wild-type and mutants miR-21... 69
Figure 5 Melting and annealing profiles of MBS5 (A) and MBS6 (B). Molecular beacons were melted from 20 to 95°C and then annealed until 20°C in presence of 500nM (10fold excess respect to MB) of miR-21 wild type, mutated miR-21 (-1-a, -1-b, -2, -3) and non-matching miR-143. ... 70
Figure 6 Signal-to-noise ratio of MBS5 (A) and MBS6(B) at different functionalization degree. ... 72
Figure 7 MBS5-microgels (red) and MB6-microgels (green) assay performances. A -B) microgels coupled with 1nmol, C-D) 0.5nmol and E-F) 0.1nmol of molecular beacons. ... 73
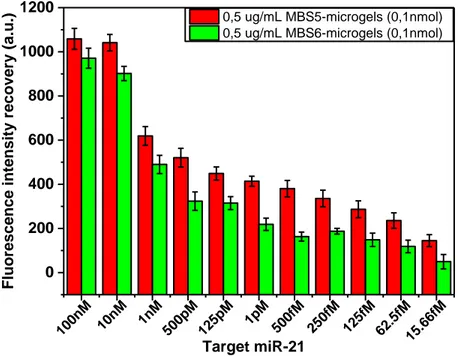
Figure 8 Target detection performances of mb-microgels with concentration scaled to 0.5ug/mL. ... 74
Figure 9 MBS5-(A) and MBS6-(B) microgels kinetic of hybridizations measured by spectrofluorometer ... 75
Figure 10 MBS5(A) and MBS6(B) kinetic of hybridizations measured by confocal microscope. ... 76
Figure 11 MBS5-microgels specificity tested towards wild-type miR-21, four mutated miR-21 sequences and a non-matching sequence (miR-143). ... 77
Figure 12 MBS6-microgels specificity tested towards wild-type miR-21, four mutated miR-21 sequences and a non-matching sequence (miR-143). ... 78
Figure 13 Mb-microgels assay in human serum. Fluorescence ATTO 647N intensity value is normalized to the rhodamine intensity………...………..79
Figure 14 Signal-to-ratio of MBS5-microgels calculated by CLSM in PBS and in serum and by FACS ... 80
CHAPTER 4 Figure 1 Ds-Probe study: folding simulation (P1-A, P2-B), fluorescence analysis (P1-C, P2-D) and kinetics of hybridizations (P1-E, P2-F) ... 97
Figure 2 Cross-reactivity experiments: ds-P1 (A) and ds-P2 (B) probes were monitored in presence of the correspondent homologous Target ss P2 and P1(black square). After that, the specific target P1(blue square) and P2 (red square) is added and fluorescence emission collected for the following 24hours. ... 98
Figure 3 Fluorescence intensity measured by CLSM of quenched and unquenched probe P1 (A) and P2(B) ... 98
Figure 4 Double strand probe functionalized microgels performance. Fluorescence intensity recovery measure for P1- (A) and P2-microgel -(C) after addition of the target and their correlated percentage of displacement(P1-B/P2-D). ... 99
VI
Figure 6 Folding simulation of the target ss P1 (A) and P2(B). The arrows indicate the target sequence complementary
to the loop of the Molecular Beacon P1(C) and Molecular Beacon P2(D) ... 101
Figure 7 Melting curve and hybridization kinetics of molecular beacon used in this study. Melting profile of MBP1(A)
and MBP2 (C) is obtained plotting the normalized fluorescence intensity as function of the temperature. In the inset is plotted the folded fraction vs the temperature. The melting point (Tm) is the inflection point of the curve. Kinetic of hybridization of MBP1 (B) and MBP2(D). in the inset the melting curve of the solution. ... 102
Figure 8 Titration curve of MBP1(A) and MBP2 (B). from the fitting of the curve is calculated the specific kd of each
molecular beacon. ... 103
Figure 9 Cross-reactivity experiments: MBP1 (A) and MBP2 (B) probes were monitored in presence of the correspondent
homologous Target ss P2 and P1(black square). After that, the specific target P1(blue dots) and P2 (red dots) is added and fluorescence emission collected for the following 24hours. ... 104
Figure 10 Molecular beacon bioconjugated microgels performances in long oligonucleotide target detection. MBP1- (A)
and MBP2- (B) microgel with 0.1nmol functionalization (L); MBP1-(C) and MBP2- (D) microgel with 0.25nmol functionalization (M); MBP1- (E) and MBP2- (F) microgel with 0.5nmol of functionalization (H). ... 105
Figure 11 Kinetic of hybridization of MBP1 (A) and MBP2(B). Fluorescence recovery of low(L), medium(M) and
high(H) functionalized microgels was recorder in the time, mixing 50ug/mL of microgels with 500nM of Target (111nt). ... 106
Figure 12 Hybridization kinetics and melting curve and of MBP1 and MBP2 in presence of the short Target P1 and
P2 ... 106
Figure 13 MBP1-microgels cross-reactivity experiment results (A). Molecular beacon bio-conjugated microgels
performances in short oligonucleotide target detection measured for MBP1- (L) 0.1nmol of immobilized probes (B); MBP1- (M) 0.25nmol -(C); and MBP1- (D) 0.5nmol (H). ... 107
Figure 14 MBP2-microgels cross-reactivity experiment results (A).Molecular beacon bio-conjugated microgels
performances in short oligonucleotide target detection measured for MBP1- (L) 0.1nmol of immobilized probes (B) and MBP1- (M) 0.25nmol -(C). D) Folding prediction of the short target P2. ... 108
Figure 15 Kinetic of hybridization of MBP1 (A) and MBP2(B). Fluorescence recovery of mb-microgels was recorder in
the time, mixing 50ug/mL of microgels with 500nM of short Target (P1-24nt; P2 23nt). ... 109
CHAPTER 5
Figure 1 Folding simulation of the Tail(A) and Quencher(B)r strands using UNAFold and setting 50nM of
oligonucleotide, 200mM of NaCl and 25°C as parameters. ... 122
Figure 2 QF* probe/miR-143-3p kinetic of hybridizations ... 123 Figure 3 A)Fluorescence quenching titration to calculate kb of the probe. The stoichiometric ratio was determined by the
intersection point of two straight lines extended, respectively, from the initial linear part and the plateau part of the titration curve. B) Melting profile, in the inset QF*probe annealing and melting curve ... 124
Figure 4 Mechanism of target detection used to analyse the probe in solution and in bulk ... 124 Figure 5 Quenching of fluorescence *QFb in PEGDA 10% (A) and 20% (B). Each step was collected after 3 days of
incubation. ... 125
Figure 6 Kinetic of quenching in PEGDA 10%-15%-20% with several oligonucleotides concentrations: (a) F* 1μM- Q*
1x; (b) F* 1μM- Q* 5x; (c) F* 5μM-Q* 1x; (d) F* 5μM- Q* 5x. ... 126
Figure 7 Bulk displacement efficiency ... 127 Figure 8 Target detection mechanism in 3D-hydrogel microparticles ... 128 Figure 9 A) Schematic representation of microfluidic synthesis set-up for microparticles production; UV free radical
photopolymerization between PEGDA and methacrylate oligonucleotide ... 129
Figure 10 A) Geometry and size of the Dolomite chip; B)Droplet generation by microfluidic T-junction device... 129 Figure 11 A)Size distribution of functionalized microparticles (PEGDA 10%, 15%, 20%) w/v); B) Optical image of
monodisperse microparticles; Swelling parameters ( Q, ξ, Mc) for different polymer concentrations ... 130
Figure 12 A)Plot profile of fluorescence intensity of Oligonucleotide diffusion in microparticles. B) Time lapse of
VII
Figure 13:(a)Fluorescence intensity measured during the hydrogel based assay setup and (b) the corresponding CLSM
images. In particular, the figure shows the fundamental steps involved in the target detection: (I) after the synthesis of functionalized hydrogel; (II) when the fluorescent DNA strand was added; (III) in presence of the target in hybridization buffer and (IV) in human serum. ... 132
Figure 14 (a) MiR143-3p capture efficiency by Hydrogel beads assay and (b) corresponding fluorescence intensity
turn-off (c) Images collected by CLSM for the target concentration analysed (Scale bars: 100 μm). ... 133
VIII
LIST OF TABLES
CHAPTER 1
Table 1 Hydrogel based bioassays for Nucleic acid detection ... 25
CHAPTER 2 Table 1 Oligonucleotide sequences used and their thermodynamic parameters (predictions calculated setting: 5nM of DNA, 200mM of Na+, pH 7-8, 5°C). ... 42
Table 2 Hydrodynamic diameter (Dh) and ζ potential measurement of microgels ... 49
Table 3 Non-linear regression data analysis for ds displacement assay and microgel-based assay performed in presence of hcmv-miR-US4-5p target.by confocal laser scanner microscopy. ... 53
Table 4 Non-linear regression data analysis for ds displacement assay and microgel-based assay performed in presence of hcmv-miR-US4-5p target by Fluorimeter ... 53
CHAPTER 3 Table 1 Molecular beacons and target sequences tested ... 64
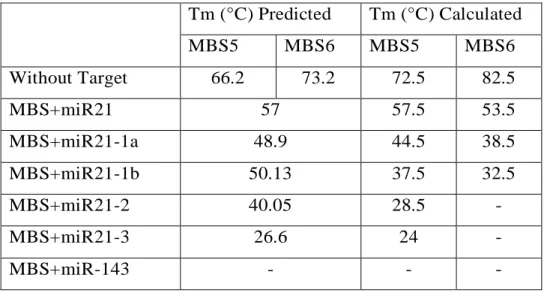
Table 2 Melting temperature (Tm) predicted and calculated of MBS5 and MBS6. The temperatures refer to 50mM of molecular beacons in PBS buffer without the addition of miR or mixed with 500nM miR... 70
Table 3 Data analysis for mb-microgels assay ... 74
Table 4 Data analysis for mb-microgels assay ... 75
Table 5 FACS analysis results 80
CHAPTER 4 Table 1 Sequence, length, modifications and thermodynamic parameters of the DNA probes and targets used in microgel assay. All parameters are calculated by IDT-Integrated, D. N. A. "Technologies. OligoAnalyzer 3.1. Web setting respectively 50nM and 200mM as oligonucleotide and Na+concentration. ... 95
Table 2 Data analysis of ds-microgel assay ... 100
Table 3 Data analysis of Molecular Beacon P1-microgel assay. MBP1-microgels (with 0.1nmol (L), 0.25nmol (M) and 0.5nmol (H) bioconjugation density) are tested in presence of long single strand oligonucleotide Target or the correspondent short target 109
Table 4 Data analysis of Molecular Beacon P2-microgel assay. MBP2 microgels (with 0.1nmol (L), 0.25nmol (M) and 0.5nmol (H) bioconjugation density) are tested in presence of long single strand oligonucleotide Target or the correspondent short target. 109
CHAPTER 5
Table 1 Sequence, length, modifications and thermodynamic parameters of the DNA probes and RNA targets used in
IX
"Technologies. OligoAnalyzer 3.1. Web setting respectively 50nM and 350mM as oligonucleotide and Na+concentration.
TF/QF*hyb represent the free energy gained from the partially complementary T-DNA/F-DNA or F*probe/Q*probe duplex; FTarthyb/*QTarhyb is the free energy gained from the fully complementary Target/F-DNA or Target/Q*probe duplex; Δdisplacement is the free energy gained after T-DNA/F-DNA de-hybridization and Target/F-DNA hybridization
119
Table 2 Sequence, length, modifications and thermodynamic parameters of the DNA probes and RNA targets used in
bulk assay. All parameters are calculated by IDT-Integrated, D. N. A. "Technologies. OligoAnalyzer 3.1. Web, setting
respectively 50nM and 350mM as oligonucleotide and Na+ concentration 119
Table 3 Data analysis for 3D-hydrogel microparticles assay 133
CHAPTER 6
X
LIST OF ABBREVIATIONS
POC Point-Of-CarePEG PolyEthylene Glycol
UV Ultra Violet
DNA Deoxyribose Nucleic Acid RNA Ribose Nucleic Acid
miRNAs Micro RNA
lncRNA Long non coding RNA ctDNA circulating tumor DNA
MB molecular beacon
PCR Polymerase Chain Reaction
qRT-PCR Quantitative Reverse Transcriptase-PCR LOD Limit of detection
LOQ Limit of quantification Kd Constant of dissociation PDMS PolyDiMethylSiloxane
EDC 1-ethyl-3-(3-dimethylaminopropyl) carbodiimide
v2 Polymer Volume Fraction
Mc Molecular weight between crosslinks
ξ Mesh size
PEGDMA PolyEthylene Glycol DiMethacrylate
AAc Acrylic Acid
KPS Potassium PerSulfate
Gd Free Energy of displacement
Fluo Fluoresceine O-methacrylate PVA PolyVinyl Alcohol
Rhod Methacryloxyethyl thiocarbamoyl rhodamine B DMSO Dimethyl Sulfoxide
DLS Dynamic Light Scattering
XI
PEGDA PolyEthylene Glycol DiMethacrylate BSA Bovine Serum Albumin
D Diffusion coefficient
Rh Hydrodinamic Radius
nt Nucleotide
mer Length of oligonucleotide BHQ Black Hole Quencher BBQ BlackBerry Quencher
Ca Capillary Number
LMO Light Mineral Oil
TWEEN 20 Polyethylene glycol sorbitan monolaurate CLSM Confocal Laser Scanning Microscope SEM Scanning Electron Microscope λex Excitation wave length
λem Emission wave length PBS Phosphate Buffered Saline I Fluorescence Intensity
1
ABSTRACT
Early detection of circulating biomarkers in human fluids can improve the quality of life reducing the development of several deadliest diseases. Among the latest and most significant medical concept “Liquid Biopsy” is emerging as non-invasive method of gleaning insight into the dynamics of diseases through a patient fluid sample. Actually many tests have been developed in this context, however, despite all the efforts, the majority are complex, require extensive manipulations and skilled operators, failing for point of care (POC) applications.
The main focus of this thesis has been devoted to develop advanced technologies, based on a hydrogel platform, properly designed for biosensing application. In particular, PEG engineered hydrogel microparticles have been synthetized with different chemical strategies and functionalized with oligonucleotide probes to detect circulating biomarker in human serum. In this thesis, the parameters affecting the hydrogel biosensing properties have been carefully evaluated to obtain an accurate functionalized network capable of sensitive and specific biomarker recognition. The developed hydrogel assays are based on the optical fluorescence read out over a single microgel, fixed the number of microgels and sample volume for each test. Therefore, the target concentration is easily quantified comparing the fluorescence observed with a calibration curve.
The thesis starts with the description of a microgel-based bioassay for Cytomegalovirus infection diagnosis (Chapter 2). The bioassay is based on microgels, with core-shell architecture, endowed with optical fluorescence probes for the recognition of circulating endogenous viral hcmv-miR-US4-5p. In particular, a double strand is used as probe and the recognition is driven by a toehold strand displacement mechanism whit a consequent fluorescence recovery after target capture. The performances of optical detection in terms of dynamic range and limit of detection are finely tuned changing the number of microgels per assay. As results, the limit of detection (LOD) is tuned from fM to aM by 100-fold decreasing the microgel concentration. The assay results specific for the selected target, suitable for several laboratory equipment, stable over a one-year span time and not affected by the presence of serum. Then, a microgel-based bioassay is described for microRNA biomarker detection in cancer application (Chapter 3). In this case, the outmost shell of microgel is functionalized with molecular beacons for circulating miR-21 recognition. The probe design is opportunely projected to reduce the interferences at the surface and the probe density is tuned to minimize the crowding effect. The molecular beacon-microgels assay is resulted very sensitive reaching fM LOD in 3 hours, without preliminary amplification step and using only 20 µL of sample. In addition, the microgel assay is extremely specific towards single mutated targets (SNP). The versatility, the stability in presence of high concentrations of interfering oligonucleotides and capability of work in human serum make the assay very interesting for biosensing application.
2
Is hydrogel-based technology also suitable for long oligonucleotide sequence detection? Yes, it is, and in Chapter 4 are elucidated the main parameters taken into consideration to develop sensitive and specific microgel-based assay for long oligonucleotide detection, as lncRNA, mRNA or DNA. In particular, in this study are considered two DNA sequences of 111 nucleotides, with 70% of sequence similarity. Core-shell microgels are functionalized with double strand or molecular beacon probes and their performance compared. Microgels functionalized with molecular beacons have achieved femtomolar LOD, high specificity toward the similar sequence and rapid time of analysis avoiding sample manipulation. Finally, is described the design of Three-dimensional hydrogel microparticles by microfluidics for the detection of microRNA and in particular is presented a case study of miR-143-3p detection as early biomarker in Amyotrophic lateral sclerosis (Chapter 5). The pivotal steps involved in the design of these 3D hydrogels, homogeneously functionalized into their whole volume, are explained. The design of the immobilized DNA probes and their density are opportunely optimized. Furthermore, the diffusion into the polymer network is tuned adjusting the polymer concentration and consequently the characteristic mesh size. Once these parameters have been set, 3D-hydrogels are synthetized in microfluidics, armed with fluorescent probes and then mixed with the sample solution. Target detection is achieved by double strand displacement assay associated with a fluorescence depletion within the hydrogel microparticles. The optimization of synthesis parameters has allowed to obtained 3D-hydrogel microparticles with wide working range, pM LOD and good specificity. Moreover, due to the PEG anti-fouling property, target detection occurs in human serum with performance comparable to those observed in PBS buffer.
Therefore, the biosensing platform obtained using engineered hydrogels can represent a smart technology capable to predict, identify and follow-up several diseases, monitoring free circulating oligonucleotides in body fluids. The flexible use of these engineered hydrogels, which avoid sample manipulation and can be easily integrated in miniaturized device for optical readout, aims to push these technologies as point of care device.
3
CHAPTER 1
1. INTRODUCTION
Many analytical methods have been developed to identify oligonucleotide biomarkers in human fluids, however, the majority require extensive manipulation of the sample, repeated separation and washing steps resulting time-consuming, expensive and subject to errors. For these reasons, in the last year many
mix & read assays have been developed through engineered biosensors leading the way toward
innovative devices for liquid biopsy and Point of Care (POC) applications1,2. These mix & read assays are easily performed by mixing the sample solution with engineered biosensors equipped by signal generator probes and making possible the reading of a detectable signal in solution or on solid surface.
The work presented in this thesis aims to point out the features of this new class of engineered biosensors, characterized by sensitivity, specificity and capability of work directly in human fluids.
In this chapter are briefly discussed the concerns that have led us to develop hydrogels for biosensing application, focusing on: 1) the appealing properties of hydrogels, the importance of the material choice and the strategy of target capture; 2) the methods available to synthetize hydrogels; 3) the clinical importance of oligonucleotides as innovative circulating biomarkers and the innovative highly performant biosensors based on hydrogel recently developed for oligonucleotide detection.
1.1. HYDROGELS IN BIOSENSING
In Biosensor field, hydrogel-based technologies have attracted considerable attention during the last years, as confirmed by the number of studies published (Figure 1). This huge interest is due to hydrophilic, bio-friendly and highly tunable nature of these materials, which make them very suitable in diagnostics3,4 and in many other biomedical fields such as drug delivery5, tissue engineering6 and pharmaceutical applications 7.
Hydrogels are physically or chemically cross-linked materials able to absorb large amounts of water without dissolve. The capacity to absorb and store water within the polymer network makes them distinctive materials8. Indeed, they absorb water because of the hydrophilic nature of the functional groups present into the polymer backbone and, at the same time, they are resistant to dissolution since
4
the cross-links between network chains. In this way, the water within the hydrogel permits the free diffusion of soluble molecules, while the cross-linked network works as support.
Moreover, hydrogels are easily synthetized with a variety of chemical strategies and functionalized with several biological entities such as nucleic acids or proteins. Thus, hydrogels can be engineered for capture and detection of clinically relevant analytes including but not limited to proteins, DNA, mRNA, and microRNA (miRNA)9.
The main advantages of hydrogels in biosensing consist on their optimal environment for the immobilization, the enhanced molecule permeability, the reduced non-specific interactions with analytes that improve the sensitivity and accuracy, the encoding versatility and the enhanced thermodynamic constant association within the polymeric hydrogel network. However, there are still some limitations that reduce the clinical applications of these hydrogels. In particular, the kinetics of hybridizations are slower compared to free solution probes and the shelf-life of hydrogel biosensors is not well investigated over long period of times. Moreover, it is still necessary to develop sensitive and portable analytic device to ensure the readout of exact measurements.
Figure 1 Histogram showing the increase in publications related to the keyword “hydrogel” “biosensor” during the past 30 years (PubMed data) 0 10 20 30 40 50 60 1985 1990 1995 2000 2005 2010 2015 2020
5
1.1.1. CLASSIFICATION OF HYDROGELS
Hydrogels are classified based on the origin and ionic charges, the nature of swelling, the technique of preparation, physical properties, and nature of crosslinking (Figure 2).
Firstly, Hydrogels can be classified into two groups based on their natural or synthetic origins10. Moreover, they are also divided based on the nature of side groups in neutral or ionic11. In neutral hydrogels, the swelling is driven by the contribution of thermodynamic mixing water-polymer, which contributes to the overall free energy, along with elastic polymer contribution. In ionic hydrogels, the swelling is also affected by the ionic interactions between charged polymers and free ions12. Therefore, these hydrogels, holding ionic groups (such as carboxylic acid) can absorb large amount of water because of their improved hydrophilicity.
Hydrogels can be further classified based on their cross-linking chemistry. In chemically cross-linked hydrogel covalent bonds are present between the different polymer chains. This strong linkage is obtained by monomer polymerization in presence of a crosslinking agent, through several chemical strategies. Physically cross-linked hydrogels, instead, are based on physical interaction between polymer chains (as polymer chain entanglement and/or non-covalent interactions). Sometimes physically cross-linked hydrogels are preferred because they avoid the use of crosslinking agents, which are usually toxic and can affect the integrity of the molecules entrapped into the hydrogel13. However, the attractive forces
holding these networks together are typically based on hydrogen bonding, electrostatic or hydrophobic interactions and gels can be reversibly dissolved under certain conditions that would weaken these attractive forces, i.e. a change in pH14.
Moreover, hydrogels can be grouped based on the interaction with the external environment15. In
particular, hydrogels can change their size or shape in response to stimuli such as the temperature, pH16,17,
ionic strength17, light18 and electric field19.
Finally, hydrogels can be classified based on their dimensions in microgels, microparticles and macrogels. Microgels have diameter included between 100 nm to 1m and are usually definite as a colloidal stable system. Hydrogel microparticles have a diameter ranging from 10 to 100m, while increasing the diameter over 100 m they are classified as macrogels.
6
Figure 2 Classification of hydrogels
1.1.2. HYDROGEL MATERIALS
Many polymers are available to synthetize hydrogels as collagen, gelatin, chitosan, hyaluronic acid, alginate, poly(vinyl alcohol) (PVA), poly(propylene fumarate) (PPF), PNIPAAm20, however, polyethylene glycols (PEGs) are the most used for diagnostic applications. The great popularity of PEG arises by the unique combination of physicochemical and biological properties of the polymer. These included the good solubility in water, the biocompatibility and the capacity to reject protein adsorption (antifouling)21. Moreover, PEGs are low-cost materials and they are available in several molecular weights and chemical modifications22. For all these appealing properties, PEGs are considered ideal
materials to create hydrogels for biosensing applications.
To obtain PEG hydrogels, the polymerization reaction usually occurs by free-radical polymerization between (meth)acrylate or diacrylates PEG derivatives in presence of a UV-sensitive photoinitiator (hydroxyalkylphenone specie)23. In recent years, PEG hydrogels have been successfully obtained also by
click chemistry. This chemistry comprises a variety of specific and controllable biorthogonal reactions. In particular, the recent development of copper-free click chemistry such as strain-promoted azide-alkyne
7
cycloaddition, radical mediated thiol-ene chemistry, DielseAlder reaction, tetrazole-alkene photo-click chemistry, and oxime reaction have allowed forming hydrogels using milder reaction conditions, with high reactivity and selectivity24,25.
However, in order to customize hydrogels for a specific biosensing application is necessary to fine tune the hydrogel microstructure. Hydrogels must be accessible to target molecules maintaining their structural properties. To achieve this goal, the composition of monomers and the polymerization conditions must be tuned to optimize the porosity, the rigidity and the swelling behavior of the hydrogel. As an example, in UV polymerization, increasing the concentration of photoinitiator (1-10%) and the exposure time hydrogels with smaller pore and higher rigidity are obtained. Contrarily, the porosity is augmented increasing the molecular weight of PEG precursor and lowering its concentration. However, longer PEG chain or lower concentration of polymer reduce the cross-linking density with a consequent decrease of the hydrogels rigidity26. Porosity can also be modified adding an inactive porogen27 to the precursor solution, that is washed away after the crosslinking. The diffusion of biomolecules is easily controlled in click chemistry, where the biophysical properties of the hydrogel are adjusted by altering the length of the PEG arms as well as the stoichiometric ratio of species involved in the biorthogonal reaction28.
1.2. PROBE IMMOBILIZATION
Hydrogels for biosensing applications can be prepared by different synthesis processes, however, they must be functionalized with bio-recognition elements motifs such as peptides, enzyme or oligonucleotides to recognize the target. There are numerous immobilization strategies depending on the reactive groups on the substrate and biomolecule, the type of immobilization (covalent and non-covalent) and on the risk for biomolecule damage during the coupling (UV exposure, free radical temperature, strong solvents). The immobilization is carried out by physical adsorption of the bioprobes or by covalent coupling.
In physical adsorption, the immobilization of bioprobes does not require reactive chemical groups and is easily carried out incubating the bio-recognition elements with the substrates29 or physically entrapping
them into the polymer mesh during the crosslinking30. In both cases, low efficiency of immobilization or
high non-specific adsorption is often achieved.
In covalent immobilization, bio-recognition elements are coupled on hydrogel through a covalent bond. In this way, a more robust control over the functionalization is obtained and leaching issues are avoided. Two strategies are mainly used in covalent immobilization. In the first, bioprobes are previously modified
8
with an opportune moiety and then immobilized during the polymerization process (One-step
immobilization). In the second, bioprobes are immobilized after the polymerization step (Two-step immobilization). When PEG hydrogels are used as substrates, during the synthesis are usually added
molecules with a reactive group (i.e. carboxyl group or biotin) and the bio-probes are immobilized using their own reactive groups or are modified with specific moieties (i.e. amino or streptavidin).
In DNA biosensors, bio-recognition elements as double strand and molecular beacon probes are widely used. They are immobilized on the substrate both during the polymerization process and after the synthesis of hydrogels.
1.2.1. DOUBLE STRAND PROBE
The double strand probe31 is composed of two oligonucleotide sequences partially complementary that hybridize forming a stable duplex (figure 3A). Spontaneous dissociation of this double-stranded DNA probe is slow, but in presence of the target strand with higher stability, strand displacement occurs32. Strand displacement can be initiated at complementary single-stranded domains (referred to toeholds)33,34 and advances through a branch migration process that is similar to a random walk (figure 3B). Indeed, in this process a domain displaces another of identical sequence by a series of reversible single nucleotide dissociation and hybridization steps35. The process of displacement is usually monitored by fluorescence
emission fluctuation after tagging the strands with a fluorophore-quencher31 or a fret pair36.
By changing the toehold characteristics, the rate of strand-displacement reactions can be quantitatively controlled. In their studies Zhang and Winfee 37 demonstrated that tuning the length and sequence of the toehold domain the kinetics of strand displacement can be accurately modeled and predicted.
9
Figure 3 Double strand toehold mediated displacement assay. A) double strand probe structure. B) mechanism of displacement mediated by toehold domains; C) Strand displacement rate constant plotted against toehold length and composition (A/C Reprinted from Nat. Chem 2011 reference 38;-Reprinted from J. Am. Chem. Soc. 2009 ref 37;).
In particular, they have simplified the kinetics model of toehold strand displacement to a simple bimolecular reaction with second-order rate constants:
𝑋 (𝑚, 𝑛) + 𝑆
𝑘(𝛽𝑚,𝛽𝑚,𝛾𝑛)
→
𝑘(𝛾𝑛,𝛽𝑚,𝛽𝑚)
← 𝑌 + 𝐿 (𝑚, 𝑛)
The associated forward and reverse second-order rate constants k(βm, βm, γn) and k(γn, βm, βm) for this
bimolecular reaction model (BM) of strand displacement are dependent on the sequences of the βm,βm,
and γn domains (figure 3B), as well as the ambient temperature and salt concentrations37.
In particular, they have shown that the rate constant of the strand displacement reaction can vary over a factor of 106, from 1 M–1 s–1 to 6 × 10⁶ M–1 s–1 and that the GC composition of the toehold strand affects
the kinetics rate of the displacement process. As shown in Figure 3C, toehold composed of only G/C nucleotides (green line) has faster kinetics compared to toehold composed of roughly equal numbers of all four nucleotides, while toehold composed only of A/T nucleotides (red line) are the slowest. The grey region spanned by the green and red traces roughly shows the range of potential kinetics based on toehold
10
length. Based on this consideration is possible to fine engineering control over the kinetics of synthetic DNA devices39.
The double strand probe can be also immobilized on solid surfaces. The hybridization between the probe and the target is converted by the transducer in an optical, electrochemical piezoelectric or thermal quantifiable signal.
In particular, microchips and microparticles have been functionalized with double strand probes for biosensing applications40,41. The density of immobilized capture probes and the equilibrium dissociation constants are calculated through a bimolecular, all-or-none model for hybridization of non-self-complementary sequences by Stevens et al,42. They have found that for an oligonucleotide of 22 mer, immobilized on paramagnetic particles (diameter 0.75 µm) the Kd value is in nM order and at higher
temperatures hybridization on particles is more efficient than in solution.
Figure 4 Constant dissociation Kd predicted from solution-phase thermodynamic parameters(lines) compared with those determined experimentally (empty circle) (Reprinted from Nucleic Acid Research, 1999, reference 42)
Oligonucleotide probes are also introduced during the polymerization reaction through a UV-polymerizable methacrylamide linker (Acrydite™). The incorporation of this group allows engineering various hydrogels reducing the time of synthesis. However, Pregibon et al43 have proved that the efficiency of immobilization of these probes is affected by the amount of reactive species in precursor solutions (their efficiency of immobilization is estimated about ∼5% to 25%). To improve the efficiency of immobilization, they have also suggested to use acrylate probes instead of methacrylate as is known that acrylates react faster than methacrylates43.
11
Once the oligonucleotide-methacrylate probe is immobilized, it can hybridize with the partially complementary probe forming the double strand probe, otherwise, it can directly hybridize with the target sequence. In the latter, the hybridization is converted in an optical, electrochemical or piezoelectric or thermal quantifiable signal.
Figure 5 Acridyte™ group attached to oligonucleotide
1.2.2. MOLECULAR BEACON
Molecular beacons have been firstly introduced by Tyagi and Kramer more than 20 years ago44. Essentially, a molecular beacon is a single strand oligonucleotide sequence containing a fluorophore and a quencher in its opposite ends. It is composed by a target recognition sequence (loop) flanked by two self-complementary terminal arms (stem)45,46. Because of its sequence, in absence of target the two arms
hybridize through a mono-molecular reaction forming a stem-loop structure. In such conformation the fluorophore and quencher are in close proximity with a consequent quenching of the fluorescence47.
When the DNA or RNA target is present, hybridization between the target and the loop sequence of the molecular beacon takes place and the stronger intermolecular hybridization mechanically forces the weaker stem helix to open. Thus, the fluorophore and quencher are spatially separated and fluorescence is restored. Molecular beacons are widely used as oligonucleotide probes due to the higher thermodynamic stability of the hairpin structure, the efficient signal switching and the numerous reporter dyes available. These aspects allow reaching excellent sensitivity and selectivity, and real-time detection capability.
The design of this probe seems easy but is in reality quite sophisticated. Many studies have been focused on the practical rules to design molecular beacons48–51. Briefly, two are the main key factors which determine the characteristics and functionality of the molecular beacon: the probe structure and fluorescence signal switching. As regards the first, the specificity and sensitivity of molecular beacon for its target can be optimized by adjusting the probe length and the GC content. As general rules, the probe sequence has length comprised between 15-30 bases and is free from secondary structure. The stems are 5-7 base pair and have high GC content (75-100%). Shorter stem results faster hybridization, but suffers
12
from lower signal-to-background ratio52,53. Longer stems are particularly suitable for single mismatch detection, however, they have slower kinetics. The fluorescence signal switching is mainly based on dynamic or static fluorescence quenching. Many fluorophores and quenchers existing and they must be carefully selected54.
Figure 6 Phase transitions of molecular beacons with targets in solution. Phase 1: fluorescent molecular beacon–target duplex; phase 2: nonfluorescent stem–loop hairpin; and phase 3: fluorescent random coil (Reprinted from Springer. 2013, reference 51)
Molecular beacons can exist at least in three distinct states: molecular beacon–target duplex (phase 1), stem–loop hairpin (phase 2), and random coil (phase 3). The thermodynamic and the kinetics of these probes have been extensively studied by Bonnet55 and Tsourkas56. In particular, they have studied the
dissociation constants of the transition monitoring the melting curve of molecular beacons in presence and absence of the target. The dissociation constant K2–3 corresponding to the transition between stem–
loop hairpin and random coil is given by:
𝐾2−3 (𝜃) = ( 𝐹 − 𝛽 𝛾 − 𝐹 )
where F is the fluorescence intensity at a given temperature θ, β is the fluorescence of molecular beacons in the hairpin form (obtained at low temperatures, such as 10°C), and γ is the fluorescence of molecular beacons in the random-coil form (obtained at high temperatures, such as 80°C) in the absence of targets.
13
The dissociation constant K1–2 describing the transition between molecular beacon–target duplex and the
stem–loop hairpin can be calculated from the fluorescence data obtained by the melting measurements of molecular beacons in presence of the target:
𝐾1−2(𝑇) = (𝛼 − 𝐹)𝑇0
(𝐹 − 𝛽) + ( 𝐹 − 𝛾 ) 𝐾2−3
where α is the fluorescence intensity of molecular beacon–target duplex at low temperatures such as 10°C.
Their studies have demonstrated that the stem length of a molecular beacon has a greater effect on its equilibrium state than the loop length, and that a target with single-base mismatches exhibit a less favorable binding with molecular beacons. They have also demonstrated that a mismatch positioned in the center of the probe has a greater impact on equilibrium than a terminal mismatch. Furthermore, Chen et al57 have proposed a three-step model to explain the molecular beacon kinetics in solution. They have proved that the first and second step (respectively the formation of few transient base pairs called nucleus and the opening of the stem with more base pairs between probe and target) are the rate-limiting steps, while the third step (complete hybridization between the probe and probe) is much faster.
Due to their excellent properties, molecular beacons have found many applications in biosensing for the detection of several molecules of interest58–65 both in solution and immobilized on solid support. They
are usually coupled by two step immobilization on a variety of supports as glass surfaces, on graphene, gold particles on optical fiber, however, despite all the efforts made, when molecular beacons are immobilized on solid surface the fluorescence background usually increases due to non-specific oligonucleotide-surface interaction and crowding effects66 among the immobilized oligonucleotide
probes. However, these issues are avoided immobilizing molecular beacons into materials with solution-like property. Recently, Dai et al and Ma et al67 have proved that when molecular beacons (modified with
a biotin) are used to functionalize surface-patterned poly(ethylene glycol) hydrogels (endowed with streptavidin), fluorescence background strongly decreased.
1.3.
HYDROGEL CHARACTERISTICS FOR BIOSENSING
Many biosensors have been developed immobilizing oligonucleotide probes on solid surface, as in graphic-2D layered-68, magnetic particles69–71, particles9,72–75, carbon nanomaterias76 and
14
molecules of interest79, however, they suffer of some limitations80, which affect the sensitivity, the specificity and the kinetics of detection. In particular, they are ascribable to the electrostatic repulsion between probe-probe81,82, the steric hindrance between probe-target complex83,84 and the non-specific
adsorption85 on solid substrates. Moreover, the design of the probes86–89 and the different immobilization
methods generate slower kinetics of hybridization and inhomogeneous signal distribution90. Hydrogels
with their tridimensional polymer network can improve these issues, however, during the design of hydrogel-based assay a number of concerns must be taken into consideration. In particular, the swelling behavior of the hydrogel, the probe density and the molecules diffusion affect the sensitivity of the assay. Firstly, the hydrogel structure at the molecular level must be optimized in order to enhance the hybridization between target molecules and immobilized probes, preserving the structural integrity of the hydrogel matrix. To achieve this goal, the monomer composition, the porosity, the rigidity and the swelling behavior of the hydrogel must be tuned. Concerning the porosity and the swelling behavior, it is possible to control these parameters by adjusting the starting material properties as the monomer concentration, the mass weight and the amount of cross-linker. For biosensing application, it is desirable that the diffusion and the target capture are not hindered by the biological fluids composition. For these reasons, hydrogels are opportunely engineered in order to preserve porosity, chemical background, and, therefore, the target diffusion.
The network structure of a hydrogel is characterized by the determination of the polymer fraction (v2,
s), the molecular weight of the polymer chain between two neighboring cross-linking points (Mc) and the correlation distance between them, also known as mesh size (ξ). The nature and the amount of polymer fraction define how a hydrogel is capable to imbibe and retain water, while the Mc and ξ are averaged parameters that define the accessibility and the transport of molecular species in the network40.
However, all these parameters are described theoretically by the equilibrium swelling theory and the rubber elasticity, while a variety of techniques are available to experimentally measure and verify them91. The structural characterization of hydrogels is usually carried out on bulk, calculating the degree of hydration (swelling measurements) by weighting the amount of water up-taken by the polymer and converting it in the volumetric fraction according to the “equilibrium swelling theory” developed by Flory and Rehner92 and then modified by Peppas and Merrill93,94. Swelling on hydrogel particles has been experimentally measured by few groups. Lee et al95 have proved that the swelling on shape-encoded particles increases using PEGDA precursor with higher molecular weight, but the particle shape is isotropic. Recently, Battista et al96 have demonstrated the direct determination of swelling on core/shell microgels responsive to pH, through atomic force microscopy (AFM) analysis.
15
Figure 7 Swelling of hydrogel PEGDA microparticles synthetized with different molecular weight of starting monomer (Reprinted from Biomed. Microdevices, 2008, reference 95)
Another important parameter to take into account is the probe density. Differently from solid surfaces as microarray or polystyrene beads, hydrogels possess higher capacity of probe immobilization due to their tridimensional structure and increased surface area. As results, if first-order Langmuir kinetics is assumed, increasing the probes density more target/probe complex are formed at equilibrium with a consequently improved sensitivity. Comparing glass surfaces and hydrogel pads for microchips development, Srinivas et al97 and Zubstov et al98 have demonstrated that three-dimensional gel networks possess higher capacity for immobilization. They have proved that in surface-based systems the steric hindrance is a limitation with only ∼104 molecules/μm2 immobilized and increasing the amount of probe
the immobilization efficiency is not improved. In contrast, hydrogel substrates allow immobilizing ∼105
molecules/μm2 (calculated on 10 μM of probe concentration and hydrogel height of 35 μm) achieving effective surface density at least 1 order of magnitude greater than glass surface. Furthermore, when solid surfaces are functionalized at maximum capability, the proximity between probes can decrease the target accessibility reducing the assay sensitivity. Otherwise, hydrogels allow immobilizing high amount of probes keeping enough distance between them, hence target is free to diffuse and hybridize with the probe98.
16
Finally, the target diffusion within the polymer matrix must be considered. The structural parameters of hydrogels must be appropriately tuned to promote the diffusion of the target and improve the probe/target complex formation, thus the sensitivity of the detection. This because if the target is bigger than the mesh size of the polymer its diffusion is hindered or is very low. Contrary, if the polymer is too porous, fewer probes are immobilized during its functionalization, affecting the assay sensitivity. In free solution and in absence of any interactions with other target biomolecules, the diffusion process is governed by Stokes-Einstein relation:
𝐷0 =
𝑘𝐵𝑇 (6𝜋𝑅ℎ)
where kB is the Boltzmann constant, T is the temperature in kelvin, is the solvent viscosity and Rh is
the hydrodynamic radius of the target. In hydrogels, the diffusion is described by different models, based on the nature of the biomolecule target.
For oligonucleotide with Rg < a/2, where Rg is the gyration radius of the molecules and a is the mean gel pore size, the diffusion coefficient is calculated by the Zimm99 model:
𝐷0 = 0.196𝑘𝐵𝑇 (𝑅ℎ) ≈ 𝑁0
−1 2 ⁄
When Rg > a/2, the movement of an unattached chain by Brownian motion into the multi-chain system forming by the hydrogel is described by the reputation theory. The lateral movement of the chain is limited by gel fibers with a resulting loss of entropy that brings the chain to migrate inside a tube with length L = Na, where N is the number of pores occupied by the chain. In this condition:
𝐷0 = 𝑘𝐵𝑇 𝑎
2
(3 𝑁𝑘2 𝜁 𝑘𝑏2)
≈ 𝑁0−1⁄2
a represents the pore size, NK is the number of Kuhn segments 𝜁K is the friction coefficient of a Kuhn
segments, and b is the Kuhn length.
In this context, target diffusion and probe/target hybridization are widely studied and modeled in hydrogels. Sorokin et al100 focused on the kinetics of oligonucleotides on microchips using hydrogel pads
and have compared their performance with glass surfaces. They define the hybridization time as: 𝜏𝑑𝑖𝑓𝑓(𝐻) = 𝑅𝑚̃ 𝐾𝑎
17
Where R is radius of microbeads, 𝑚̃ is the probe density for unit area, Ka is the association constant, β
is a numerical factor and is equal to unity for hybridization on the microbeads, Dsol is diffusion coefficient for target DNA in solution, hsol is the homogenous concentration of target in solution.
They have demonstrated that although hydrogels show slower kinetics due to hinder diffusion of analytes within the mesh, the sensitivity at equilibrium and the capability to detect mismatch are increased compared to solid surfaces. This is explained as results of the better thermodynamic association constants within the hydrogel, that appears closer to the ideal solution because of the high water content and the sufficient space between probe molecules despite a higher effective probe density.
Diffusion studies have been carried out by Pregibon and Doyle43 using a three-dimensional hydrogel
array. They have considered a system where target oligonucleotides (Ts in solution and T within the
particles) diffuse into the hydrogel and hybridize with probes P to form complexes TP. Considering that the rules governing this transport are complex, nonlinear and coupled, they have assumed that in a specific regime, which is relevant for most assays, the system can be simplified to a one-dimension problem. Scaling arguments can be made to reduce the complexity of this problem. In this way, they are able to calculate:
(1) the ratio of target to probe molecules γ:
𝛾 = [𝑇𝑠]0𝑉𝑠 ([𝑃]0 𝑁𝑝𝑉𝑝)
where [Ts]0 and [P]0 are respectively the concentration of target and probe at t = 0, Vs is the sample
volume, Np is the number of particle and Vp is the volume of the particle;
(2) the rate of association versus diffusion which is given by the Damköhler number Da 𝐷𝑎 = 𝐾𝑎[𝑃]0
(𝐷𝑔𝑒𝑙⁄𝐿2)
where ka is the second-order association rate constants, Dgel is the target diffusivity and L is the
characteristic length for the diffusion path, and (3) the relative strength of hybridization κ:
κ = 𝐾𝑑 [𝑇𝑠]0 where Kd is the first-order dissociation constant.
18
In the study they have shown that for short oligonucleotide (20bp) ka (106 M-1s-1) is much higher than
D (10-11 m2/s), therefore Da >> 1, if [P]0 is about 10-6 M and L around 10-6 m; even at low amount (<10 -18 mol) the probe can be considered in large excess, therefore << 1, while hybridization is very strong
at initial target concentration (<< 1) if considering Kd in the order of 10-13 M and [Ts]0 around 10-11 M.
In the case of larger oligonucleotide101, k
a is around 103 M-1s-1, while assuming that D is the same of
other biomolecules with the same Rg (10-8–10-10 m2/s), Da can be in the unity range if [P]0 is about 10-6
M and L around 10-6 m; the probe can be considered in large excess even at low amount, therefore <<1. The study has also shown that the 3Dgel array is mass-transport limited since reaction occurs significantly faster than diffusion throughout the gel (Da>>1). These properties can reduce the target diffusion into the hydrogel with a consequent confinement of the signal at the outer edge of the hydrogel particles at low target concentrations.
To sum up, to design sensitive and specific assay based on functionalized hydrogel is very important to tune the polymer/probe composition in order to: avoid swelling effect in biological fluids; have high probe density but, at the same time, permit free diffusion of the target; and guarantee structural stability during the assay.
2. SYNTHESIS OF HYDROGELS
Hydrogels for sensing purpose must be synthetized with finely controlled size, shape and encoding in order to satisfy the bioassay necessity. One of the major advantages of use hydrogels is the multitude of chemical strategies available to synthesize them. These comprise one-step procedures like polymerization and parallel crosslinking of multifunctional monomers, as well as multiple step procedures, concerning synthesis of polymer molecules with reactive groups and their subsequent crosslinking
Microgels are synthetized starting from monofunctional monomers, from polymers or from macrogels. Their synthesis is essentially summarized in three categories based on the particle formation mechanism: homogeneous nucleation, emulsification and complexation.
In the first case, a solution of soluble monomer, including a cross-linking agent, is carried out and microgel particles form over the course of polymerization102. To obtain good control over the particle
formation, the polymer obtained during the polymerization must be insoluble in solution or will form a macrogel. The homogeneous nucleation includes emulsion polymerization (EP), surfactant-free
19
emulsion polymerization (SEP), and microgel formation from a dilute polymer solution. In the first step of emulsion polymerization (EP), the monomer is present as a suspension mixed with a surfactant and a water-soluble free radical initiator, in the second step, the polymer is polymerized into a surfactant-stabilized microgel103. Emulsion polymerization is a robust method to obtain core-shell microgels. The
core particles are firstly prepared by conventional emulsion polymerization and then are used as seeds for the second-stage shell polymerization104. This method gives core-shell particles monodisperse, as all
oligomers formed in solution attached on pre-formed core particles, however, to avoid heteronucleation is important to control parameters such as the concentration of the core, initiator, surfactant and the shell monomer. In surfactant-free emulsion polymerization (SEP) starting from an unstable not colloidal precursor, particles aggregate to form new primary particles, then at the end of nucleation stage, all new precursor particles are captured by existing stable particles105. Moreover, microgels can be prepared by mixing two dilute water-soluble polymers that form complexes in water.
The second method is emulsification. In this case, an aqueous pregel solution (a monomer or a polymer) is suspended in an oil phase to give a water-in-oil emulsion. In the second gelation step, the emulsion droplets undergo a chemical reaction to gel each emulsion droplet106.
The last method involves dilute solutions of oppositely charged polyelectrolytes to form colloidal dispersed, polyelectrolyte complexes107.
However, these conventional techniques have some limitations due to the biomolecules incompatibility towards organic solvent or polymerization conditions. In addition, the low monodispersity and the need of codes for multiplex application have led to the development of new techniques to synthetize hydrogels.
Recently, microfluidics methods are arising in order to achieve major control on size and shape of microgels, to use milder chemistry and reduce time and cost of the synthesis. Among these, droplet generation based methods and flow lithography are the most used. The first method is competent for producing spherical or sphere-like particles, while the second is an ideal alternative for designing non-spherical particles, such as rods and flakes, which are more desirable in some particular applications.
Microfluidic assisted methods rely on the formation of a stable emulsion between two immiscible fluids as an oil phase (continuous phase) and a water phase (disperse phase). The synthesis occurs in a miniaturized device made of glass o polydimethylsiloxane (PDMS). The Disperse phase is usually composed by a water solution of monomer, biomolecules and cross-linker, while, for the continuous oil phase is used mineral oil, silicone oil, corn oil, hexadecane and fluorinated oil108. Additionally, a surfactant is added to prevent that droplets rapidly coalesce inside the devices109. The crosslinking of
20
polymeric monomers is achieved into the device (on-chip) or in separated vials (off-chip) and is induced by UV/Vis light110, via thiol-Michael addition click reaction111, or changing the temperature and ionic crosslinking112. As an example, PEG hydrogel microparticles have been widely synthetized by
cross-linking of acrylate and methacrylate monomers in microfluidic113. The polymerization is carried out
shining UV/Vis light on the solution in presence of specific photoinitiator based on hydroxyalkylphenone species (i.e., Darocur, Irgacure). The homolytic scission of C–C bonds generates a benzoyl free radical that allows the cross-links formation in the gel. Varying the parameters as the concentration of the photoinitiators, the intensity of light and the exposure time is possible to tune the mechanical rigidity and the pores of hydrogels.
Droplet generation is described as continuous on-chip production of water-in-oil emulsions based on the breakoff of droplets in two-phases at T-junction or in flow-focusing geometries. The formation of the droplet depends by several variabilities such as flow rates, viscosity of the fluid, dimensions of the geometry, capillary number (Ca) and the surface tension114. To obtain a stable emulsion and thus monodisperse droplets the optimal synthesis condition must be optimized. Moreover, in addition to the abovementioned other device geometries have been developed as micro-nozzle cross-flow system and co-axial capillaries115. Microfluidic droplet generation permits large production of monodisperse microparticles (105 per hours) spectrally or graphically encoded.
Doyle’s group have introduced the Flow-lithography116 in 2006. In this technique particles are synthetized in a PDMS microfluidic device, with high throughput (18,000 particles per second). The shape and size of the particles are controlled using a transparency mask, which shades the UV light beam used to photo-cure the co-flowing laminar streams in microfluidic channels. As results, they are able to obtain a high number codes combining graphical and spectral encoding, as well as differential chemistries are possible such as Janus particles117.
Further improvements have been made developing the stop-flow lithography118, where the pumping system is actuated so that the flow is stopped for few milliseconds allowing the polymerization through a mask. In such a way Doyle’s group have obtained particles with graphical and spectral encoding as well as with multiple capture probes positioned in different regions.
Another great advantage of using hydrogel microparticle relies on the flexibility of manipulation. Assays based on hydrogel can be carried out in microtubes (50-500 L), microplates for higher throughput (50-500 L) or in microfluidic devices (<10 L). Microparticles are washed and separated from the sample by centrifugation or, if magnetic microbeads are added during the polymerization, applying a magnetic field. The code reading and/or target quantification are usually measured by optical detection methods.