Working Paper 2020/65
The social return on
investment (SROI) of four
microfinance projects
■
R. Grazioli
■
G. Pizzo
■
L. Poletti
■
G. Tagliavini
■
F. Timpano
Riccardo Grazioli is PhD Candidate of Sociology at Università Cattolica del Sacro Cuore, Italy.
Contact: [email protected]
Tel.: +39 328 549 1424
Giampietro Pizzo is President of Microfinanza S.r.l., Italy.
Contact: [email protected]
Tel.: +39 349 448 1353
Lucia Poletti is Associate Professor of Financial Intermediation at Università di Parma, Italy.
Contact:[email protected]
Tel.: +39 0521 032 014
Giulio Tagliavini is Full Professor of Financial Intermediation at Università di Parma, Italy.
Contact: [email protected]
Tel.: +39 0521 032 437
Francesco Timpano is Full Professor of Economic Policy at Università Cattolica del Sacro Cuore, Italy.
Contact: [email protected]
Tel.: +39 0523 599 313 + 39 348 385 6435
Editor:
Helmut Kraemer-Eis,
Head of EIF’s Research & Market Analysis, Chief Economist Contact:
European Investment Fund
37B, avenue J.F. Kennedy, L-2968 Luxembourg Tel.: +352 248581 394 http://www.eif.org/news_centre/research/index.htm Luxembourg, August 2020 Scan above to obtain a PDF version of this working paper
ii Disclaimer:
This Working Paper should not be referred to as representing the views of the European Investment Fund (EIF) or of the European Investment Bank Group (EIB Group). Any views expressed herein, including interpretation(s) of regulations, reflect the current views of the author(s), which do not necessarily correspond to the views of EIF or of the EIB Group. Views expressed herein may differ from views set out in other documents, including similar research papers, published by EIF or by the EIB Group. Contents of this Working Paper, including views expressed, are current at the date of publication set out above, and may change without notice. No representation or warranty, express or implied, is or will be made and no liability or responsibility is or will be accepted by EIF or by the EIB Group in respect of the accuracy or completeness of the information contained herein and any such liability is expressly disclaimed. Nothing in this Working Paper constitutes investment, legal, or tax advice, nor shall be relied upon as such advice. Specific professional advice should always be sought separately before taking any action based on this Working Paper. Reproduction, publication and reprint are subject to prior written authorisation.
Preface
The EIF supports Europe’s SMEs - including microenterprises - by improving their access to finance through a wide range of selected financial intermediaries. To this end, the EIF primarily designs, promotes and implements equity and debt financial instruments which specifically target SMEs. In this role, the EIF fosters EU objectives in support of entrepreneurship, growth, innovation, research and development, and employment.
Against this background, to assess the effects of the support - the Impact Assessment - is an important topic for EIF, and a focus area of EIF’s Research & Market Analysis. Many analyses in the field of SME guarantees and Venture Capital have already been published.1
Regarding microfinance in Europe, EIF has been involved since 2000, providing funding (equity and loans), guarantees and technical assistance to a broad range of financial intermediaries, from small non-bank financial institutions to well established microfinance banks to make microfinance a fully-fledged segment of the European financial sector. The EIF has become an important pillar of this segment, by managing specific initiatives mandated by the European Commission, the EIB, and other third parties, as well as by setting up operations using own resources.
The Working Paper, presented here, results from a research project on “Measuring Microfinance Impact in the EU. Policy recommendations for Financial and Social Inclusion” (MeMI), initiated by EIF. The aim of this project is to contribute to the debate whether microfinance is able to deliver the expected impact in terms of financial and social inclusion. This part of the project is funded by the EIB Institute under the EIB-University Sponsorship Programme (EIBURS).
EIBURS is an integral part of the Knowledge Programme (one of the three flagship programmes of the Institute); this programme aims to provide support, mainly through grants or sponsorship, to hig her education and research activities. EIBURS supports university research centres working on research topics and themes of major interest to the EIB Group. EIB bursaries, of up to EUR 100,000 per year for a period of three years, are awarded through a competitive process to university departments or research centres associated with universities in the EU, Accession or Acceding Countries.
This particular Working Paper “The social return on investment (SROI) of four microfinance projects” - which is expected to be followed by other papers resulting from the project - has been conducted by researchers from Università Cattolica del Sacro Cuore, Università di Parma and Microfinanza S.r.l.. It introduces and applies - in the form of case studies - a specific methodology, SROI, to measure the impact of microfinance on financial and social inclusion. As such it provides useful guidance and ideas for microfinance practitioners who want to analyse non-financial returns.
Helmut Kraemer-Eis,
Head of Research & Market Analysis, EIF
Per-Erik Eriksson,
Head of Inclusive Finance, EIF Salome Gvetadze
Research Officer at Research & Market Analysis, EIF
iv
Abstract
The paper develops an SROI (Social Return on Investment) analysis of four microfinance institutions (MFIs) located in Spain, Italy and Bosnia-Herzegovina. This work is part of the MeMI Project (“Measuring Microfinance Impact in the EU. Policy recommendations for Financial and Social Inclusion”) funded by the EIBURS. It is an attempt to translate microcredit outcome indicators into a social return, quantified in monetary terms. After preliminary focus group analyses and staff interviews, data on outcomes of selected microcredit lines have been collected through a questionnaire administered to the borrowers. By comparing the monetary value of these outcomes (translated into an estimated impact) with the amount of related investment, we find that SROI is greater than 2 for all the credit lines analysed, meaning that every euro invested in microcredit generates at least 2 euros of social return. We also find SROI ranging between 2.33 and 6.97, mirroring the differences between MFIs in terms of target, operating model and country-level financial environment. Although the analysis is conducted on a limited number of cases and SROI calculation can be sharpened, it shows how different factors and outcomes drive the social return generated by microcredit.
Table of contents
1
Introduction ...1
2
What is Social Return on Investment (SROI)? ...2
3
Case studies: questionnaires at a glance...6
4
SROI in the MeMI project ...8
4.1 The Impact Map in the MeMI project ...8
4.2 Level-1 SROI, or “Acid Test SROI” ... 10
4.3 Level-2 SROI ... 11
4.4 Level-3 SROI ... 13
4.5 From outcomes to impact ... 16
5
SROI results ... 18
6
Limitations of the study and future improvements ... 21
7
Annex: Outcome Indicator Description ... 22
References ... 27
About … ... 28
… the European Investment Fund ... 28
… EIF’s Research & Market Analysis ... 28
… this Working Paper series ... 28
1
1 Introduction
The purpose of this paper is to investigate the results achievable through microcredit when microfinance institutions (MFIs) adopt different operating models in response to their environment. The analysis is conducted on four case studies (MFIs) located in three countries and is based on the Social Return on Investment (SROI). The paper is part of the MeMI Project (“Measuring Microfinance Impact in the EU. Policy recommendations for Financial and Social Inclusion”) funded by the EIBURS2, aiming to measure the impact of microfinance on financial and social inclusion through an SROI evaluation of a qualified group of European microfinance initiatives. The research group based the fieldwork on a series of preliminary meetings and focus groups with MFI borrowers and staff, to define the Impact Map and discuss the research hypotheses. The results of this preliminary phase have been used to prepare a questionnaire through which data on changes encountered by borrowers have been collected3.
The core part of the research lies in the direct experience of individuals who have used microcredit in three European countries: Herzegovina, Italy and Spain. The institution located in Bosnia-Herzegovina offers a wide range of financial products to customers, in competition with mainstream banks on some segments of clientele. It is a large financially self-sustainable institution with more than 21.000 clients. Conversely, in Italy and Spain we analyse three small projects. The microcredit scheme in Italy and Spain is very similar, based on the collaboration between a bank and a non-profit entity relying on donations and on the social (and financial) commitment of the founding bodies. In Italy, the projects are carried out with the support of a public guarantee scheme for business loans.
Starting from several outcome indicators with their own relevance, we summarise the results in a single ratio, SROI (social return / investment), indicating how many euros of impact are generated by every euro invested in microcredit. Our analysis focuses on business loans provided (or facilitated) by two different kinds of institutions: a large Microfinance Institution (MFI) and three non-profit organisations. At present, the results have been only partially discussed with the institutions involved. The information we collected from borrowers through a questionnaire is used to estimate microcredit outcomes and impact, to which we attribute a monetary value. What we do is indicate a monetary value in the SROI numerator for the financial and social inclusion aspects investigated, providing a comparison with the inputs necessary to generate such impact (the SROI denominator).
Sections 2 and 3 introduce SROI and synthesise some aspects arising from the questionnaires, enabling a comparison of the activities of the different institutions analysed. Sections 4 and 5 illustrate how SROI has been implemented in the MeMI Project, showing the indicators used and the SROI results. Finally, section 6 points out the main limitations of this study and possible future improvements.
2 For more information see: https://institute.eib.org/whatwedo/knowledge/funding-research/eiburs/.
3 We thank all the MFI borrowers and staff who collaborated in this three-year research. With reference to Spain, we thank
Maricruz Lacalle Calderón and Yolanda Durán of the Universidad Autónoma de Madrid for the fieldwork, and Fundación del Instituto de Crédito Oficial for the financial support in implementing the research.
2 What is Social Return on Investment (SROI)?
Everyday actions and activities add to or subtract value from our wealth, and the main measurement tool is monetary values. Social Return on Investment (SROI) is an accounting framework for measuring a wide-ranging concept of value. We are more and more interested in evaluating inequality, environmental degradation or upgrading, improvements in personal wellbeing. SROI measures changes in people or organizations. It gives details about how change is being created by measuring social, environmental, and economic outcomes. It uses monetary values to represent social, environmental, and economic changes. This procedure makes it possible to calculate a ratio of benefits to costs:
SROI = Social Return / Investment
The methodology is well described in the guide published by the SROI Network (The SROI Network, 2012), on which this section draws. SROI is about value, rather than money. Money is simply a standard unit, and as such, it is a useful and widely accepted way of conveying value, but it is not precisely a monetary quantification.
In a business plan, we can find much information about financial projections and the underlying forces that could drive financial results. Similarly, SROI is not the result of a simple calculation. It estimates the impact of specific activities. It considers the base decisions, the case studies, and qualitative, quantitative, and financial information, and evaluates the impact. (The SROI Network, 2012).
A SROI analysis can encompass the social value generated, or focus on just one specific aspect of the organization’s work. There are several ways to organise the implementation of a SROI. It can be carried out mainly as an in-house exercise, or an external researcher can do the evaluation; in either case, it can help show how investment can maximise impact. Using this technique, we can identify what should be measured once a specific project or activity is up and running.
SROI was developed from social accounting and cost-benefit analysis. It is founded on seven principles: 1) Involve stakeholders; 2) Understand what changes; 3) Value the things that matter; 4) Only include what is material; 5) Do not over-claim; 6) Be transparent; 7) Verify the result.
Like any research methodology, SROI requires judicious discernment throughout the analysis, and there is no substitute for the practitioner’s diagnosis. SROI has been used by a variety of organizations across the not-for-profit (or voluntary), public and private sectors.
Before starting the SROI analysis, it is necessary to clarify what the work is going to measure and how, and the reason for the measurement process. This stage includes three steps: 1) Establishing scope; 2) Identifying stakeholders; 3) Deciding how to involve stakeholders. SROI is always a compromise between what we can measure and what the analyser would like to be able to improve or communicate. In this step, the reason for the analysis and the resources have to be specified, and the priorities for measurement are defined.
Stakeholders are on the governance side of the organization and so their activity, whether positive or negative, is of the utmost importance for the results of the activity (The SROI Network, 2012).
3
Identifying stakeholders is necessary. We need to list all those who might affect or be affected by the activities within the scope of the organization, whether the change or the outcome is positive or negative, intentional, or unintentional. There is a natural predisposition to focus on the positive outcomes that were intended (or expected) by the stakeholders, and in particular if the focus is only on the organizational aims or objectives. However, intended and unintended outcomes and positive and negative outcomes are all relevant to SROI.
Involving stakeholders can help us understand more about the strengths and weaknesses of the activities and may provide useful information that can help the organization improve. Possible methods for involving stakeholders include asking directly, trying workshops, contacting their representatives, or having one-to-one interviews.
As a result, it is possible to understand how the activities analysed use inputs to deliver activities (measured as outputs), which result in outcomes for stakeholders.
Sometimes this relationship between inputs, outputs, and outcomes is called a ‘theory of change’ or a logic model – or the story of how an intervention makes a difference in the world. By involving stakeholders in constructing the Impact Map, it is certain that the relevant outcomes will be measured and valued.
Investment, in the SROI method, refers to the financial value of the inputs. We identify what stakeholders are contributing in order to make the activity possible. The value of the financial inputs is frequently easy to establish. We need to include the full cost of delivering the services. In some situations, other contributions are being made, including non-cash items, which need to be valued. When filling out an Impact Map, non-monetised inputs may be identified; these are inputs other than the financial investment, like volunteer time. Two main types of non-monetised inputs are generally relevant in SROI: volunteer time and goods and service input in kind. Valuing volunteer time can be more difficult. The hours donated by volunteers have a value equivalent to the average hourly rate for the type of work they are doing. Conventionally, SROI does not consider the financial value of time used by the program target receivers. Information from the organization’s management systems is necessary, such as records of how many hours or days the volunteers contributed.
Questions such as: “How would you describe how your life has changed?” or “What do you do differently now?”, can help identify outcomes if stakeholders are asked directly. In deciding on outcomes, other factors should be considered, such as the organization’s objectives, as well as the views of the stakeholders.
Indicators are useful to understand which changes took place. The next stage in developing the Impact Map is to establish one or more indicators for each of the outcomes on the map. Some indicators will need to clarify whether the outcome has occurred, and by how much. If the outcome is greater self-confidence, it may be relevant to ask people about some correlated aspects of their lives. In this way, we are more likely to obtain something measurable. Some people might say: “Before [the activity] I would never go out, but now I take the bus into town to meet my friends.” In this example, the self-confidence indicator could be whether people go out more or spend more time with other people. Sometimes more than one indicator must be used. Then it is useful to check that they are not only quantifiable but also that they can be measured with the resources available.
The initial SROI ratio is a straightforward sum. If we move a step forward, SROI is obtained by dividing the discounted value of future benefits by the total investment:
SROI ratio = Present value of benefits / Value of inputs
Presenting all the findings in a balanced way is essential. Presenting considered positive and negative findings is necessary. Distinguishing between benefits that are not happening and benefits that may be happening is necessary, too. Ratios are advantageous in communicating with stakeholders. However, where ratios have the most value is in how they change over time. The pattern can disclose comprehensively whether the activities are improving or not, and it also gives the organization information about how to change its services to maximise social value in the future. It is essential to secure a commitment to further SROI analyses.
SROI describes the way of creating change. We give change a monetary value and we compare the value with the costs of required inputs. According to Social Ventures Australia Consulting, SROI is essential to make organizations seeking to create social change more sophisticated in assessing performance against social impact. SROI has emerged internationally as a viable approach to measure the extent to which social impacts are being achieved. At an organizational level, the benefits garnered by organizations that conduct or commission an SROI analysis are considerable. Using SROI, organizations can highlight the social impact their activities are achieving. They gain more in-depth insight into the impact they are having on all their stakeholders. They learn what is and is not working, and use this as input for strategy, strengthening their management and monitoring systems. The method provides investors with a compelling story. Investors in non-profit organizations and social enterprises usually appreciate a brief, reliable, sophisticated and accessible account of the social value achieved with the funds invested. Reporting based upon SROI is an excellent way of building relationships with the organizations they support. It is essential to focus on data that inform future investment decisions.
In recent years, interest in measuring the social impact of projects has increased. Indeed, many managers want to know what results are being produced. Investors need some accurate information about how money is creating social value.
There are recognised limitations to SROI. This method is not a comprehensive and complete framework of evaluation. At this stage, it cannot easily be used to compare performance between organizations. Rather, SROI complements, and in some cases borrows from, existing tools and methods such as the Balanced Scorecard, the Australian Business Excellence Framework, the European Framework for Quality Management, Social Auditing/Social Accounting, Risk Management, and other accountability frameworks established by funding programs. Accordingly, organizations undertaking SROI should be cognizant of the specific contribution it makes. Each SROI analysis is revised by each organization. Therefore, the SROI ratio is specific to each organization, hence making a cross-organizational assessment challenging.
On the other hand, the use of the SROI ratio as a benchmark datum within an organization enables them to measure changes in performance over time. However, it is possible for some investors or analysts to misunderstand the numbers, even the SROI ratio level. The ratio represents the social value created for each euro invested that stakeholders might find in any one stage of the process. It
5
is not an actual financial return. Accordingly, we need to be careful how we communicate the SROI ratio.
Unlike SROI, the current measure of profit is a consolidated standard developed by professionals over several hundred years, and now we can rely on international accounting standards. Investors and managers have considerable experience and training in interpreting the results. Nonetheless, there remain significant problems in the interpretation of this single measure of profit and in incorporating measures of risk in evaluating returns on investment. SROI is dependent on subjective considerations so that attitudes to monetary values may differ between stakeholders and introducing a financial estimate of some outcomes can be problematic. Finally, as for the feasibility of carrying out a SROI analysis, estimating the amount of time needed to implement SROI can be difficult since it depends on the availability of the required data and the capabilities of those involved in the study. The logical intent of SROI is to promote a strong focus on social impacts. Achieving positive social impact is the ultimate focus of all socially-oriented activities. This goal is valid whether conducted by non-profit organizations, by social enterprises, by corporations, and so on. SROI focuses its sharp lens directly on social impact and relates it to the investment required to achieve those impacts. Despite the recognised limitations of this method, the SROI technique can be a valuable tool in promoting existing or potential projects by helping to attract new funding, and, at the same time, it can also help the entities funding existing projects to understand the full value of the benefits delivered.
3 Case studies: questionnaires at a glance
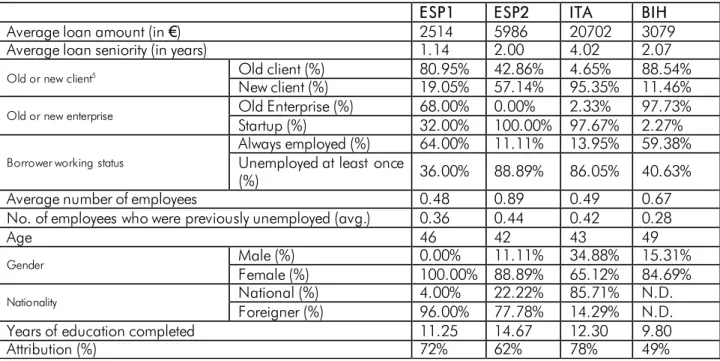
The MeMI project uses SROI to summarise the impacts of microcredit in a single indicator, calculated for each of the four MFIs analysed4. Interviews and focus groups with MFI borrowers and staff allowed us to understand the main outcomes generated by microcredit. In the second stage of the research, we sent a questionnaire to borrowers, to collect personal data and information on their businesses. In addition to the parameters used in SROI, the answers to the questionnaire describe the main features of the microfinance activities carried on by the MFIs and analysed in the MeMI project (Table 1). For privacy reasons, MFI names are replaced by their country: ESP1 and ESP2 are the two MFIs operating in Spain; ITA indicates the MFI operating in Italy; BIH replaces the name of the MFI based in Bosnia-Herzegovina.
Table 1: Respondents' characteristics
ESP1 ESP2 ITA BIH
Average loan amount (in €) 2514 5986 20702 3079
Average loan seniority (in years) 1.14 2.00 4.02 2.07
Old or new client5 Old client (%) 80.95% 42.86% 4.65% 88.54%
New client (%) 19.05% 57.14% 95.35% 11.46%
Old or new enterprise Old Enterprise (%) 68.00% 0.00% 2.33% 97.73%
Startup (%) 32.00% 100.00% 97.67% 2.27%
Borrower working status
Always employed (%) 64.00% 11.11% 13.95% 59.38% Unemployed at least once
(%) 36.00% 88.89% 86.05% 40.63%
Average number of employees 0.48 0.89 0.49 0.67
No. of employees who were previously unemployed (avg.) 0.36 0.44 0.42 0.28
Age 46 42 43 49
Gender Male (%) 0.00% 11.11% 34.88% 15.31%
Female (%) 100.00% 88.89% 65.12% 84.69%
Nationality National (%) 4.00% 22.22% 85.71% N.D.
Foreigner (%) 96.00% 77.78% 14.29% N.D.
Years of education completed 11.25 14.67 12.30 9.80
Attribution (%) 72% 62% 78% 49%
Source: Authors
To interpret the differences between the MFIs in the project we can rely on the focus group discussions we conducted in the first phase of the study.
First of all, MFIs differ in average loan size. Although for BIH the table shows the euro amount, to have an idea of the loan size, this corresponds roughly to half the average annual gross cost of an unskilled employee (same as ESP2), in contrast to ITA where the average loan corresponds to the full annual cost of an employee. In Italy and Spain (comparable countries) the average loan amount is very different: the enterprises funded in Spain require fewer resources. To understand the reasons behind these differences, we can look at the borrowers by nationality and at whether the loan is funding a new or an old enterprise.
In our Spanish case studies, immigrants are the majority of borrowers. In particular, ESP1 grants loans in suburbs with a high level of social malaise, targeting neighbourhoods with a predominantly
4 For an overview of the different methodologies used to assess impact in microfinance, see Gloukoviezoff (2016). 5 “New” clients are at the first loan cycle, while “old” clients have already received previous loans from the MFI.
7
immigrated population living in socially deprived areas. Conversely, in Italy respondents are mainly nationals, not necessarily living in deprived areas. From the focus groups, we know that in ESP1 immigrant borrowers run mainly small businesses, and this can explain the relatively small loan amount. ESP2 borrowers are also found to run very small businesses and usually rely on savings or other external sources to fund their activities. In fact, we know from the survey that in Spain on average 57% of the resources necessary to run a business come from the MFI, while in ITA the percentage rises to 72%. Moreover, in ITA all businesses are legally registered and might require higher initial investments for renovations and to meet safety and health regulations. Finally, for BIH the resources coming from the MFI account for 33% of the overall resources necessary to run a business. The figure is consistent with the idea that funding pre-existing enterprises rather than start-ups (ITA or ESP2) requires fewer resources. Moreover, in BIH there is strong market competition and we cannot rule out access to other microfinance institutions, although this is not declared in the answers.
A second aspect deserving attention is whether borrowers are on their first loan cycle with the MFI. ESP1 and BIH serve mainly previous borrowers, while ITA lends mainly to borrowers on their first loan cycle. This may explain why Italian borrowers give more credit to the MFI for the changes that happened in their lives (higher attribution, as illustrated in the following sections).
Borrowers who have been unemployed at least once in the recent period are the main recipients of ITA and ESP2. As for gender, ESP1, ESP2, and BIH are very focussed on women.
The overall number of questionnaires analysed is 177 for the four MFIs: 100 for BIH, out of 4,800 borrowers on the credit line analysed; 25 for ESP1, representing 17% of the portfolio in the year of analysis; 9 questionnaires for ESP2, out of 14 loans made through the project-line analysed; 43 questionnaires for ITA, with the survey presented to all active borrowers at the date of collection.
4
SROI in the MeMI project
4.1 The Impact Map in the MeMI project
The Impact Map describes what the microcredit project wants to change for stakeholders who are involved in the activity. The Impact Map is our interpretation of what it is necessary to deal with in the research, with a specific focus on clients and on the community at large.
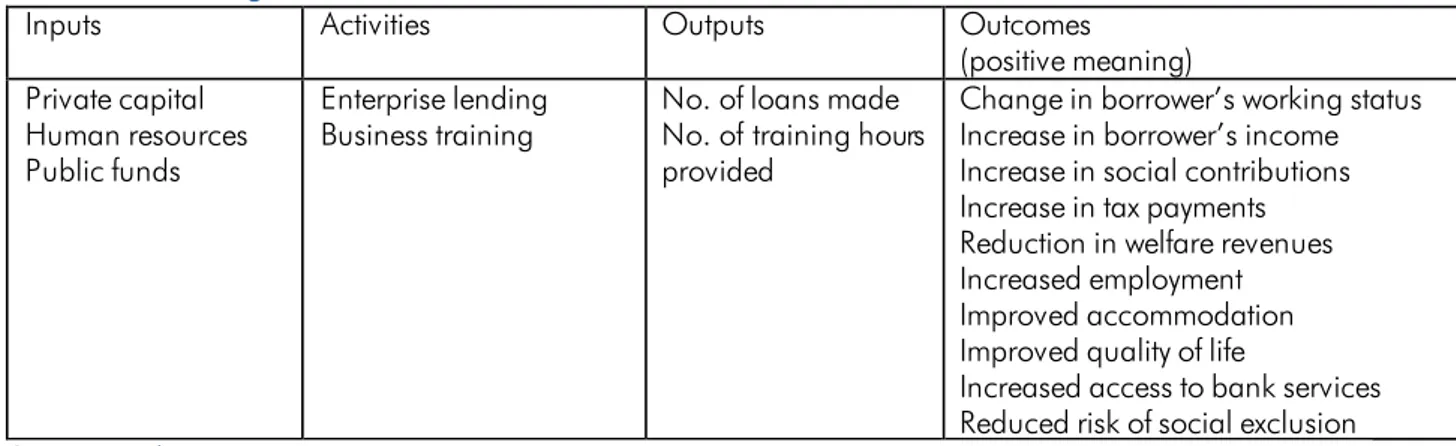
Table 2 describes inputs, activities, outputs, and outcomes of microfinance projects and credit lines, in a logical flow. It is the result of focus groups we conducted on samples of active borrowers. Older clients and clients in default were excluded from the focus groups because they could not be contacted. Nevertheless, in Italy we were able to collect some information on borrowers in default through individual interviews with MFI staff.
Table 2: SROI logical flow
Inputs Activities Outputs Outcomes
(positive meaning) Private capital
Human resources Public funds
Enterprise lending
Business training No. of loans made No. of training hours provided
Change in borrower’s working status Increase in borrower’s income Increase in social contributions Increase in tax payments Reduction in welfare revenues Increased employment Improved accommodation Improved quality of life
Increased access to bank services Reduced risk of social exclusion
Source: Authors
The SROI calculation involves in particular:
Collecting information on the changes experienced by borrowers (the “Outcomes”), that can be positive or negative. For data collection we used the survey;
Assigning a monetary value to these changes, in order to assess the impact from a monetary point of view (“Social Return”, or “Value of Benefits”, in the numerator of the ratio). In this step we used conservative estimates;
Comparing the Social Return with the monetary inputs used for the activity (“Investment” in the denominator of the ratio), after adjusting for attribution, drop-off, deadweight and displacement.
Figure 1 – SROI calculation
9
After a general analysis of the problem and the focus group phase, the questionnaire collected information on the relevant outcomes raised during the focus groups. The answers to the survey provided the base to calculate specific indicators corresponding to the different outcomes of the model. These indicators are used to estimate SROI for the activities delivered by the MFIs in one year. Since we needed to collect information on different aspects of financial and social changes, we had to limit the number of questions for each aspect analysed.
The final SROI results for the four MFIs involved in the project are shown in Table 3. For example, in ESP1, every euro invested in the credit line analysed generates 6.97 euros of benefits. As we can see, the social return on investment is greater than 6 also for ESP2. ITA and BIH display smaller SROI values, but always above 1. A SROI below 1 would mean that every euro invested generates less than one euro of social return. The calculation method is explained below and sketched in Figure 1.
Table 3 - SROI results
ESP1 ESP2 ITA BIH
SROI 6.97 6.63 2.33 3.50
Source: Authors
The overall SROI value stems from a progressive analysis organised in three levels. To understand the logic behind the three-level calculation, Table 4 provides an overview of the outcomes divided into “smart” and “non-smart”.
Table 4: Smart and non-smart outcomes
Outcomes Smart Non-Smart
Change in borrower’s working status Increased borrower’s income Increase in social contributions Increase in tax payments Reduction in welfare revenues Increased employment Improved accommodation Improved quality of life
Increased access to bank services Reduced risk of social exclusion
Source: Authors
“Smart” outcomes describe the changes which are easier to quantify, opposed to “non-smart” outcomes. “Smart” means Specific, Measurable, Achievable, Relevant, and Time-bound. This distinction is operational, hence useful in the social analysis of a complex situation.
Each item can be analysed from a different point of view and considering different aspects of financial inclusion and social exclusion6. Since only a partial analysis is usually feasible because of operative obstacles or time constraints, we decided to identify an “Acid Test SROI” or “Smart SROI”. This first-level SROI is based on variables which measure directly the monetary return on the inputs used by
6 The different dimensions of financial inclusion and social exclusion have been studied during the MeMI Project. Although
they are not reported in this paper, they are summarised (with the literature review) in Federico D., Milioli M.A., Notte A., and Poletti L. (2020).
microcredit activity. Since all the outcomes included in the Acid Test SROI are monetary, the indicator is quite easy to calculate and reliable, although it cannot evaluate the real and complete impact.
Table 5 summarises the different SROI levels analysed, each progressively including different types of changes.
Table 5: Three-level outcome framework
Monetary changes Δ Annual profit
Level-1 SROI (Acid Test SROI) (Smart SROI) Δ Annual social contribution paid
Δ Annual tax paid
Δ Social benefits received (public welfare) Economic changes to be given a monetary value No. of jobs created
Level-2 SROI Accommodation size
Non-economic changes to be given a monetary value Δ Borrower’s working status (unemployed employed)
Level-3 SROI (SROI) Δ Access to a bank account (financial inclusion)
Δ Access to credit (financial inclusion) Δ Risk of social exclusion
Δ Life satisfaction Source: Authors
The following sections explain how SROI is calculated at each level.
4.2 Level-1 SROI, or “Acid Test SROI”
The numerator includes outcomes corresponding to monetary changes: - Changes in the borrower’s income
- Changes in social contributions paid - Changes in tax payments
- Changes in the social benefits received as welfare revenues
Through the questionnaire we asked borrowers to declare their income, social contribution payments, tax payments, and welfare revenues, after and before receiving the MFI loan. The difference between the annual value after and before the loan is the change we use for the SROI. Changes in borrowers’ income constitute outcomes directly referable to borrowers. Conversely, social contributions, tax payments, and social benefits constitute outcomes for the community at large. When a borrower pays taxes and social contributions, or receives smaller social benefits, more resources are available to the government, hence to the community.
All of these changes are directly stated in monetary terms. Therefore, since no estimate is required, they represent the most conservative value in the SROI calculation. This is the reason why we refer to Level-1 SROI as “Acid Test SROI.”
As for the borrower’s income, we split borrowers into two groups: those whose income increased after the loan and those whose income decreased. In this way, we can calculate the average annual
11
income increase separately form the average annual income decrease, in addition to a more generic average change.
Table 6 summarises the indicators resulting from the questionnaires and used for Level-1 SROI calculations.
Table 6: Monetary outcomes
MFI indicators for
Level 1 SROI ESP1 ESP2 ITA BIH
% of borrowers experiencing an increase in income 44.00% 22.22% 48.84% 29.00%
% of borrowers experiencing a decrease in income 4.00% 11.11% 9.30% 6.00%
Average annual income increase € 6,512.73 € 6,600.00 € 12,371.43 € 1,263.82
Average annual income decrease - € 6,000.00 - € 5,892.50 - € 7,747.50 - € 1,242.43
Average change in the annual income € 3,646.67 -€ 750.00 € 8,171.79 € 456.19
Average change in the social contributions paid per year € 643.76 € 1,227.00 € 2,790.00 € 10.71
Average change in annual tax payments € 200.33 € 1,358.86 € 2,166.67 € 8.48
Average change in social benefits received per year - € 3,452.24 - € 4,034.67 - € 549.77 € 166.53 Source: Authors
The differences in the indicators can be interpreted considering the operational characteristics of each MFI. The relatively high income change experienced by ITA’s borrowers, along with the percentage of ITA’s borrowers with increasing income, can be explained by the higher number of borrowers who were previously unemployed (see “Level-3 SROI”). Nevertheless, borrowers of ESP1 and ESP2 are those who experience the highest reduction in social benefits received. The situation is completely different for BIH, where only a few borrowers are at their first loan cycle. Indeed, for BIH the changes are relatively small, even taking into account the differences between countries (the GDP per capita in Italy is about three times that of Bosnia-Herzegovina). The result is consistent with the idea that microloans help “old” borrowers to maintain the status quo and prevent their situation from deteriorating, as emerged during the focus groups.
To calculate the SROI numerator, the average changes detected in the observed groups have been multiplied by the number of borrowers at MFI level: the average income increase times the number of borrowers experiencing an increase in their income (estimated at MFI level); the average income decrease times the number of borrowers experiencing a decrease in their income (estimated in percentage at MFI level); all the borrowers times the other average changes (social contributions, tax payments, social benefits)7.
As for signs, all positive changes correspond to higher benefits at borrower or community level, hence they are added to the outcomes, except for the rise in social benefits received. Since receiving more social benefits after the loan than before involves a greater burden for the government, this increase is considered a negative outcome and subtracted.
4.3 Level-2 SROI
Level-2 SROI, in addition to the monetary outcomes mentioned above, includes economic outcomes that are not directly stated in monetary terms. They are the number of employees working in the
7Since all the MFIs analysed run a wide range of activities, we decided to focus our analysis on a specific project or a
borrowers’ enterprises and the improvements in the borrowers’ accommodation, the latter being the home size, measured as number of additional rooms (if any) available after the loan. These outcomes do have an indirect economic value, but have to be calculated on the basis of estimates and proxies. The Level-2 SROI indicators are reported in Table 7.
Table 7: Economic outcomes
MFI indicators for
Level-2 SROI ESP1 ESP2 ITA BIH
Number of rooms in the house (average change) 0.56 0.22 -0.23 0.13
Average no. of employees, legal and informal 0.48 0.89 0.49 0.67
Source: Authors
Data show that the house size in terms of additional rooms is not a particularly relevant outcome. Only a few borrowers (14% according to the survey) declare some changes in their home size. This happens in particular for ESP1’s borrowers, who are immigrants living in very unsafe conditions and they are probably gaining the greatest advantage from the microloans they receive. In Italy we notice that house size diminishes on average, but this is consistent with what we know from the focus groups, namely that young borrowers use their loans to become independent and leave their original household (probably occupying a larger house).
The average number of employees shows that in different countries businesses have very similar sizes. But the average number is the result of different situations. In ESP2, the number of employees ranges between 0 and 2, whereas in BIH the number of employees ranges between 0 and 7, probably because most firms are well-established and have received several successive loans over time. To find the overall value of these non-monetary economic outcomes, we multiply the average indicator value by the number of borrowers, and by a proxy (a monetary estimate), (see Table 8). As for proxies, an employment unit is worth the annual average gross cost of an unskilled employee, as provided by the MFI (if available), or retrieved from national labour statistics, in the absence of estimates provided by the MFI itself. The larger (or smaller) accommodation size is given a value corresponding to the price per square meter8, considering an average room size of 6 square meters.
Table 8: Non-monetary economic outcome calculation
Overall value of non-monetary economic outcomes =
Increased employment + Improved accommodation =
Average no. of new jobs created x Total no. of borrowers x Proxy (Average gross cost of an unskilled employee) +
Average no. of additional rooms in the house x Total no. of borrowers x Proxy (Cost per m2)
Source: Authors
13
4.4 Level-3 SROI
The last level of SROI includes non-economic outcomes. It requires an estimate of the monetary value of the changes in:
- Access to bank services (financial inclusion) - Risk of social exclusion
- Quality of life and life satisfaction
This part of the SROI calculation is the most challenging. What is relevant to our purposes is if borrowers gain access to financial services, reduce their risk of social exclusion, and perceive their life improving over time. These are multifaceted outcomes involving the analysis of different dimensions, whose review is provided in Federico et al. (2020). Since we needed to limit the number of questions, for each outcome category we decided to focus on few specific aspects, as explained below. For the proxies, we use the estimates available in the Social Value Bank database. Since it is based on estimates related to the UK, we adjust the proxy value by the GDP per capita in the different countries.
Financial inclusion
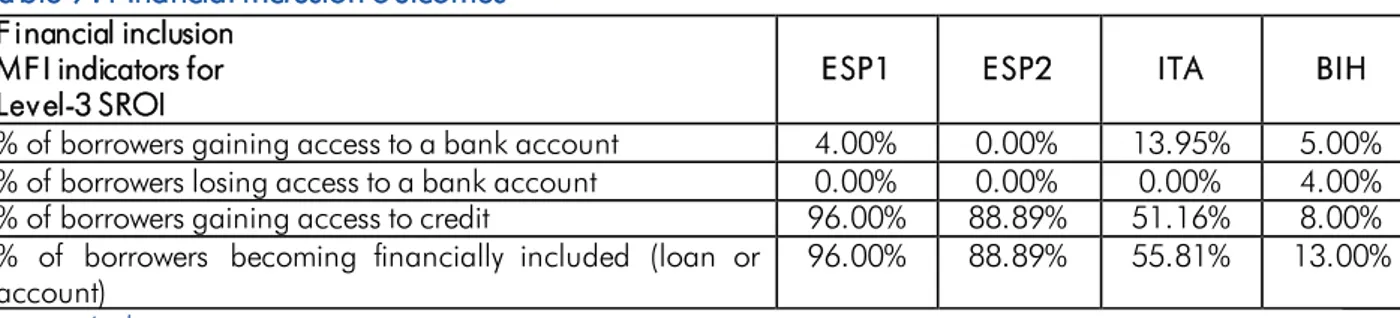
We measure financial inclusion as access to bank services, in particular to bank accounts and credit. For credit, we asked borrowers if they had ever accessed credit before receiving the MFI loan. If the MFI loan is their first access to credit, we consider it as financial inclusion. Similarly, we asked borrowers if they held an account before and after the MFI loan. If they did not before, but do after, we consider this as a financial inclusion outcome as well. Unfortunately, due to the need to shorten the questionnaire, we decided to limit the investigation to financial access, dropping the questions about usage and suitability of financial products. Table 9 summarises the financial inclusion outcomes.
Table 9: Financial inclusion outcomes
Financial inclusion MFI indicators for
Level-3 SROI ESP1 ESP2 ITA BIH
% of borrowers gaining access to a bank account 4.00% 0.00% 13.95% 5.00%
% of borrowers losing access to a bank account 0.00% 0.00% 0.00% 4.00%
% of borrowers gaining access to credit 96.00% 88.89% 51.16% 8.00%
% of borrowers becoming financially included (loan or
account) 96.00% 88.89% 55.81% 13.00%
Source: Authors
The table shows that the effect of financial inclusion is mainly in terms of credit access. BIH and ITA borrowers are more likely to have already received another loan before accessing the MFI, whereas ESP1 and ESP2 borrowers access their first loan through the institution. Considering the target of each MFI, we notice that the financial inclusion effect is greater for MFIs serving immigrants. For each MFI, to find the overall value of having access to the financial system, we multiply the estimated number of borrowers gaining access to the financial system by the proxy, taken from the Social Value Bank Database.
Social inclusion
Social inclusion is a multidimensional phenomenon that involves social, psychological, political, and economic aspects of an individual’s life (Atkinson et al., 2002; Bossert et al., 2007; Chakravarty and D’Ambrosio, 2006). The literature is diverse and extensive, and there are numerous definitions of social exclusion and social inclusion (Federico. et. al., 2020). For SROI purposes, considering the need to limit the number of questions, for the impact on borrowers’ risk of social exclusion we focus on three main dimensions, related to working status and material deprivation:
- Becoming employed;
- Being able to meet rent and food expenses; - Being able to afford small expenses.
We consider if the borrowers’ working status shifts from unemployed to self-employed after the loan. Since exclusion from the labour market is one of the main social exclusion risk factors, an important outcome of a microfinance loan is helping the borrower to become employed. We consider the change in working status as an autonomous outcome, supplementary to the possible change in income level.
Material deprivation is another aspect related to the risk of social exclusion. We collect information on the borrowers’ ability to meet rent and food expenses, and to afford small expenses related to different activities (replacing clothes, having meals out, leisure activities, autonomy for personal expenses and access to the internet).
Table 10 reports the indicators for each MFI analysed.
Table 10: Social inclusion outcomes
Social inclusion MFI indicators for
Level-3 SROI ESP1 ESP2 ITA BIH
% of borrowers previously unemployed 20.00% 55.56% 81.40% 2.00%
% of borrowers improving their ability to meet food and
accommodation expenses 40.00% 22.22% 44.19% -
% of borrowers worsening their ability to meet food and
accommodation expenses 8.00% 0.00% 4.65% -
% of borrowers who can afford more small expenses 20.00% 66.67% 55.81% 6.00% % of borrowers who can afford fewer small expenses 28.00% 11.11% 13.95% 0.00%
Source: Authors
The unemployed are targeted mainly by ITA and ESP2. Indeed, we know from the focus groups that ESP1 immigrants were employed in small informal jobs before receiving the microloan, while BIH clients’ businesses are well-established. As a consequence, the positive results in terms of greater ability (than before the current loan) to meet expenses are recorded in Italy and Spain, but not in Bosnia-Herzegovina9. We can infer that after a certain number of loan cycles, the borrower’s economic situation stabilises and subsequent loans cannot lead to additional improvements, although they are necessary to maintain the status quo. Data show also that there is a percentage
9 The information available for BIH refers only to the affordability of small expenses, while data on the ability to meet food
15
of borrowers who can afford fewer small expenses than before the loan, mainly because of the loan burden, according to the focus groups.
The value given to social inclusion outcomes is calculated as follows: for borrowers experiencing worsening conditions, a negative value is allocated. As usual, the number of total borrowers refers to borrowers involved in the project or credit line analysed. The proxies are retrieved from the Social Value Bank: for working status change the proxy is the value given to self-employment; for the other outcomes we consider proxies consistent with housing, hobbies, youth clubs, and internet access.
Table 11: Monetary value of social inclusion outcomes
Value given to social inclusion outcomes
Becoming employed No. total borrowers x % of borrowers previously unemployed x Proxy +
Being able to meet rent and
food expenses No. total borrowers x % of borrowers improving their ability to meet food and accommodation expenses x Proxy -
No. total borrowers x % of borrowers worsening their ability to meet food and accommodation expenses x Proxy
+
Affording small expenses No. total borrowers x % of borrowers who can afford more small expenses x Proxy
-
No. total borrowers x % of borrowers who can afford less small expenses x Proxy
Source: Authors
Life satisfaction
In addition to social exclusion, we consider life satisfaction as an autonomous outcome. It is measured by five items and summarised in a single indicator.
Table 12 - Life satisfaction outcomes
Life satisfaction MFI indicators for
Level 3 SROI ESP1 ESP2 ITA BIH
% of borrowers experiencing greater life satisfaction 64.00% 11.11% 39.53% 45.00% % of borrowers experiencing less life satisfaction 4.00% 0.00% 30.23% 7.00% Average score for changes in life satisfaction (the range
is between -6 and +6). 0.61 0.03 0.91 0.31
Source: Authors
As data show, the percentage of borrowers experiencing greater life satisfaction varies between institutions, with the highest results in ESP1 (64%) and BIH (45%). Nevertheless, the average score given to the changes is very low (always below 1), provided that the maximum possible value of the change is 6. Finally, data highlight that 30.2% of ITA’s borrowers feel less satisfied than before the loan. Although these changes may depend on factors different from MFI activities, the extent to which they are considered dependent on microloans is the object of a specific question flowing into the attribution value.
Just as for social exclusion, to calculate the monetary value of the relative outcomes, we use appropriate Social Value Bank proxies.
Table 13: Monetary value of life satisfaction outcomes
Overall value given to changes in life satisfaction =
Overall value of greater life satisfaction – Overall value of less life satisfaction =
No. total borrowers x % of borrowers experiencing greater life satisfaction in the sample x Proxy -
No. total borrowers x % of borrowers experiencing less life satisfaction in the sample x Proxy
Source: Authors
4.5 From outcomes to impact
The estimates shown above refer to the changes that happened to borrowers. To move from changes to impact, adjustments are necessary to assess what part of these changes is due to microfinance activities. All the outcomes are then adjusted for the following items.
1) Average attribution. Attribution is how much credit (in %) the MFI can take for the changes experienced by borrowers. In the absence of a control group, the information on the importance of the MFI activity was collected directly from borrowers. For each MFI, we calculate the attribution as the average of four different measures derived from the questionnaire answers:
I. Weight (in %) of the funds coming from the MFI on total funds used for the business activity; II. Role of the MFI in setting up/expanding the business, to understand how far the MFI is
necessary to the business;
III. Borrowers’ rating of the MFI impact on their personal lives;
IV. Borrowers’ rating of the MFI impact on the overall changes experienced (economic, personal, etc.).
The answers to each question have been rescaled in percentage terms and averaged. The first measure is objective. Conversely, the following three measures are more subjective and depend on the borrower’s judgement. Although each measure can be misleading if taken individually, the four dimensions together draw a picture of how much credit can reasonably be given to the MFI for the changes that borrowers experienced.
2) Drop-off. The outcomes generated by microfinance activity are expected to last for several years. Nevertheless, since the outcomes are improvements related mainly to business activity (e.g. more income or more employees) and to quality of life, we expect borrowers’ situations to stabilise over time. Moreover, we can suppose that borrowers, without credit, would have been forced to find alternative solutions to their needs. For these reasons, in a conservative perspective, we apply an annual drop-off of 30% on future outcomes, meaning that we suppose the outcome value to drop by 30% every year.
3) Deadweight. It is the percentage of change that would have happened even without MFI activity. For monetary changes (Level-1 SROI) we use the GDP growth rate. For job creation and changes in working status, we use the change in the national unemployment rate. The changes recorded in these areas are reduced by these percentages.
17
The last adjustment required by SROI methodology refers to displacement. It measures how much of the outcome displaces other outcomes. Since from the focus groups and the interviews no relevant displacement effect emerged, we do not apply it to the analysis.
Finally, since microcredit generates effects over a multi-year time horizon, we project the adjusted outcomes over three years, and then discount their values using a proper social discount rate of 5%10.
5 SROI results
Sections 4.1 to 4.5 show the methodology used to find the numerator of SROI ratio to be compared with the amount of the investment in the denominator.
Since we calculate SROI for projects or credit lines of the MFIs, in our analysis the investments include both the stock and flow of resources used in one year:
- The stock of resources available to the MFI (equity and external funding in the balance sheet); - Donations, if any (flow);
- Volunteer time (when applicable), translated into monetary value (flow).
In SROI, the investment is proportional to the weight the loans analysed have on the overall activities of the MFI. In principle, since we analyse business loans, if they are, for example, 30% of MFI activities overall, we attribute 30% of common resources to SROI. In practice, to apply this basic principle, common resources are allocated using a specific calculation for each MFI, taking into account the specific operational model. Conversely, if the resources (e.g. donations) are specific to the credit line analysed, we attribute the full amount (e.g. 100% of donations).
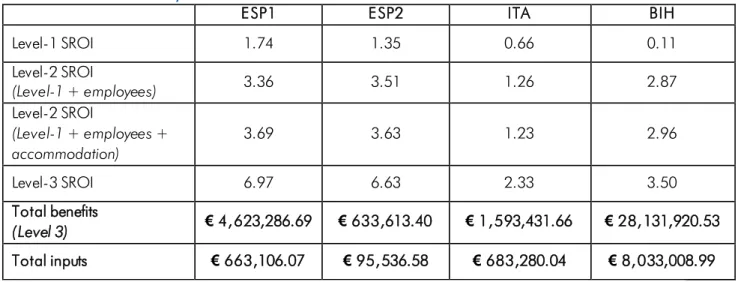
Finally, we divide the monetary value of outcomes (total benefits) calculated according to sections 4.2 to 4.5 by the inputs necessary to generate such results, as explained above. Table 14 shows the results, moving from Level-1 to Level-3 SROI, the most comprehensive value.
Table 14: SROI results by level
ESP1 ESP2 ITA BIH
Level-1 SROI 1.74 1.35 0.66 0.11 Level-2 SROI (Level-1 + employees) 3.36 3.51 1.26 2.87 Level-2 SROI (Level-1 + employees + accommodation) 3.69 3.63 1.23 2.96 Level-3 SROI 6.97 6.63 2.33 3.50 Total benefits (Level 3) € 4,623,286.69 € 633,613.40 € 1,593,431.66 € 28,131,920.53 Total inputs € 663,106.07 € 95,536.58 € 683,280.04 € 8,033,008.99 Source: Authors
The table shows that Level-3 SROI is above 1 for all the MFIs analysed. The final result is above 6 for ESP1 and ESP2 (6.97 and 6.63 respectively), and above 3 for ITA and BIH. For example, ESP1 SROI means that every euro invested in the credit line analysed generates 6.97 euros of impact. Nevertheless, if we limit the analysis to Level-1 SROI, we notice that the benefits generated by ITA and BIH are below 1 for each euro invested. It means that the results in income, social contributions, taxes, and social benefits do not fully counterbalance the investment made to generate the loans. By comparing Level-1, Level-2, and Level-3 SROI, we can understand which results drive impact. For example, employing workers boosts the ratio much more than the results in terms of accommodation.
19
If we analyse the results by MFI, for ESP1, SROI increases by more than three units (from 3.69 to 6.97) moving from Level-2 to Level-3 outcomes. It means that the changes in terms of financial inclusion, social inclusion, and life satisfaction are particularly relevant. This result is consistent with the information that we have from focus groups, namely that the MFI targets the most deprived suburbs where residents have no access to alternative welfare tools. This happens also for ESP2 (three additional units moving from Level-2 to Level-3 outcomes), although employees play a key role as well, adding more than two units to Level-1 SROI.
For ITA, social return exceeds investment value only after considering the new jobs created (employees), although the SROI increase is only of 0.6 units. Considering financial inclusion, social inclusion, and life improvements in the calculations (from Level 2 to Level 3) one unit is added to SROI. We can conclude that the greater contribution to SROI stands mainly in Level-3 outcomes. This is consistent with focus group discussions that highlighted some profitability problems in the enterprises financed, probably leading to less positive results also in Level-3 indicators compared to the other MFIs.
In BIH the changes in income, social contributions, taxes, and social benefits do not counterbalance the investment (Level-1 SROI is 0.11, below 1). But we must consider that these changes refer to well-established enterprises, whose situation is likely to be stable. This can explain the increase of 2.76 points (from Level-1 to Level-2 SROI) when considering employees. Compared to the other MFIs, this is the greatest increase at this level. In other words, microenterprises in Bosnia-Herzegovina generate a social return on investment mainly by employing people. Indeed, Level-3 outcomes related to financial inclusion, social inclusion, and life satisfaction contribute only partially to the final result, as already explained in the comments to the indicators.
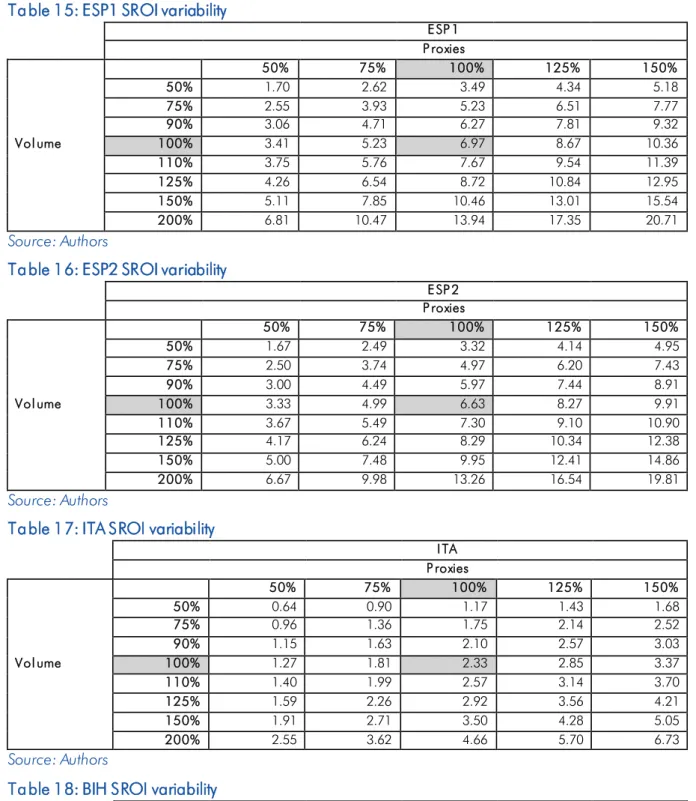
This methodology allows us to incorporate different impact data in a single indicator, facilitating a synthetic assessment. Since the indicators presented in sections 4.2 to 4.5 have an autonomous meaning, they can be commented and interpreted separately, and then summarised in SROI. This double analysis allows a better interpretation of the outcomes depicted by the questionnaires. Since the model is based on monetary estimates (proxies) of non-monetary outcomes, the following tables show how Level-3 SROI varies as the number of clients and the proxies values change. On the Volume line equal to 100% (corresponding to our original number of clients), we can see how Level-3 SROI changes as proxies increase (above 100%) or decrease (below 100%). For all MFIs, Level-3 SROI remains above 1 even when the proxies fall by 50%. In this example, inputs are assumed to be constant.
Table 15: ESP1 SROI variability E SP 1 P roxies 50% 75% 100% 125% 150% 50% 1.70 2.62 3.49 4.34 5.18 75% 2.55 3.93 5.23 6.51 7.77 90% 3.06 4.71 6.27 7.81 9.32 Vol ume 100% 3.41 5.23 6.97 8.67 10.36 110% 3.75 5.76 7.67 9.54 11.39 125% 4.26 6.54 8.72 10.84 12.95 150% 5.11 7.85 10.46 13.01 15.54 200% 6.81 10.47 13.94 17.35 20.71 Source: Authors
Table 16: ESP2 SROI variability
E SP 2 P roxies 50% 75% 100% 125% 150% 50% 1.67 2.49 3.32 4.14 4.95 75% 2.50 3.74 4.97 6.20 7.43 90% 3.00 4.49 5.97 7.44 8.91 Vol ume 100% 3.33 4.99 6.63 8.27 9.91 110% 3.67 5.49 7.30 9.10 10.90 125% 4.17 6.24 8.29 10.34 12.38 150% 5.00 7.48 9.95 12.41 14.86 200% 6.67 9.98 13.26 16.54 19.81 Source: Authors
Table 17: ITA SROI variability
ITA P roxies 50% 75% 100% 125% 150% 50% 0.64 0.90 1.17 1.43 1.68 75% 0.96 1.36 1.75 2.14 2.52 90% 1.15 1.63 2.10 2.57 3.03 Vol ume 100% 1.27 1.81 2.33 2.85 3.37 110% 1.40 1.99 2.57 3.14 3.70 125% 1.59 2.26 2.92 3.56 4.21 150% 1.91 2.71 3.50 4.28 5.05 200% 2.55 3.62 4.66 5.70 6.73 Source: Authors
Table 18: BIH SROI variability
BIH P roxies 50% 75% 100% 125% 150% 50% 0.93 1.34 1.75 2.16 2.57 75% 1.40 2.01 2.63 3.24 3.86 90% 1.68 2.41 3.15 3.89 4.63 Vol ume 100% 1.86 2.68 3.50 4.32 5.14 110% 2.05 2.95 3.85 4.75 5.66 125% 2.33 3.35 4.38 5.40 6.43 150% 2.79 4.02 5.25 6.48 7.71 200% 3.72 5.36 7.00 8.64 10.28 Source: Authors
21
6 Limitations of the study and future improvements
Since the study is conducted on four MFIs in different countries, it allows us to compare different operational models. In our opinion, based on the overall qualitative information gathered, SROI values capture effectively the effects of the projects analysed. In particular, for a correct interpretation, SROI results are combined with the information arising from the focus groups and the interviews with MFI staff. Considering the relatively small number of questionnaires analysed, this additional information can compensate to some extent the size of the survey. An analysis conducted on a larger sample would allow us to generalise the results and apply them to the microfinance sector in Europe, but the participation of the largest institutions would be necessary. In fact, the small size of the sample cannot be defined as statistically relevant enough to extend the analysis to the microfinance sector in Europe. However, since it is known that MFIs in different countries adopt specific operational models in response to their own environmental conditions (Botti, Corsi, Zacchia, 2017; Diriker, Landoni, Benaglio, 2018), a larger SROI study should not overlook the differences between countries.
As for data collection, a SROI analysis requires the gathering of information not only on borrowers, but also on the MFI itself. It also requires good collaboration to contact borrowers and collect information from the different stakeholders involved. If the research is “external” to the MFI, gathering all the data necessary for SROI calculations proves to be difficult, also because research is an additional workload for MFIs who usually have limited resources. For this reason, the adoption of standards in MFI Monitoring Information Systems would have facilitated and allowed a deeper analysis, even from the supply side.
With reference to the scope of the analysis, although employees and the community at large are taken into account, the research is very focussed on borrowers. In future research, additional outcomes could be included to consider other stakeholders (e.g. funders and founders and their institutional commitment) or activities, if any (e.g. social lending or financial education and training). Adjustments for default borrowers should also be taken into account. Indeed, the study is one of the first attempts to apply SROI to microfinance11. Starting from the working hypothesis presented, the measurement tool can be improved with practice and tested on other projects.
Finally, as mentioned above, we believe that research on microfinance in perspective could be improved by introducing a few basic standards in the data collection MFIs routinely make when they assess and monitor their borrowers. A short set of key standard questions could easily and quickly detect the major changes borrowers, their employees, and their households experienced, enabling a deeper analysis of the drop-off rates, by comparing changes at different loan stages. A few more questions on the role played by the MFI in such changes, if collected on a large scale, could help to stabilise the estimate of the attribution measure and to differentiate it according to the different operational models adopted. Introducing such a selected set of questions for borrowers could partially relieve MFIs from time-consuming ad-hoc data collection for impact assessments.
11 MFIs that have developed a framework for SROI analysis are for example Adie (2016) and microStart (2017), and a
7 Annex: Outcome Indicator Description
Level-1 SROI: Monetary Outcomes
Q uestion Indicators Cal culation Measure
What is your average net profit per month?
What was your average net profit / income per month JUST BEFORE underwriting the CURRENT loan?
Change in annual income (individually)
Δ Annual net profit / Y (NOW – BEFORE)
€
Average change in annual income Average of individual changes € Average income increase Average of individual positive
changes
€
Average income decrease Average of individual negative changes
€
Incidence of borrowers experiencing an increase in income
No. of borrowers experiencing an increase in income / Tot. No. of borrowers
%
Incidence of borrowers experiencing a decrease in income
No. of borrowers experiencing a decrease in income / Tot. No. of borrowers
%
This question refers to the social contributions you pay FOR YOURSELF. Please indicate the average amount of social contribution paid every month (NOW and BEFORE the current loan)
Change in social contributions paid annually
(individually)
Δ Social contribution / Y (NOW – BEFORE)
€
Average change in social contributions paid annually
Average of individual changes € This question refers to the tax you pay for
yourself. Please indicate the average amount of tax paid per year (NOW and BEFORE the current loan)
Change in annual tax payments (individually)
Δ Tax / Y
(NOW – BEFORE)
€
Average change in annual tax payments
Average of individual changes € This question refers to the social benefits
you receive from government / regional / local institutions. Please indicate the average amount of benefits received every month [Unemployment benefit, Family
allowances, Retirement pension, Alimentary pension, Health disability allowance, Other additional benefits]
(NOW and BEFORE the current loan)
Change in social benefits received annually
(individually)
Δ Social benefit TOT/ Y (NOW – BEFORE)
€
Average change in social benefits received annually
23
Level-2 SROI: non-monetary economic outcomes
Q uestion Indicators Cal culation Measure
(P roxy) How many people do you employ,
including informal employees?
Increased employment (individually)
Δ Jobs No.
(Average gross cost of an unskilled employee in the country) Average no. of employees Average no. of
employees
No.
(Average gross cost of an unskilled employee in the country) How many rooms do you have in your
accommodation in total, including kitchens, but excluding bathrooms and toilets?
(NOW and BEFORE the current loan)
Improved accommodation (individually)
Δ No. of rooms (NOW – BEFORE)
No.
(Cost per m2 in the
city of residence)
Average no. of new rooms in the house
Average no. of additional rooms in the house
No.
(Cost per m2 in the
city of residence)
Level-3 SROI: non-economic outcomes
Life satisfaction
Q uestion Indicators Cal culation Measure
(P roxy) Now I would like to talk with you about
your satisfaction with your life. The following table shows a scale of 1-7. Please choose the number which best matches your opinion. Number 1 means the least satisfaction and 7 the most satisfaction. [different dimensions: house,
family life, treatment by others, achievements in life, overall rating]
(NOW and BEFORE the current loan)
Changes in life satisfaction (individually)
Avg. of the changes in the individual aspects of life satisfaction
Range: -6 + 6
Incidence of borrowers experiencing higher life satisfaction
No. of borrowers experiencing higher life satisfaction / Tot. No. of borrowers
%
(Social Value Bank: avg value between having high confidence and feeling in control of life, rescaled by the change intensity)
Incidence of borrowers experiencing lower life satisfaction
No. of borrowers experiencing lower life satisfaction / Tot. No. of borrowers
%
(Social Value Bank: avg value between having high confidence and feeling in control of life, minus sign, rescaled by the change intensity)
Financial inclusion (access to bank services)
Q uestion Indicators Cal culation Measure
(P roxy) An account can be used to save money,
to make or receive payments, or to receive wages or financial help. Do you, either by yourself or together with someone else, currently have an account at any of the following places: a bank, [insert all financial institutions], or another type of formal financial institution?
Did you have an account BEFORE the current loan?
Had you ever underwritten any other loan BEFORE becoming a [MFI] client?
Access to credit or bank account
(individually)
1 = financial inclusion effect: the borrower gains access to credit or to a bank account after underwriting the loan 0 = before the loan, the borrower had already taken out a loan or already held a bank account Binary: 0;1 (Social Value Bank: financial comfort) Incidence of borrowers
experiencing access to credit or to a bank account
No. of borrowers experiencing access to credit or to a bank account / Tot. No. of borrowers