Francesco Calderoni Marco De Simoni Serena Favarin Susanne Lehmann
GERMANY
ISSUE
5
THE FACTBOOK ON THE ILLICIT TRADE IN TOBACCO PRODUCTS
Germany
Francesco Calderoni Marco De Simoni Serena Favarin Susanne Lehmann
Series: The Factbook on the Illicit Trade in Tobacco Products Issue 5
Series editor: Ernesto U. Savona
Transcrime – Joint Research Centre on Transnational Crime
Università Cattolica del Sacro Cuore di Milano – Università degli Studi di Trento
Milan office (headquarters): Largo Gemelli, 1 – 20123 Milano (Italy) Phone: +39 02 7234 3715 / 3716; Fax: +39 02 7234 3721
www.transcrime.it
www.transcrime.it
2013
ISBN 978-88-8443-460-9
Suggested Citation: Calderoni Francesco, Marco De Simoni, Serena Favarin and Susanne Lehmann. Germany. The
Factbook on the Illicit Trade in Tobacco Products 5. Trento: Transcrime – Università degli Studi di Trento, 2013. © 2013 Transcrime – Joint Research Centre on Transnational Crime
All rights reserved. No part of this publication may be reproduced, stored in a retrieval system or transmitted in any form or by any means electronic, mechanical, photocopying, recording or otherwise, without the prior written permission of the
author.
Cover Attribution: Luis Echanove Creative Commons License
Transcrime
The factbook on the illicit trade
in tobacco products
Acknowledgments
Executive summary
Introduction
Why focus on the ITTP in Germany?
What can be found in this report?
Chapter 1:
The five drivers
Society and economy
Legal market
Regulation
Crime environment
Enforcement
Chapter 2:
The four components
The demand
The supply
The products
Modus operandi
and geographical distribution
Chapter 3:
Framing the components in the drivers
Introduction: The four key factors
Economic accessibility
Availability
Profitability
Risk
Conclusions
References
1 3 5 7 13 13 14 16 17 23 31 39 45 52 53 60 66 74 75 76 77 56 79 83 72 73TABLE OF CONTENTS
1
The factbook on the illicit trade in tobacco products
GERMANY
Official website: www.transcrime.it
Transcrime is the Joint Research Centre on Transnational Crime of Università Cattolica del Sacro Cuore of Milan
and the University of Trento. The Centre, directed by Ernesto U. Savona, Professor of Criminology at Università Cattolica, represents the multiannual union between experience and innovation in the field of
criminological research.
There are offices in Milan and in Trento. In each office there is a team of researchers and secretariat/ management personnel. Transcrime aims at being a national and international point of reference in the criminological research panorama.
The vision of the Centre is to increase knowledge in
the criminological field and in the prevention of crimes, developing innovative ideas and cutting–edge techniques.
Transcrime combines its experience in applied research with the consolidated scientific tradition of Università Cattolica del Sacro Cuore in Milan and University of Trento, mixing a practice-oriented approach with a profound understanding of criminal phenomena. Through this experience, it developed a solid network of relationships in the academic field, institutions,
international organisations and businesses.
The Centre also plays an important role in the support and development of educational activities at Università Cattolica del Sacro Cuore of Milan. Its principal aim is to achieve close integration between scientific innovation and academic education. In particular, since the academic year 2005/06, Transcrime has managed a MA programme dedicated to crime and security (until academic year 2012/13 the curriculum Crime&Tech: Crime Sciences and Technologies for Security within the MA in Applied
Social Sciences; since the 2013/14 academic year
Curriculum POLISI: Policies for security within the MA in
Public Policy). In addition, the Centre has contributed to the development of the International Ph.D. programme in Criminology, coordinated by Professor Savona, which is currently the only doctoral course dedicated to Criminology in Italy.
Transcrime is an independent academic centre. It pursues an autonomous research agenda, which may be developed also through contracts and funding by private and public local, national and international institutions. The source of funding is always made public through
Transcrime’s website.
3
The factbook on the illicit trade in tobacco products
GERMANY
This report is part of the project the Factbook on the
Illicit Trade in Tobacco Products (henceforth ITTP). The project has been developed by Transcrime after
the Round Table on Proofing EU Regulation against the Illicit Trade in Tobacco Products hosted by Università
Cattolica of Milan, on 5 May 2011. During the Round Table, participants (researchers and policymakers with experience in the field of the illicit trade in tobacco products) agreed on a research agenda concerning the ITTP (Transcrime 2011b). Items 3 and 6 of the research agenda focused on the need for better analysis of the tobacco market taking account of its dual nature (i.e. legal and illicit) and on how licit and illicit markets vary across different countries and regions. Given these considerations, Transcrime has developed the Factbook on the ITTP, a multi-annual research plan providing detailed analyses of the ITTP and of its relations with the legal market and other socio-economic and political
factors in a number of countries around the world.
The aim of the Factbook is to provide an innovative instrument able to shed light on the complex mechanisms behind the ITTP in different countries. This report focuses on Germany.
Tobacco consumption is undoubtedly a danger for human health, and governments should carefully regulate the tobacco market. Illicit tobacco avoids state regulation and taxation and may jeopardise tobacco control policies.
The Factbook will contribute to raising awareness about the global importance of the ITTP and about the strategies available to prevent it. The Factbook
has been developed for a wide readership ranging from policymakers, through academics, to interested stakeholders, the intention being to provide a support to develop knowledge–based debates and policies on the ITTP.
The information gathered for this report originates from academic literature, grey literature, open sources, questionnaires and interviews with experts and stakeholders. There are few studies on the ITTP in Germany. Furthermore, information of law enforcement action comes mainly from the German Customs, while other law enforcement agencies, although involved in the fight against the ITTP, provide more limited data. In addition to the these issues, the data–gathering phase of the project encountered major difficulties due to the number of sources, institutions and stakeholders involved.
The results of the report do not claim to be exhaustive, nor an accurate reflection of criminal practices. They provide an initial assessment of the ITTP in Germany and a starting point for future research.
As a concerned stakeholder in the fight against the illicit
trade in tobacco products, Philip Morris International (PMI) welcomed Transcrime’s initiative to develop the
Factbook on the ITTP with financial support and the
provision of data. However, Transcrime retained full control and stands guarantor for the independence of the research and its results. Information and data for the study have been collected by Transcrime and have not been shared with PMI.
THE FACTBOOK ON
THE ILLICIT TRADE IN
TOBACCO PRODUCTS
5
The factbook on the illicit trade in tobacco products
GERMANY
Special thanks go to Klaus Von Lampe, John Jay College of
Criminal Justice, Klaus Ehrenfried Schmidt, ACMI and CEO
ProtoSecure GmbH, Wolfgang Schmitz, Zollkriminalamt, Jürgen Storbeck, former Director of Europol and former General Director
of the police of the State of Brandenburg (Germany).
7
The factbook on the illicit trade in tobacco products
GERMANY
This report provides the country profile of the project
The Factbook on the Illicit Trade in Tobacco Products.
It focuses on Germany, where illicit trade in tobacco products is not a political priority and there are no official estimates. Nevertheless, German Authorities, and especially German Customs are aware of the problem of
cigarette smuggling.
WHAT CAN BE FOUND IN THIS REPORT?
This report is organised into three chapters:
••
Chapter one deals with the five drivers of the ITTP: society and economy, the legal market, regulation, thecrime environment and enforcement. The drivers are important areas whose structures may positively or negatively impact on the ITTP. To enable
comparison with other country profiles, five
indicators have been selected for each driver. The data for the driver indicators come from comparable sources (latest available years). When possible, the report provides the most up–to–date data from
national sources.
••
Chapter two focuses on the four components of the ITTP: demand, supply, products, modus operandi andgeographical distribution.
••
Chapter three identifies the key factors of the ITTP in Germany and frames the drivers in the components, analysing how different elements of thedrivers influence the components of the ITTP.
THE FIVE DRIVERS
••
Society and economy: Germany is a federal republic composed of 16 states (Länder) and one of thebiggest world economies. The main effect of the 2009 recession was the rise of debt, whilst unemployment fell even during the crisis. GDP growth rebounded soon in 2010, and household expenditure on non–durable goods, including tobacco, has been constant in recent years. However, regional
differences between Eastern and Western Länder are still marked.
••
Legal market: the tobacco market is an important sector of the German economy. Germany is the first exporter of cigarettes in the world, and exports have grown in the past decade. The tobacco industry employed 10,057 people in 2011. However, nationalsales have fallen and consumers have shifted to
cheaper products.
••
Regulation: regulation of the tobacco market ismedium in Germany. Tax incidence, as a share of the final retail price, is high in Germany, if compared with the global average. However, compared with high–income OECD members it is medium. Tax level, expressed in monetary terms (international dollar per 1,000 sticks) is high. Supply chain control is medium. The regulation on tobacco consumption and sales and on marketing and promotion is medium. Furthermore, many European requirements were applied with delay or at minimum levels. The country has invested a low per capita amount of resources in tobacco control policies.
8
Executive Summary
••
Crime environment: crime rates have slightly increased, while fear of crime has decreased. Consumption of cannabis, cocaine and heroin is constant and average compared with levels in other developed countries, whilst other drugs, such as amphetamines, are increasingly popular. Organised crime, corruption and informal economies are low.••
Enforcement: Germany has high levels of law enforcement, but action against the ITTP is medium–low. Cooperation between institutions and tobacco manufacturers is usually set at European level, as well as the legal duty for producers notto facilitate smuggling. There are different law
enforcement agencies involved in the fight against the ITTP. In particular, the Zollkriminalamt (Customs
Criminal Office) considers illicit tobacco as a priority and has undertaken several joint actions with
authorities in neighbouring countries and the tobacco
industry.
THE FOUR COMPONENTS OF THE ITTP
••
The demand: the main causes of the demand for illicittobacco are low prices and availability. In Germany, illicit cigarettes cost half the legal price. Furthermore, proximity to low price markets makes illicit products easily available.
••
The supply: the supply of illicit tobacco is mainly driven by the opportunity to make very high profits with relatively low risks. There is a variety of actors involved in the ITTP.••
The products: there are no official estimates of the illicit tobacco market, which makes it difficult to assess the extent of the ITTP. However, there are some unofficial estimates. The main illicit productsare contraband cigarettes. The market share of illicit
whites is smaller but nevertheless significant.
••
Modus operandi and geographical distribution:inland roads are the main smuggling routes, and some ports play an important role, also as European hubs. Germany is often a transit country from Eastern to Western Europe. Proximity to the Polish and Czech
borders correlates with a larger share of
non–domestic tobacco products.
FRAMING THE COMPONENTS IN THE
DRIVERS
The four key factors of the ITTP
The report identifies four key factors of the ITTP in Germany. The key factors are the crucial elements through which the five drivers determine the features of the four components. This chapter analyses how the interaction between the drivers and the components impact or may impact on the ITTP through these four key factors (Figure 1, p.9).
••
Economic accessibility: the price of illicit tobacco, and particularly its relative price compared to the price of legal products.•
German consumers have not significantly cut their expenditure in tobacco, showing a downtrading trend towards cheaper products as a reaction to increasing price (see Legal Market, p.23). Therefore, the demand for ITTP products may increase through their economic accessibility.•
The government has announced a five–year plan of tax increases in tobacco products (Euromonitor International 2012). Since tax increase result in higher retail price, illicit products become more economic accessible, boosting their demand.••
Availability: easiness for both smugglers and consumers to obtain illicit tobacco products.•
Germany has more than 1,300 km of common borders with Poland and the Czech Republic. These countries have lower retail prices for tobacco products. Indeed, EPS show a higher prevalence of non–domestic packs along these borders.•
Poland and the Czech Republic joined the Schengen area in December 2007 and their entry seems to have favoured smuggling activities towards Germany (Locke 2010). Indeed, in 2006, nearly a quarter ofall counterfeit and contraband cigarettes stemmed
from Poland and the Czech Republic. In 2012, the proportion more than doubled, reaching 80% (KPMG 2012; KPMG 2013).
9
Executive Summary
The factbook on the illicit trade in tobacco products
GERMANY
•
The geographical position between East and West Europe makes Germany both a destination and a transit country for ITTP. Indeed, according to Customs press releases, a considerable number of intercepted illicit cigarettes is intended for more profitable Western markets, such as France or the UK.•
Contexts of the informal economy, like street markets, facilitate the selling of illicit tobacco products (Joossens et al. 2000; Antonopoulos 2009). In Germany, informal street markets are located especially in Berlin, where people may easily find illicit cigarettes (Von Lampe 2005).••
Profitability: the ability of the ITTP to generateprofits that exceed its operational costs.
•
The tax level expressed in monetary terms (total taxes per 1,000 cigarettes) may encourage suppliers of illicit tobacco through the higher profitability of this activity. Indeed, the higher the taxes, the greater the potential profit for smugglers. In Germany, the monetary amount of taxes per 1,000 sticks is high (see The supply, p.56).•
The lower retail prices of tobacco products in Eastern neighbouring countries stimulates ITTP making bootlegging and smuggling profitable activities. Nevertheless, the increasing price of tobacco products in Poland may change the picture in the near future.••
Risk: the threat of detection/accusation/conviction and the sanctions imposable to the actorsinvolved in the ITTP.
crime environment
low corruption street sellers smuggling routes ethnic relationshipsDecrease
of the ITTP
Change
of the ITTP
Increase
of the ITTP
geographical positionlower price neighbours
society & economy
DE–PL–CZ cooperation
enforcement
legal market
price differentials downtrading trendregulation
taxationDecrease of the ITTP Change of the ITTP Increase of the ITTP Figure 1. Main interactions between the drivers and the components
10
Executive Summary
•
Cooperation among German and foreign enforcement authorities may significantly diminishes theeffectiveness of anti–ITTP actions increasing the risk of detection for smugglers. Notably, Germany has recently increased its collaboration with Polish and Czech agencies (Hauptzollamt Dresden 2013; Zollfahndungsamt Dresden 2013; Koschyk 2013).
•
The German motorway system may favour the transit and arrival of illegal ITTP products. Indeed, there are several consolidate smuggling routes, Indeed Autobahn A2 and A12 are known under the name “Warschauer Allee” (Warsaw Avenue) since they are the most important smuggling routes from Eastern Europe into Germany (DKFZ 2010; Teevs 2010).•
Ethnic and kinship relationships among ITTP players facilitate tobacco smuggling activities. Indeed, in Germany, the distribution of illicit tobacco relies on personal contacts. These networks affect the prevalence of ITTP by diminishing the risk for the actors involved (Von Lampe 2003).•
The retail distribution of contraband cigarettes inGermany is commonly associated with street selling by Vietnamese vendors in the eastern parts of the country (Von Lampe 2006), while the main suppliers are Polish (see The supply, p.56).
CONCLUSIONS
There are no official estimates of ITTP in Germany, although some unofficial estimates are available. Despite the lack of official data, contraband cigarettes seem to be widely available in Germany, especially in the Eastern part. In bordering states, it is difficult to disentangle smuggling, bootlegging and legal
cross–border purchases. Historical and geographical
conditions are the main causes of the diffusion of these
products.
The results of this study demonstrate the need for more data and research. The main questions to address concern the demand for illicit tobacco and the types of products. First, the drivers of the demand are relatively unknown in Germany, since no consumer survey has been conducted on illicit consumption. Second,
distinguishing between non–domestic legal and illegal
cigarettes is an important challenge.
The ITTP is a complex problem not limited to an issue of law enforcement and criminal justice policy alone. Notwithstanding German Customs efforts, the ITTP seems to have increased over recent years. Additional preventive measures, such a national public awareness campaign, are necessary. Effective action against the ITTP requires comprehensive strategies including criminal law, administrative sanctions, and other indirect measures aimed at reducing crime opportunities.
The evolution of the project showed that countries have very different situations in relation to the available data on the ITTP. In some cases, the quality of the available data
is low and there are no official, regularly updated, data.
Inevitably, this may affect the quality and reliability of the results. In these cases, institutions, businesses and other stakeholders concerned by the ITTP should consider how to improve the data collection on illicit tobacco. This will result in an improvement in the knowledge of the ITTP and, in turn, in better tobacco control policies, since quite
often the impact of specific policy measures upon crime
may be overlooked due to the lack of reliable data.
Following the completion of the first phase of the project
focused on collecting facts and data through the country
profiles, Transcrime will perform a comparative analysis of
the selected countries. This will provide additional insights in the complexity of the ITTP and allow for the elaboration of policy recommendations.
11
The factbook on the illicit trade in tobacco products
12
Source: The World Bank Location:
Germany, officially the Federal Republic of Germany, is in Western and Central Europe. It borders with North Sea, Denmark and Baltic Sea to the North, Poland and the Czech Republic to the East, Austria and Switzerland to the South, France, Luxembourg, Belgium and the Netherlands to the West. The country consists of 16 states, and its capital and largest city is Berlin. Germany covers an area of 357,021 square kilometres.
Population: 81,726,000 (2011)
Male: 40,078,925 (49.0%)
Female: 41,647,075 (51.0%) Growth Annual Rate: -0.1% (2011)
Age Structure: (0–14) 13.4%; (15–64) 66.0%; (65+) 20.6% Fertility Rate: 1.39 children born/woman (2010) Life expectancy at birth (years): 80.0 (2010) GDP: US$3,570,555,555,556 (2011)
GDP growth: 3.0% (2011)
Inflation consumer price: 2.3% (2011) Income level: High
Baltic Sea North Sea Bremen Munich Hanover Dresden Hamburg Stuttgart Kiel Mainz Erfurt Potsdam Schwerin Magdeburg Wiesbaden Düsseldorf Saarbrücken Berlin Lower Saxony North Rhine–Westphalia Rhineland–Palatinate Baden–Württemberg Bavaria Saxony Mecklenburg–Vorpommern Thuringia Schleswig–Holstein Branderburg Saxony Anhalt Hesse Saarland BELGIUM NETHERLANDS DENMARK FRANCE SWITZERLAND AUSTRIA CZECH REPUBLIC POLAND
13
The factbook on the illicit trade in tobacco products
GERMANY
Figure 2. The dual tobacco market
legal market
illegal market
overlap in
demand
WHY FOCUS ON THE ITTP IN GERMANY?
Germany is a key country for the European and world economy. Also for the tobacco sector, Germany is the world leading exporter of cigarettes. Despite the strong manufacturing capacity, different sources suggest that German illicit market has increased over the last decade.
The current situation is due to a number of factors.
First, Germany is a very important hub for the cigarette trade in general and this may reflect also on the ITTP. The country is at the heart of Europe and it borders with nine countries (Denmark, Netherlands, Luxembourg, France, Switzerland, Belgium, Austria, Czech Republic and Poland). The geographical position, the transport infrastructures (ports and highways) and the role in the tobacco manufacturing industry make Germany an important joint for the world tobacco trade.
Second, Germany is a bridge between Eastern and Western Europe and this applies also to the ITTP. The removal of border controls along Germany’s nearly 1,300 kilometres of borders with Poland and the Czech Republic in 2007 went along with a rise in criminality in the bordering regions mainly due to the prosperity differential. Eastern Germany is close to low–price countries for tobacco products, notably Poland. Furthermore, there are consolidated smuggling routes
between these two countries.
Third, there are regional disparities across German states which may stimulate the ITTP. Years after the unification, the Eastern Länder still have lower socio–economic
conditions. In these states, the general attitude towards smuggling of goods, including illicit tobacco, is more lenient, due to economic difficulties and socio–cultural patterns. The proximity of the less wealthy states to countries with lower prices of tobacco products further increases the opportunities for the development of the ITTP.
Finally, there are no official estimates on the illicit tobacco in Germany and there is an overall lack of information. Besides the law enforcement agencies directly involved in the fight against the ITTP, there are a few studies on this topic in Germany.
Given the lack of information, this report relies on unofficial sources, grey literature, interviews with experts, law enforcement authorities reports and press releases. Notably, this report analyses Customs press releases since they are the most specific publicly available source on illicit tobacco. Nevertheless, the contribution of the other German law enforcement authorities is relevant and further studies may assess in a greater detail their action against the ITTP.
Unofficial sources and Customs press releases show a major prevalence of contraband cigarettes. Also illicit whites account for a large proportion of the trade. Generally, Eastern Germany reports a higher incidence of non–domestic tobacco products.
Tobacco is a dual market consisting of a legal and an
illegal part (Figure 2). The two sides of the market are connected with each other: actions affecting one side of the market influence the other side as well.
14
The ITTP comprises different activities and products:
Smuggling (or contraband): the unlawful movement
or transportation of tobacco products (genuine or counterfeit) from one tax jurisdiction to another without the payment of applicable taxes or in breach of laws prohibiting their import or export (Joossens and Raw 2008).
Counterfeiting: the illegal manufacturing of a product
bearing or imitating a trademark without the owner’s
consent. Illegally manufactured products can be sold in the source country or smuggled into another country (Joossens and Raw 2008).
Bootlegging: the legal purchase of tobacco products in a low-tax country and the illegal resale of these products in a high-tax country. Bootlegging concerns individuals or small groups who smuggle smaller quantities of cigarettes, taking advantage of tax differentials, with the aim of making extra income (Hornsby and Hobbs 2007).
Unbranded tobacco: manufactured, semi-manufactured and even loose leaves of tobacco (also known as “chop-chop” (Geis 2005)), illegally sold by weight (e.g. in large plastic bags, also known as “baggies”), with no labelling or health warnings and consumed in roll-your-own cigarettes or in empty cigarette tubes (Walsh, Paul, and Stojanovski 2006).
Cheap Whites or Illicit Whites: cigarettes produced legally in one country, but normally intended for smuggling into countries where there is no prior legal market for them. Taxes in production countries are normally paid, while they are avoided/evaded in destination countries (Allen 2011).
Illegal manufacturing: cigarettes manufactured
for consumption, which are not declared to the tax authorities. These cigarettes are sold without tax and may be manufactured in approved factories or illegal covert operations (Joossens et al. 2010).
Studies on the ITTP in Germany are limited in number. Moreover, there are no official data on prevalence, demand for, and consumption of illicit products. This entails that the actual dynamics of the illicit market and its structure have to date been largely under–researched. The main sources used by this study are Customs press releases, Federal police reports and data on illicit tobacco products seizures, KMPG and Euromonitor International data, empty pack surveys commissioned by the tobacco industry, interviews with experts, and media news. All non–official sources are treated with caution in order to minimise the impact of their possible bias.
WHAT CAN BE FOUND IN THIS REPORT?
This report is organised into three chapters.
Chapter 1 is composed of five subsections analysing the five drivers of the ITTP:
1) society and economy 2) legal market
3) regulation
4) crime environment 5) enforcement
The drivers are important areas whose structures may influence the ITTP positively or negatively. Transcrime
selected the drivers based on a review of the literature on
the ITTP and discussions with stakeholders and experts. Each subsection provides information on the key aspects
of each driver.
To enable comparison with other country profiles,
each driver has four key indicators. The data for the drivers’ indicators come from different sources to ensure
the comparability among different countries to the latest available years (e.g. World Bank, WHO, UN). When possible, the report provides the most up–to–date data from national sources. For four indicators, Transcrime has elaborated composite indicators (see Regulation and Enforcement, p.31 and p.45). Composite indicators assess the presence of specific policy measures in the country and range from 0 (no measure is present) to 5 (all measures are present). A higher value on the composite indicators does not always imply a better situation. Their purpose is rather to assess the intensity of policy measures in a specific field. The information used for the assessment is drawn from the literature, official sources (reports, websites, legislation) and experts.
15
The factbook on the illicit trade in tobacco products
GERMANY
Chapter 2 analyses the illicit trade in Germany, dividing it
into its four components of the ITTP:
1) the demand 2) the supply 3) the products
4) the modus operandi and geographical distribution.
Chapter 3 combines the results of the two previous chapters to identify the four key factors of the ITTP and
show how the various elements of the drivers influence
the illicit trade.
17
The factbook on the illicit trade in tobacco products
GERMANY
SOCIETY & ECONOMY
G
ermany is a federal republic and one of the
biggest world economies. Although public debt rose as
a consequence of the 2009 recession, unemployment
fell and GDP growth rebounded in 2010. Households
did not cut their expenditure on non–durable goods,
including tobacco. However, regional differences
among Eastern and Western Länder are still marked.
Low–income and low–social groups have higher
smoking prevalence rates.
18
Low %
Society & Economy
0.30
20 out of 34 countries
(late 2000s)
Income Inequality
GINI coefficient after taxes
Source: OECD
Education System
Education expenditure
as % of GDP
Source: The World Bank
4.8%
21 out of 157 countries
(2010)
Adult Population
Population aged 15+
Source: The World Bank
86.6%
4
out of 193 countries
(2011)
High % Low % High Low High %Last national available data (2012):
5.5%
(Destatis 2013)13.2%
53 out of 213 countries
(2010)
Unemployment
Total unemployment
rate (% of labour force)
Source: OECD
6.0%
25 out of 34 countries
(2011)
Migration
International migrant stock
as % of population
Source: The World Bank
High % Low % High % Low % 91,683 88,218 86,58383,916 84,466 2007 2008 2009 2010 2011 0.29 0.30 mid-2000s late-2000s 85.8 86.0 86.2 86.3 86.4 86.5 86.6 2005 2006 2007 2008 2009 2010 2011 4.7 4.6 5.0 5.3 5.1 4.8 2005 2006 2007 2008 2009 2010 12.9 13.2 2005 2010 10.4 11.3 10.4 8.7 7.6 7.8 7.2 6.0 2004 2005 2006 2007 20082009 2010 2011 32 29 2006 2009 83,439 2012 122,124 126,292 148,354 135,404 136,315 138,640 2007 2008 2009 2010 2011 2012 5.55 5.74 2008 2010 75.8 74.1 2008 2010 80.3 80.6 2008 2010 7.9 8.0 7.9 8.0 79.0* 14 14 15 14 13 2008 2009 2010 2011 2012 Value Rank 1.05 0.98 0.92 0.88 0.86 0.84 2005 2006 2007 2008 2009 2010 0.20.9 0.20.8 4.8 4.8 2011 2012
Opioids Cocaine Cannabis
16.1 16.3 16.1 16.0 15.6 15.3 2002 2003 2004 2005 2006 2007 24.7 17.9 24.4 24.4 24.8 2004 2005 2006 2007 2008 2009 2010 299.0 300.7 303.2303.4 300.2 298.2 296.0 2004 2005 2006 2007 2008 2009 2010 2007 2008 2009 2010 2011 565,237 354,402 343,091 191,985 195,776 210.3 212.6
Tax % final retail price Tax per 1,000 sticks/Int.$, PPP
91,683 88,218 86,58383,916 84,466 2007 2008 2009 2010 2011 0.29 0.30 mid-2000s late-2000s 85.8 86.0 86.2 86.3 86.4 86.5 86.6 2005 2006 2007 2008 2009 2010 2011 4.7 4.6 5.0 5.3 5.1 4.8 2005 2006 2007 2008 2009 2010 12.9 13.2 2005 2010 10.4 11.3 10.4 8.7 7.6 7.8 7.2 6.0 2004 2005 2006 2007 20082009 2010 2011 32 29 2006 2009 83,439 2012 122,124 126,292 148,354 135,404 136,315 138,640 2007 2008 2009 2010 2011 2012 5.55 5.74 2008 2010 75.8 74.1 2008 2010 80.3 80.6 2008 2010 7.9 8.0 7.9 8.0 79.0* 14 14 15 14 13 2008 2009 2010 2011 2012 Value Rank 1.05 0.98 0.92 0.88 0.86 0.84 2005 2006 2007 2008 2009 2010 0.20.9 0.20.8 4.8 4.8 2011 2012
Opioids Cocaine Cannabis
16.1 16.3 16.1 16.0 15.6 15.3 2002 2003 2004 2005 2006 2007 24.7 17.9 24.4 24.4 24.8 2004 2005 2006 2007 2008 2009 2010 299.0 300.7 303.2303.4 300.2 298.2 296.0 2004 2005 2006 2007 2008 2009 2010 2007 2008 2009 2010 2011 565,237 354,402 343,091 191,985 195,776 210.3 212.6
Tax % final retail price Tax per 1,000 sticks/Int.$, PPP
19
Chapter 1: The Five Drivers
The factbook on the illicit trade in tobacco products
GERMANY
••
Germany is one of the biggest world economiesand has one of the highest Human Development Indexes.
•
Germany has 82,726,000 inhabitants and one of the largest adult populations in the world. The country ranks 4th out of 193 countries for the proportion of the population aged over 15 (World Bank 2012).•
Germany is a UN, EU, G8 and NATO member, and it is the fourth world economy after USA, China and Japan (World Bank 2012). The standards of living are high, and Germany has a prominent role in the European Union and in the global arena.•
In Germany, the average person earns US$27,692 per year, while the OECD average is US$22,387 per year (OECD 2012d).•
According to the Human Development Report (UNDP 2011), Germany has the 9th highest Human Development Index (HDI) with a score of 0.905.•
Germany ranks 124th out of 136 countries in income inequality (CIA 2012a). Moreover, it ranks 20th out of 34 OECD countries for the GINI index after taxes (OECD 2012a).•
The top 20% of the population earns more than four times as much as the bottom 20% (OECD 2012e).••
Germany has been less affected by the globalfinancial crisis than other European countries.
•
In the last decade, GDP growth was slightly negativein 2003 (-0.4%) and heavily negative in 2009 (-5.1%). In the other years, the German economy grew well above EU average. Pre–crisis real GDP levels were again reached in the second quarter of 2011 (OECD 2012c).
•
Unemployment is low and decreasing. Indeed, total unemployment as percentage of labour force was 6.0% in 2011 (down from 10.4% in 2004) and the country ranked 25th out of 34 (World Bank 2012). In 2012 unemployment was 5.5% (Destatis–Statistisches Bundesamt 2013).•
Germany is one of only three OECD countries, together with Israel and Poland, to have recorded a reduction in unemployment rates during the 2007–2009 economic crisis. Indeed, unemployment fell by nearly 1% (OECD 2011a).•
The German economy has been more resilient to the global financial crisis than other developed economies. In fact, the UK, the USA and Germany are the only OECD economies where wealth has recovered its 2007 level in constant exchange rate terms (Shorrocks, Davies, and Lluberas 2011).•
The public debt has increased by almost 20% of GDP since 2007, reaching 83% of GDP in 2010 (OECD 2012c).••
Household expenditure has increased in the past decade in Germany (Figure 3).Figure 3. Household final consumption expenditure, PPP (constant 2005 International $)
Source: Transcrime elaboration on World Bank data
27 53 7 14 46 26 9 19 44 19 12 25 48 9 15 27 35 10 11 45 Social security General services Other expenditure Schools, institutions of higher education, other education Pensions Debt Science, research, cultural 55% 12% 11% 8% 5%5% 2% 1,340 1,360 1,380 1,400 1,420 1,440 1,460 1,480 1,500 1,520 1,540 99 00 01 02 03 04 05 06 07 08 09 10 11 B n 0% 20% 40% 60% 80% 100% 2003 2004 2005 2006 2007 2008 2009 2010 2011 HRT sales (cigarettes equivalent)/Total sales (cigarettes and HRT cigarettes equivalent)
HRT sales (cigarettes equivalent)/Cigarettes sales
16 34 38 37 34 34 34 33 27 22 15 11 7 12 27 26 23 24 26 27 24 19 14 9 5 3 0% 5% 10% 15% 20% 25% 30% 35% 40% 15 to 20 20 to 25 25 to 30 30 to 35 35 to 40 40 to 45 45 to 50 50 to 55 55 to 60 60 to 65 65 to 70 70 to 75 75 and Male Female 54 55 32 50 45 10 53 41 17 44 34 12 36 31 14 26 27 6 0% 10% 20% 30% 40% 50% 60% 18-39 40-59 60+ 18-39 40-59 60+ Male Female
Low-social status Mid-social status High-social status
50% 60% 70% 80% 90% 100% 93 94 95 96 97 98 99 00 01 02 03 04 05 06 07 08 09 10 11 12 as % of TIRSP (Tax Inclusive Retail Selling Price) as % of WAP (Weighted Average Price)
0 0.2 0.4 0.6 0.8 1 1.2 1.4 1.6 1.8 0.2 0.9 4.8 0.2 0.8 4.8 0% 1% 2% 3% 4% 5% 6%
Opioids Cocaine Cannabis
Drug report 2011 Drug report 2012
0% 5% 10% 15% 20% 25% 30% 35% 40% 45% 50% 1989 1993 1997 2001 2004 2008 2010 2011 Aged 12-17 Aged 18-25 0 200 400 600 800 1,000 1,200 98 99 00 01 02 03 04 05 06 07 08 09 10 11 Ci ga re tte s (m n st ic ks ) 24 25 9 38 31 5 27 37 34 10 19 42 16 27 6 51 20 25 8 47 26 23 9 42 26 20 8 49 0% 10% 20% 30% 40% 50% 60% 70% 80% 90% 100% 2006 2007 2008 2009 2010 2011 2012 0% 5% 10% 15% 20% 25% 30% Q1 2010 Q2 2012 Q3 2010 Q4 2010 Q1 2011 Q2 2011 Q3 2011 Q4 2011 Q1 2012 Q2 2012 Q3 2012 Counterfeit Marlboro over total non-domestic Marlboro packs Counterfeit L&M over total non-domestic L&M packs
0% 10% 20% 30% 40% 50% 60% 2005 2006 2007 2008 2009 2010 2011
Western Länder Germany Eastern Länder
0.4 0.5 0.3 1.6 2.7 0.6 0.0% 0.5% 1.0% 1.5% 2.0% 2.5% 3.0%
Both sexes Male Female
Aged 12-17 Aged 18-25 21 36 4 11 14 20 61 33 0% 20% 40% 60% 80% 100% 2006 2007 2008 2009 2010 2011 2012
Poland Czech Republic Russia Other countries
Poland Czech Republic Spain Other countries
54% 52 22 47 40 14 47 41 17 39 36 10 46 34 15 35 31 15 0% 10% 20% 30% 40% 50 60% 18-39 40-59 60+ 18-39 40-59 60+ Male Female
Low-income Mid-income High-income
182 86 52 22 10 3 3 199 127 67 1 1 1 3 0 50 100 150 200 250 M n of € 2005 2010 R² = 0.2799 0 % 10 % 20 % 30 % 40 % 50 % 60 % 70 % 80 % 90 % 100 % 10,000 20,000 30,000 40,000 50,000 60,000 N on– do m es tic in ci de nc e
Gross domestic product at current prices per capita at NUTS 2 level (2010)
Schleswig–Holstein, Hamburg, Bremen, Lower Saxony
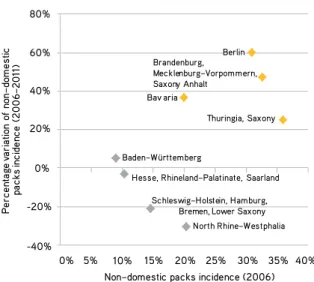
North Rhine–Westphalia Hesse, Rhineland–Palatinate, Saarland Baden–Württemberg Bav aria Thuringia, Saxony Brandenburg, Mecklenburg–Vorpommern, Saxony Anhalt -40% -20% 0% 20% 40% 60% 80% 0% 5% 10% 15% 20% 25% 30% 35% 40% P er ce nt ag e va ri at io n of n on –d om es tic pa ck s in ci de nc e (2 0 0 6–2011)
Non–domestic packs incidence (2006)
Berlin 0 50,000 2012 100,000 150,000 200,000 250,000 Ci ga re tte s (m n st ic ks )
Production Sales Import Export
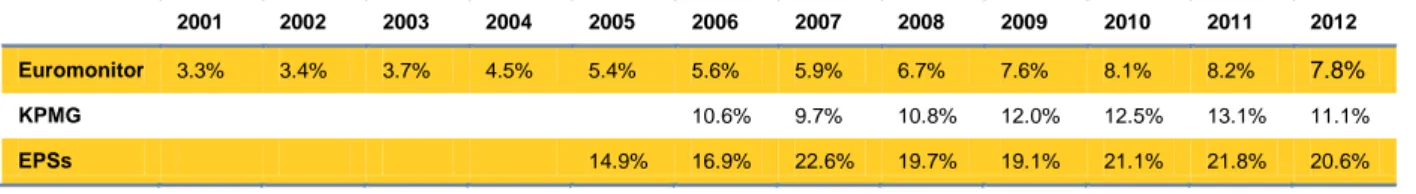
0% 5% 10% 15% 20% 25% 2001 2002 2003 2004 2005 2006 2007 2008 2009 2010 2011 2012 Euromonitor Kpmg EPSs
•
Housing, energy, and maintenance of the dwelling historically constitute the highest spending category of German households. In 2010 housing costs represented 34.1% of private consumption expenditure. Food, beverages and tobaccorepresented 14.1% of expenditure in 2010, the same share as transport-related costs
(Destatis–Statistisches Bundesamt 2010).
•
After the French, the Germans are the top shopper in the OECD in terms of time. The French spend 32 minutes per day shopping, while Germans spend 31 minutes (OECD 2011a).20
•
Average monthly household expenditure increased in both absolute and percentage terms from 1998 to 2003; it was nearly constant from 2003 to 2008 (Table 1).•
Low–income is correlated with higher tobaccoconsumption in Germany. Indeed, in low–income households (i.e. with a monthly income of up to €1,300), the share of smokers is 33%; in
medium–income households (monthly income from €2,600 to €4,500) it is 24%, and 19% in households with an income of over €4,500 (Laue 2010).
••
High levels of social security characterise the German welfare state.•
More than half of public expenditure is devoted to social security, which is financed by generous social security contributions that in 2009 represented a proportion of 39% of total tax revenues in 2009 (OECD 2012c).••
Social security accounts for more than half of public expenditure (Figure 4).••
Public spending on education in Germany ismedium–high, but low in comparison with similar countries.
•
Education expenditure over GDP was 4.8% in 2010. Germany ranked 21st out of 157 countries (World Bank 2012). Considering only OECD countries, Germany spent only 4.8% of GDP on education in 2008, significantly below the OECD average of 5.9%. As a result, Germany ranked 30th among 36 countries (OECD 2011b).•
Nevertheless, the average student in Germany scored 510 for reading literacy, mathematics and sciences, higher than the OECD average of 497 in 2009 (OECD 2012e). However, the average difference in results, between the top 20% and bottom 20%, is 125 points, which is much higher than the OECD average of 99 points and one of the largest gaps among the OECD countries (OECD 2012e).••
Public spending on health in Germany is relatively high.•
Health spending accounted for 11.6% of GDP in 2010, higher than the OECD average of 9.5%. Germany ranked 9th among OECD countries in health spending per capita, with US$4,338 per person in 2010(adjusted for purchasing power parity, OECD average was US$3,268 per capita) (OECD 2012b).
•
On average, life expectancy at birth reached 80.19 years in 2012. Women live almost five years longer than men (82.58 years in 2012). The country ranks 28th out of 220 countries (CIA 2012b).Society & Economy
Average household expenditure on tobacco per month € %
1998 14 5.5
2003 18 6.5
2008 18 6.2
Supply chain control indicator Value
1) The retail of tobacco products is subject to licensing 0 points 2) The manufacture of tobacco products is subject to licensing 1 point 3) There is a mandatory system of customer identification and verification applied
to the supply chain of tobacco products 0.5 points
4) There is a tracking and tracing system for tobacco products 0.5 points 5) Absence of free–trade zones for tobacco products 0.5 points
Tobacco consumption and sales indicator Value
1) Ban on smoking in public places 1 point
2) Ban on smoking in workplaces 0 points
3) Ban on the sale of tobacco products from vending machines 0 points
4) Prohibition of tobacco sales to minors 1 point
5) Ban on smoking in bars, cafés and restaurants 0.5 points
Tobacco marketing and promotion indicator Value
1) Ban on tobacco sponsorship and advertising on radio, TV, broadcasted programmes and in print media 1 point
2) Ban on billboards and outdoor advertising 1 point
3) Ban on the display of tobacco products at points of sale 0 points
4) Ban on free distribution of tobacco samples 1 point
5) Mandatory pictorial health warnings 0 points
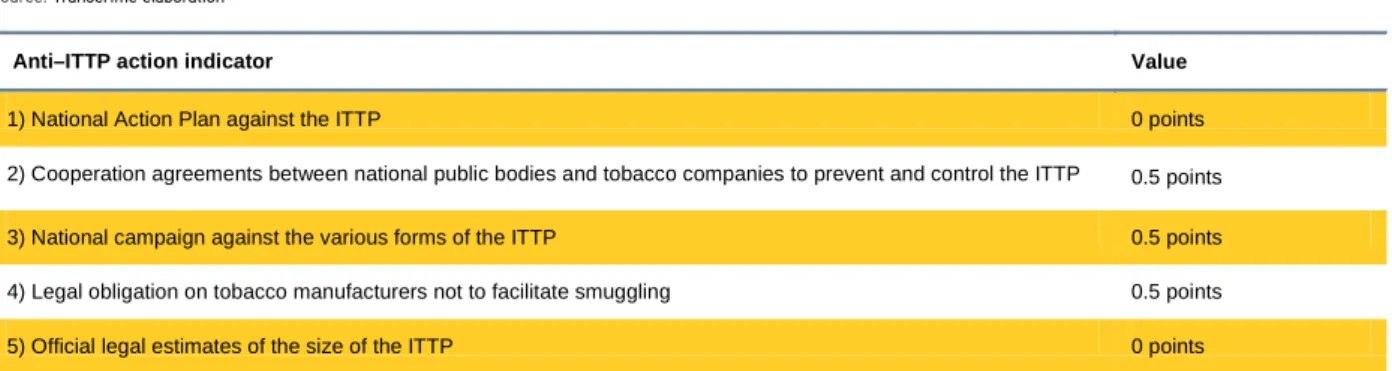
Anti–ITTP action indicator Value
1) National Action Plan against the ITTP 0 points
2)Cooperation agreements between national public bodies and tobacco companies to prevent and control the ITTP 0.5 points 3) National campaign against the various forms of the ITTP 0.5 points 4) Legal obligation ontobacco manufacturers not to facilitate smuggling 0.5 points
5) Official legal estimates of the size of the ITTP 0 points
2001 2002 2003 2004 2005 2006 2007 2008 2009 2010 2011 2012 Euromonitor 3.3% 3.4% 3.7% 4.5% 5.4% 5.6% 5.9% 6.7% 7.6% 8.1% 8.2% KPMG 10.6% 9.7% 10.8% 12.0% 12.5% 13.1% EPSs 14.9% 16.9% 22.6% 19.7% 19.1% 21.1% 21.8% 20.6% 11.1% 11.1% 2001 143,578 1,778 14,727 2002 146,163 2,571 16,321 2003 134,968 2,509 19,473 2004 113,414 3,132 25,149 2005 96,970 3,651 34,036 2006 93,673 5,488 23,641 2007 91,683 6,411 23,998 2008 88,218 4,974 23,733 2009 86,583 3,812 25,212 2010 83,916 3,967 26,242 2011 84,466 4,118 27,363 2012 83,439 4,044 27,658 Cigarettes (mn sticks) Cigars (mn units) HRT (Tonnes) 7.8% Table 1. Household expenditure on tobacco
Source: Transcrime elaboration on Destatis–Statistisches Bundesamt data
Figure 4. 2010 public expenditure by functional areas Source: Transcrime elaboration on 2013 Destatis–Statistisches Bundesamt data
27 53 7 14 46 26 9 19 44 19 12 25 48 9 15 27 35 10 11 45 Social security General services Other expenditure Schools, institutions of higher education, other education Pensions Debt Science, research, cultural 55% 12% 11% 8% 5%5% 2% 1,340 1,360 1,380 1,400 1,420 1,440 1,460 1,480 1,500 1,520 1,540 99 00 01 02 03 04 05 06 07 08 09 10 11 B n 0% 20% 40% 60% 80% 100% 2003 2004 2005 2006 2007 2008 2009 2010 2011 HRT sales (cigarettes equivalent)/Total sales (cigarettes and HRT cigarettes equivalent)
HRT sales (cigarettes equivalent)/Cigarettes sales
16 34 38 37 34 34 34 33 27 22 15 11 7 12 27 26 23 24 26 27 24 19 14 9 5 3 0% 5% 10% 15% 20% 25% 30% 35% 40% 15 to 20 20 to 25 25 to 30 30 to 35 35 to 40 40 to 45 45 to 50 50 to 55 55 to 60 60 to 65 65 to 70 70 to 75 75 and Male Female 54 55 32 50 45 10 53 41 17 44 34 12 36 31 14 26 27 6 0% 10% 20% 30% 40% 50% 60% 18-39 40-59 60+ 18-39 40-59 60+ Male Female
Low-social status Mid-social status High-social status
50% 60% 70% 80% 90% 100% 93 94 95 96 97 98 99 00 01 02 03 04 05 06 07 08 09 10 11 12 as % of TIRSP (Tax Inclusive Retail Selling Price) as % of WAP (Weighted Average Price)
0 0.2 0.4 0.6 0.8 1 1.2 1.4 1.6 1.8 0.2 0.9 4.8 0.2 0.8 4.8 0% 1% 2% 3% 4% 5% 6%
Opioids Cocaine Cannabis
Drug report 2011 Drug report 2012
0% 5% 10% 15% 20% 25% 30% 35% 40% 45% 50% 1989 1993 1997 2001 2004 2008 2010 2011 Aged 12-17 Aged 18-25 0 200 400 600 800 1,000 1,200 98 99 00 01 02 03 04 05 06 07 08 09 10 11 Ci ga re tte s (m n st ic ks ) 24 25 9 38 31 5 27 37 34 10 19 42 16 27 6 51 20 25 8 47 26 23 9 42 26 20 8 49 0% 10% 20% 30% 40% 50% 60% 70% 80% 90% 100% 2006 2007 2008 2009 2010 2011 2012 0% 5% 10% 15% 20% 25% 30% Q1 2010 Q2 2012 Q3 2010 Q4 2010 Q1 2011 Q2 2011 Q3 2011 Q4 2011 Q1 2012 Q2 2012 Q3 2012 Counterfeit Marlboro over total non-domestic Marlboro packs Counterfeit L&M over total non-domestic L&M packs
0% 10% 20% 30% 40% 50% 60% 2005 2006 2007 2008 2009 2010 2011
Western Länder Germany Eastern Länder
0.4 0.5 0.3 1.6 2.7 0.6 0.0% 0.5% 1.0% 1.5% 2.0% 2.5% 3.0%
Both sexes Male Female
Aged 12-17 Aged 18-25 21 36 4 11 14 20 61 33 0% 20% 40% 60% 80% 100% 2006 2007 2008 2009 2010 2011 2012
Poland Czech Republic Russia Other countries
Poland Czech Republic Spain Other countries
54% 52 22 47 40 14 47 41 17 39 36 10 46 34 15 35 31 15 0% 10% 20% 30% 40% 50 60% 18-39 40-59 60+ 18-39 40-59 60+ Male Female
Low-income Mid-income High-income
182 86 52 22 10 3 3 199 127 67 1 1 1 3 0 50 100 150 200 250 M n of € 2005 2010 R² = 0.2799 0 % 10 % 20 % 30 % 40 % 50 % 60 % 70 % 80 % 90 % 100 % 10,000 20,000 30,000 40,000 50,000 60,000 N on– do m es tic in ci de nc e
Gross domestic product at current prices per capita at NUTS 2 level (2010)
Schleswig–Holstein, Hamburg, Bremen, Lower Saxony
North Rhine–Westphalia Hesse, Rhineland–Palatinate, Saarland Baden–Württemberg Bav aria Thuringia, Saxony Brandenburg, Mecklenburg–Vorpommern, Saxony Anhalt -40% -20% 0% 20% 40% 60% 80% 0% 5% 10% 15% 20% 25% 30% 35% 40% P er ce nt ag e va ri at io n of n on –d om es tic pa ck s in ci de nc e (2 0 0 6–2011)
Non–domestic packs incidence (2006)
Berlin 0 50,000 2012 100,000 150,000 200,000 250,000 Ci ga re tte s (m n st ic ks )
Production Sales Import Export
0% 5% 10% 15% 20% 25% 2001 2002 2003 2004 2005 2006 2007 2008 2009 2010 2011 2012 Euromonitor Kpmg EPSs
21
Chapter 1: The Five Drivers
The factbook on the illicit trade in tobacco products
GERMANY
••
Germany is a multicultural society.•
Migration stock as percentage of the total population was 13.2% in 2010 (in 2005 it was 12.9%). The country ranked 53rd out of 213 countries (World Bank 2012).•
The most important immigration countries are Poland, Turkey, Russia, Romania, Serbia, Montenegro and Italy. Emigration occurs towards Poland, Turkey, Italy, Serbia and Montenegro, Romania and Greece (Destatis–Statistisches Bundesamt 2006).•
Families with migrant backgrounds are common inGermany. In 2010, 2.3 mn families with at least one parent with foreign roots and with children under 18 years old were resident in Germany. They represented 29% of the 8.1 mn families with minor children. This share has increased by 2% since 2005 (Galster and Haustein 2012).
•
Nearly a fifth of families with minor children and amigrant background are of Turkish origin. Families
who came to Germany from the former Soviet Union, among them mainly ethnic German repatriates, rank second with 16%, followed by families with roots in former Yugoslavia (9%). Southern European countries, where guest workers were recruited in the past (Portugal, Spain, Italy and Greece) account for 8% of migrant families (Galster and Haustein 2012).
••
Germany has marked regional inequalities.•
The poverty risk differs between the East and the West of Germany. In 2007, whilst in the new Länder(i.e. former East Germany, including Berlin) 19.5% of the population was at risk of poverty, the rate was markedly lower in West Germany (excluding Berlin) with 12.9%. Notably, in the Eastern Land of Mecklenburg–Vorpommern, 24.3% of the population was at risk of poverty, whilst in the Southern Land of Baden–Württemberg the percentage was only 10.0% (Mertel 2009).1
•
A regional comparison showed that people living incities and in the new Länder depended more heavily
on minimum social security benefits in 2006. With the highest receipt rate of 20.1%, every fifth Berlin inhabitant received benefits to secure basic livelihood. Baden–Württemberg and Bavaria reported the lowest rates, respectively 5.7% and 5.3% of the population (Haustein 2008).
In conclusion, Germany passed through the Global Financial Crisis rather undamaged in comparison with other European countries. Moreover, it has a strong welfare system. However, social differences persist between East and West Germany.
1.According to the European Union, the at–risk–of–poverty rate is defined as the share of persons having to make do with less.
23
The factbook on the illicit trade in tobacco products
GERMANY
T
he tobacco market is an important sector of the
German economy. Germany is the first exporter of
cigarettes in the world, and exports have grown
over the past decade. The tobacco industry employed
10,057 people in 2011. However, national sales have
fallen and consumers are shifting to cheaper products.
24 Legal Market
1.5%
135 out of 168 countries
(2010)
Market Size
Cigarette retail volume
(mn sticks)
Source: Euromonitor International
83,439
12 out of 209 countries
(2012)
122,124
1 out of 72 countries
(2012)
Balance of Trade
Cigarette exports–imports
(mn sticks)
Source: Euromonitor International
Price
Price of a pack of
the most sold brand
(Int.$, PPP)
Source: WHOInt.$, PPP 5.74
21 out of 166 countries
(2010)
Smokers
Current smoking of any tobacco
product (age–standardised rate)
Source: WHO–Country reports
29%
36 out of 147 countries
(2009)
Low High Large Small High Low Positive NegativeLast national available data (2012): Smokers (18+)
23%
(Deutsche Krankenversicherung 2012)Last available data (2012):
1.2%
(Euromonitor International 2012, International Monetary Fund 2012)Last available data (2012):
Int.$, PPP 6.32
(Euromonitor International 2012, International MonetaryFund 2012)
High %
Low %
Affordability
% of annual per capita income
needed to buy 100 packs of the
cheapest cigarettes
Source: Tobacco Atlas 91,683 88,218 86,58383,916 84,466 2007 2008 2009 2010 2011 0.29 0.30 mid-2000s late-2000s 85.8 86.0 86.2 86.3 86.4 86.5 86.6 2005 2006 2007 2008 2009 2010 2011 4.7 4.6 5.0 5.3 5.1 4.8 2005 2006 2007 2008 2009 2010 12.9 13.2 2005 2010 10.4 11.3 10.4 8.7 7.6 7.8 7.2 6.0 2004 2005 2006 2007 20082009 2010 2011 32 29 2006 2009 83,439 2012 122,124 126,292 148,354 135,404 136,315 138,640 2007 2008 2009 2010 2011 2012 5.55 5.74 2008 2010 75.8 74.1 2008 2010 80.3 80.6 2008 2010 7.9 8.0 7.9 8.0 79.0* 14 14 15 14 13 2008 2009 2010 2011 2012 Value Rank 1.05 0.98 0.92 0.88 0.86 0.84 2005 2006 2007 2008 2009 2010 0.20.9 0.20.8 4.8 4.8 2011 2012
Opioids Cocaine Cannabis
16.1 16.3 16.1 16.0 15.6 15.3 2002 2003 2004 2005 2006 2007 24.7 17.9 24.4 24.4 24.8 2004 2005 2006 2007 2008 2009 2010 299.0 300.7 303.2303.4 300.2 298.2 296.0 2004 2005 2006 2007 2008 2009 2010 2007 2008 2009 2010 2011 565,237 354,402 343,091 191,985 195,776 210.3 212.6
Tax % final retail price Tax per 1,000 sticks/Int.$, PPP
91,683 88,218 86,58383,916 84,466 2007 2008 2009 2010 2011 0.29 0.30 mid-2000s late-2000s 85.8 86.0 86.2 86.3 86.4 86.5 86.6 2005 2006 2007 2008 2009 2010 2011 4.7 4.6 5.0 5.3 5.1 4.8 2005 2006 2007 2008 2009 2010 12.9 13.2 2005 2010 10.4 11.3 10.4 8.7 7.6 7.8 7.2 6.0 2004 2005 2006 2007 20082009 2010 2011 32 29 2006 2009 83,439 2012 122,124 126,292 148,354 135,404 136,315 138,640 2007 2008 2009 2010 2011 2012 5.55 5.74 2008 2010 75.8 74.1 2008 2010 80.3 80.6 2008 2010 7.9 8.0 7.9 8.0 79.0* 14 14 15 14 13 2008 2009 2010 2011 2012 Value Rank 1.05 0.98 0.92 0.88 0.86 0.84 2005 2006 2007 2008 2009 2010 0.20.9 0.20.8 4.8 4.8 2011 2012
Opioids Cocaine Cannabis
16.1 16.3 16.1 16.0 15.6 15.3 2002 2003 2004 2005 2006 2007 24.7 17.9 24.4 24.4 24.8 2004 2005 2006 2007 2008 2009 2010 299.0 300.7 303.2303.4 300.2 298.2 296.0 2004 2005 2006 2007 2008 2009 2010 2007 2008 2009 2010 2011 565,237 354,402 343,091 191,985 195,776 210.3 212.6
Tax % final retail price Tax per 1,000 sticks/Int.$, PPP
25
Chapter 1: The Five Drivers
The factbook on the illicit trade in tobacco products
GERMANY
TOBACCO MARKET
••
Germany is the first world exporter of cigarettes.Indeed, the production of cigarettes has slightly increased in the past decade, even if national sales have fallen (Figure 5).
••
The value of the tobacco market in Germany.•
In 2012 the sales of tobacco products reached a value of €24.6 bn. In volume, the German market size was 83,439 mn sticks in the same year. The German market is one of the largest in the world (12th out of 209 countries) (Euromonitor International 2013).•
The German tobacco industry employed 10,057 people in 2011 (Deutscher Zigarettenverband 2012a).•
Germany is also a minor producer of tobacco. Indeed, the country held nearly 0.2% of the global plantations of tobacco in 2008. Two southern states(Rhineland–Palatinate and Baden–Württemberg) account for about three–quarters of the land under tobacco cultivation (Geist et al. 2009).
••
The German subsidiaries of the fourmultinationals, Philip Morris, Reemtsma (Imperial Tobacco), British American Tobacco, and Japan Tobacco International dominated the cigarette market.
•
Philip Morris is the market leader with a 37.5% volume share in 2012. Marlboro is the leading brand of cigarettes, even if its share declined from 2008 to 2012 owing to the price–sensitivity of consumers. In 2012, Marlboro’s market share was 21.7% (Euromonitor International 2013).•
Reemtsma (Imperial Tobacco), with a market share of nearly 25.8%, saw a slight erosion of its volume share from 2010 to 2011, after that its strong volume share increased in 2010 when it took over the distribution of the Gauloises and Gitanes brands. From 2011 to 2012, it kept constant. John Player Special is the second most popular cigarette brand after Marlboro, with a share of 9.8%. It increased its volume share between 2006 (4.4%) and 2012 (9.8%) (Euromonitor International 2013).•
British American Tobacco, with a market share of 18.3%, was the third company in 2012. The company’s key brands, Pall Mall and Lucky Strike, are seen as value–for–money brands and were among the leading cigarette brands in 2012 (Euromonitor International 2013).Figure 5. National production, sales, imports and exports of cigarettes
Source: Transcrime elaboration on Euromonitor International data
27 53 7 14 46 26 9 19 44 19 12 25 48 9 15 27 35 10 11 45 Social security General services Other expenditure Schools, institutions of higher education, other education Pensions Debt Science, research, cultural 55% 12% 11% 8% 5%5% 2% 1,340 1,360 1,380 1,400 1,420 1,440 1,460 1,480 1,500 1,520 1,540 99 00 01 02 03 04 05 06 07 08 09 10 11 B n 0% 20% 40% 60% 80% 100% 2003 2004 2005 2006 2007 2008 2009 2010 2011 HRT sales (cigarettes equivalent)/Total sales (cigarettes and HRT cigarettes equivalent)
HRT sales (cigarettes equivalent)/Cigarettes sales
16 34 38 37 34 34 34 33 27 22 15 11 7 12 27 26 23 24 26 27 24 19 14 9 5 3 0% 5% 10% 15% 20% 25% 30% 35% 40% 15 to 20 20 to 25 25 to 30 30 to 35 35 to 40 40 to 45 45 to 50 50 to 55 55 to 60 60 to 65 65 to 70 70 to 75 75 and Male Female 54 55 32 50 45 10 53 41 17 44 34 12 36 31 14 26 27 6 0% 10% 20% 30% 40% 50% 60% 18-39 40-59 60+ 18-39 40-59 60+ Male Female
Low-social status Mid-social status High-social status
50% 60% 70% 80% 90% 100% 93 94 95 96 97 98 99 00 01 02 03 04 05 06 07 08 09 10 11 12 as % of TIRSP (Tax Inclusive Retail Selling Price) as % of WAP (Weighted Average Price)
0 0.2 0.4 0.6 0.8 1 1.2 1.4 1.6 1.8 0.2 0.9 4.8 0.2 0.8 4.8 0% 1% 2% 3% 4% 5% 6%
Opioids Cocaine Cannabis
Drug report 2011 Drug report 2012
0% 5% 10% 15% 20% 25% 30% 35% 40% 45% 50% 1989 1993 1997 2001 2004 2008 2010 2011 Aged 12-17 Aged 18-25 0 200 400 600 800 1,000 1,200 98 99 00 01 02 03 04 05 06 07 08 09 10 11 Ci ga re tte s (m n st ic ks ) 24 25 9 38 31 5 27 37 34 10 19 42 16 27 6 51 20 25 8 47 26 23 9 42 26 20 8 49 0% 10% 20% 30% 40% 50% 60% 70% 80% 90% 100% 2006 2007 2008 2009 2010 2011 2012 0% 5% 10% 15% 20% 25% 30% Q1 2010 Q2 2012 Q3 2010 Q4 2010 Q1 2011 Q2 2011 Q3 2011 Q4 2011 Q1 2012 Q2 2012 Q3 2012 Counterfeit Marlboro over total non-domestic Marlboro packs Counterfeit L&M over total non-domestic L&M packs
0% 10% 20% 30% 40% 50% 60% 2005 2006 2007 2008 2009 2010 2011
Western Länder Germany Eastern Länder
0.4 0.5 0.3 1.6 2.7 0.6 0.0% 0.5% 1.0% 1.5% 2.0% 2.5% 3.0%
Both sexes Male Female
Aged 12-17 Aged 18-25 21 36 4 11 14 20 61 33 0% 20% 40% 60% 80% 100% 2006 2007 2008 2009 2010 2011 2012
Poland Czech Republic Russia Other countries
Poland Czech Republic Spain Other countries
54% 52 22 47 40 14 47 41 17 39 36 10 46 34 15 35 31 15 0% 10% 20% 30% 40% 50 60% 18-39 40-59 60+ 18-39 40-59 60+ Male Female
Low-income Mid-income High-income
182 86 52 22 10 3 3 199 127 67 1 1 1 3 0 50 100 150 200 250 M n of € 2005 2010 R² = 0.2799 0 % 10 % 20 % 30 % 40 % 50 % 60 % 70 % 80 % 90 % 100 % 10,000 20,000 30,000 40,000 50,000 60,000 N on– do m es tic in ci de nc e
Gross domestic product at current prices per capita at NUTS 2 level (2010)
Schleswig–Holstein, Hamburg, Bremen, Lower Saxony
North Rhine–Westphalia Hesse, Rhineland–Palatinate, Saarland Baden–Württemberg Bav aria Thuringia, Saxony Brandenburg, Mecklenburg–Vorpommern, Saxony Anhalt -40% -20% 0% 20% 40% 60% 80% 0% 5% 10% 15% 20% 25% 30% 35% 40% P er ce nt ag e va ri at io n of n on –d om es tic pa ck s in ci de nc e (2 0 0 6–2011)
Non–domestic packs incidence (2006)
Berlin 0 50,000 2012 100,000 150,000 200,000 250,000 Ci ga re tte s (m n st ic ks )
Production Sales Import Export
0% 5% 10% 15% 20% 25% 2001 2002 2003 2004 2005 2006 2007 2008 2009 2010 2011 2012 Euromonitor Kpmg EPSs