2016
Publication Year
2020-05-04T13:55:11Z
Acceptance in OA@INAF
A 78 Day X-Ray Period Detected from NGC 5907 ULX1 by Swift
Title
Walton, D. J.; Fürst, F.; BACHETTI, Matteo; Barret, D.; Brightman, M.; et al.
Authors
10.3847/2041-8205/827/1/L13
DOI
http://hdl.handle.net/20.500.12386/24440
Handle
THE ASTROPHYSICAL JOURNAL
Journal
827
A 78 DAY X-RAY PERIOD DETECTED FROM NGC 5907 ULX1 BY SWIFT
D. J. Walton1,2, F. Fürst2, M. Bachetti3, D. Barret4,5, M. Brightman2, A. C. Fabian6, N. Gehrels7, F. A. Harrison2, M. Heida2, M. J. Middleton6, V. Rana2, T. P. Roberts8, D. Stern1, L. Tao2,9, and N. Webb4,5
1
Jet Propulsion Laboratory, California Institute of Technology, Pasadena, CA 91109, USA
2
Space Radiation Laboratory, California Institute of Technology, Pasadena, CA 91125, USA
3INAF/Osservatorio Astronomico di Cagliari, via della Scienza 5, I-09047 Selargius (CA), Italy 4
Universite de Toulouse, UPS-OMP, IRAP, Toulouse, France
5
CNRS, IRAP, 9 Av. colonel Roche, BP 44346, F-31028 Toulouse cedex 4, France
6
Institute of Astronomy, University of Cambridge, Madingley Road, Cambridge CB3 0HA, UK
7
NASA Goddard Space Flight Center, Greenbelt, MD 20771, USA
8
Centre for Extragalactic Astronomy, Department of Physics, Durham University, South Road, Durham DH1 3LE, UK
9
Center for Astrophysics, Tsinghua University, Beijing 100084, China
Received 2016 June 27; revised 2016 July 20; accepted 2016 July 22; published 2016 August 5 ABSTRACT
We report the detection of a 78.1±0.5 day period in the X-ray light curve of the extreme ultraluminous X-ray source NGC 5907 ULX1(LX,peak~5 ´1040erg s−1), discovered during an extensive monitoring program with Swift. These periodic variations are strong, with the observedflux changing by a factor of ∼3–4 between the peaks and the troughs of the cycle; our simulations suggest that the observed periodicity is detected comfortably in excess of 3σ significance. We discuss possible origins for this X-ray period, but conclude that at the current time we cannot robustly distinguish between orbital and super-orbital variations.
Key words: black hole physics – X-rays: binaries – X-rays: individual (NGC 5907 ULX1)
1. INTRODUCTION
NGC 5907 ULX1 is a remarkable member of the ultra-luminous X-ray source (ULX) population. At a distance of ∼13.4 Mpc, it exhibits an extreme peak X-ray luminosity of ∼5 ´ 1040 erg s−1(Walton et al. 2011; Sutton et al. 2013a). Its
hard X-ray spectrum below 10 keV had previously led to speculation that it might host an intermediate-mass black hole accreting in the low/hard state, similar to what is seen in Galactic black hole binaries at low luminosities (Sutton et al. 2012; see Remillard & McClintock 2006 for a review of accretion states in Galactic binaries). Our recent coordinated observations with the NuSTAR and XMM-Newton observatories have subsequently revealed a broadband X-ray spectrum inconsistent with this identification (Walton et al. 2015a),
similar to the other ULX systems observed by NuSTAR to date (Bachetti et al. 2013; Walton et al. 2014, 2015b; Mukherjee et al.2015; Rana et al.2015). Instead, the broadband spectrum
implies instead that NGC 5907 ULX1 is likely a system accreting at high- or even super-Eddington rates, as suggested by Sutton et al.(2013a).
The most remarkable aspect of these NuSTAR and XMM-Newton observations, however, is the fact that we witnessed a rise influx of ∼2 orders of magnitude or more in the mere four days between our two observing epochs. NGC 5907 ULX1 was essentially undetected in ourfirst observation, with an implied luminosity of LX ´2 1038erg s−1, before the source returned to a more typical brightness of LX~1040 erg s−1in our second (Walton et al.2015a). This event prompted us to
begin a monitoring campaign with the Swift observatory (Gehrels et al. 2004) in order to investigate whether this
behavior was a common occurrence. Although these observa-tions have not revealed such extreme variaobserva-tions again, here we report on the detection of an ∼80 day periodicity in the Swift light curve.
2. SWIFT MONITORING
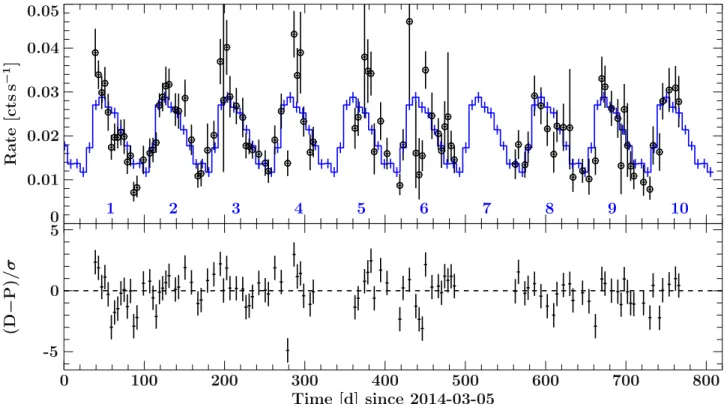
We began monitoring NGC 5907 ULX1 with Swift on 2014 April 14, observing every two days for an initial period of two months. This cadence was motivated by the timescale of the variability observed between thefirst two NuSTAR epochs. We then transitioned to a longer-term monitoring program observing the source roughly every week. Aside from a few moderately brief gaps in the coverage, this program has continued up until the time of writing(2016 April, a duration of ∼700 days), with an average exposure per observation of∼2 ks. Figure 1shows the long-term light curve obtained with the XRT (Burrows et al. 2005) from these observations with the standard Swift
processing pipeline(Evans et al.2009). A strong periodicity on
the order of∼80 days is visibly present, with the observed count rate varying by a factor of∼3–4 from peak to trough. The troughs correspond to an observed X-ray luminosity of∼1040erg s−1.
To search for periodicities in the data, we used the epoch-folding approach, as it is independent of the sampling of the data(Leahy1987). We tested 920 trial periods between 30 and
140 days on a linearly sampled grid. The period range is set by our requirement that each cycle be covered by at least four observations during the lower-cadence portion of our program, and that the duration of our monitoring program would cover at least five cycles (see Vaughan et al. 2016). To evaluate the
likelihood that at any given period the folded profile deviates significantly from the null hypothesis of a flat profile, we used the L-statistic as described by Davies(1990). The L-statistic is
advantageous over standard c2-statistics for small sample sizes,
as it takes the number of data points in the light curve and in each phase bin of the folded profile into account. At each trial period, the light curve was folded into 10 phase-bins, ensuring that each bin was averaged over at least five data points. The results of this search are shown in Figure2; a strong peak in
L-stat is seen at a period of 78.1 days. For reference, the minimum of the cycle is observed at MJD 56663.0.
In addition to the XRT light curve, Figure 1 also shows an overlay of the average profile for the cycle, which broadly appears to resemble a fast rise, exponential decay (FRED) profile (the rise time in the average profile is ∼30% of the cycle duration, and the decay time ∼50%). This matches the data well throughout the entire monitoring campaign to date
(Figure 1, bottom panel), but particularly so toward the beginning and the end. There appears to be a visual indication that the period may have drifted slightly during the central portion of our program(for example, the peak of the fifth cycle observed at ∼380 days appears to be slightly late). Indeed, if we re-run the period search excluding this central portion, the significance of the period increases slightly (peak L-stat increases from L=11.3 to 15.0).
Figure 1. Swift XRT light curve of NGC 5907 ULX1 obtained with our monitoring campaign, shown with four-day bins (top panel). A strong 78.1±0.5 day period is visibly present. In addition to the XRT data, we overlay the average cycle profile in blue and label the individual cycles covered by the duration of our program. We also show the agreement between the data and the average cycle profile, evaluated as the sn deviation between the data(D) and the cycle prediction (P; bottom panel). The agreement is generally very good.
Figure 2. Results from our period search, using epoch-folding to test for periods in the range 30–140 days (see Section2). The thick, red curve shows the L-stat curve
for the real data; a clear, strong peak is seen at∼80 days. The dashed horizontal line shows the 99.9% detection level according to the F-test outlined in Davies (1990).
However, such tests often underpredict the detection significance, so to rigorously test the statistical significance of this period we performed a series of red-noise simulations(see Section3). The gray points show the peak L-stat for each of the 10,000 simulations run. None of these reach the level of the improvement seen in the
real data.
3. SIGNIFICANCE SIMULATIONS
To assess the significance of the apparent periodicity, we simulate a set of 10,000 light curves with a red-noise power spectrum, typical of accreting black holes (e.g., Vaughan et al. 2003), following the method of Timmer & Koenig
(1995). More precisely, we assume the power spectrum follows
a simple power law with a slope of a = 2.0. These light curves were initially simulated with a time resolution of 2 ks, and a total continuous duration ∼20 times longer than the real Swift light curve, to account for red-noise leakage on the timescales of interest. From each of these initial light curves we selected a random segment matching the duration of the Swift monitoring and drew data from this segment with a cadence that broadly matched the real observations(“observation” times were randomized by±1 day in comparison to the real light curve to mimic the randomness of a realistic observing process). The resulting light curves were then normalized to match the average count rate and variance observed in the real data; counting statistics were adopted for the statistical uncertainties on each bin in thefinal simulated light curves.
We then applied the same analysis as described above to each of these simulated data sets in order to assess the chance probability of aperiodic red-noise variability artificially produ-cing an apparent periodicity similar to that observed. By taking this approach, the number of periods tested with the real data is fully accounted for in our estimation of the detection significance. Out of the 10,000 simulations run, none resulted in the apparent detection of a periodicity on any of the timescales considered equal to or greater than that observed in the real data (considering the full light curve, i.e., L=11.3). Figure2also shows the maximum L-stat obtained for each of the 10,000 simulated data sets, which are all below that seen in the real data. In order to test for any dependence on the assumed form of the power spectrum (as discussed by, e.g., Vaughan et al. 2016 for the case of quasar light curves), we also performed additional sets of simulations varying α by±0.5 and obtained identical results in both cases. We therefore conclude that the significance of the detection is comfortably in excess of the 3σ level.
4. PERIOD STABILITY
To estimate the uncertainty of the measured period, we perform a second set of 1000 simulations, using a similar approach to that outlined above. Here, we assume that the variability is dominated by the best-fit period following the method outlined by Larsson(1996). The same period search is
again applied, and the uncertainty determined from the distribution of the periods obtained. Wefind that the variations observed have a period of 78.1±0.5 days (1σ error). In addition, we compile the distribution of the widths (formally the FWHM) of the peak in the L-stat curves for each of these simulated data sets in order to assess the stability of the period following the visual indication that it may have drifted slightly during the central portion of our campaign. The FWHM of the peak in the real data is 5.8 days, and the expected FWHM from the simulations assuming a stable period is 5.0±0.6 days. Despite this visual indication, the current data are fully consistent with a stable period.
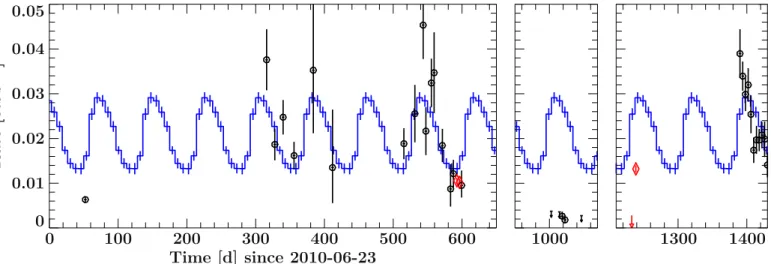
As a further test of its stability, we also extrapolate the detected period back to some of the archival X-ray observations of NGC 5907 ULX1. XMM-Newton and Chandra both performed observations in early 2012 (see Sutton et al.2013a), Swift performed a series of snapshots throughout
2010–2013 prior to the commencement of our more sustained program, and, as discussed above, XMM-Newton and NuSTAR also performed two coordinated observations in late 2013(see Walton et al.2015a). The extrapolation to these observations is
shown in Figure 3. Although the sampling is sparse, the periodic behavior reported here extends to the observations taken across 2010–2012, adding further support to the stability of the period. However, the extrapolation does not match the 2013 data well, owing to the extreme low-flux states seen during this period. In particular, the first XMM-Newton+-NuSTAR observation resulted in a non-detection of NGC 5907 ULX1, with an upper limit placing the flux of the source at least a factor of∼50 below any of the cycle troughs shown in Figure1(Walton et al.2015a). This low-flux behavior does not
simply appear to be an extreme manifestation of the period cycle, as the XMM-Newton+NuSTAR observations should have occurred close to a cycle peak. Furthermore, the series of Swift observations taken earlier in 2013 spanned a period of ∼6 Figure 3. Best-fit cycle profile extrapolated back to the archival X-ray data obtained in 2010–2012 (left panel), early 2013 (center panel), and late 2013 (right panel). Swift observations are shown in black, and XMM-Newton observations in red. The periodic behavior extrapolates reasonably well to the 2010–2012 data, but cannot match the 2013 XMM-Newton data owing to a period of extreme lowflux seen during this time (Walton et al.2015a), which appears to require a second variability
weeks, and also found a systematically low flux, ∼10 times lower than these cycle minima. Rather, it appears that a further variability mechanism may have caused an extended period of low flux during much of 2013, and the second XMM-Newton+NuSTAR observation in late 2013, in which the source is well detected, caught the source on its return to its high-flux state, in which the source is bright enough that we can detect this periodic behavior.
For completeness, we note that in addition to these archival data, XMM-Newton also observed NGC 5907 in 2003(Walton et al.2011; Sutton et al.2013a). However, while the parameters
for the period are relatively well constrained, their statistical uncertainties are still sufficiently large to prevent a meaningful extrapolation all the way back to these XMM-Newton observations.
5. POTENTIAL DIPPING BEHAVIOR
There is also a hint that NGC 5907 ULX1 may exhibit brief dips in its observed intensity, imprinted on top of the periodic variability. The clearest example is at day ∼280 in Figure 1, where theflux is well constrained and significantly lower than both the prediction from the average cycle profile and also than each of the neighboringflux measurements. Another potential dip also appears to be seen two cycles later (at day ∼440). Should these dips be real (rather than just random variability), this behavior could be contributing to the visual indication that the peak of thefifth cycle arrives slightly late. There is a gap in our coverage during the rise of this cycle, and should the coverage re-commence during one of these dips, this would give the appearance that the peak is delayed. We note that should this be the case, the dip would have occurred at the same phase as those seen in the cycles immediately preceding and following this one.
6. DISCUSSION AND CONCLUSIONS
We have reported the detection of a 78.1±0.5 day X-ray periodicity in the extreme ULX NGC 5907 ULX1 (LX,peak~5´1040erg s−1) with Swift. The variation on this timescale is very strong, with the observed XRT count rate varying by a factor of ∼3–4 (peak to trough; Figure 1). Our
simulationsfind that this periodicity is significant, comfortably in excess of the 3σ level. When bright (LX ´1040erg s−1), NGC 5907 ULX1 dominates the X-ray emission from NGC 5907, so the risk of source confusion is negligible.
Long-timescale periodicities have been observed from several other well-studied ULXs. The∼62 day period observed from the M82 field is well established, generally assumed to arise from M82 X-1 (Kaaret & Feng 2007; Pasham & Strohmayer 2013a; although this origin has recently been questioned; Qiu et al.2015), and a ∼115 day period has been
claimed from NGC 5408 X-1 (Pasham & Strohmayer 2013b; although see Grisé et al. 2013). Perhaps most famously, the
most luminous ULX known to date, ESO 243-49 HLX-1, is seen to outburst every∼380 days (Godet et al.2014; although recently this behavior has appeared more erratic; Yan et al. 2015). The timescale of the periodicity reported here is
comparable to several of these other cases.
The key question regarding the nature of the observed periodicity is whether it could be related to the orbital period of the system, as suggested by Godet et al.(2014) for ESO 243-49
HLX-1, or perhaps some super-orbital period, as suggested by
Pasham & Strohmayer (2013a) for M82 following the likely
detection of a sudden phase shift in the cycle. Orbital periods can be imprinted on the observed light curves from X-ray binaries through (at least partial) eclipses by the companion star, or through some Be/X-ray binary-like phenomenon, in which the binary orbit is eccentric and the accretion rate is enhanced around periastron. We note, however, that the FRED-like cycle profile observed here does not bear much similarity to the majority of the orbital profiles compiled by Falanga et al. (2015) for eclipsing X-ray binaries. The light curve observed
here also does not show a series of quiescence–outburst– quiescence cycles, as traditionally seen from Be/X-ray binaries (Reig 2011), and also from ESO 243-49 HLX-1, so any
analogy here is limited. However, it may be possible for an elliptical orbit to result in more moderate accretion rate variations via changes in the degree of Roche-lobe overflow as the distance between the compact object and its stellar companion varies (e.g., Church et al. 2009). Alternatively, if
NGC 5907 ULX1 is a wind-fed X-ray binary, the accretor could enter a higher-density region of the stellar wind, resulting in an enhanced accretion rate, similar to the case of GX 301−2 (Fürst et al. 2011). However, sustaining the extreme
luminos-ities observed from NGC 5907 ULX1 would be a major challenge for a wind-fed scenario.
Super-orbital X-ray periods are seen in many well-monitored Galactic X-ray binaries, e.g., Cygnus X-1, Hercules X-1, SS433, etc. (Rico 2008; Cherepashchuk et al. 2013; Staubert et al.2013and references therein), and are typically assumed to be related to precession of the accretionflow analogous to that seen in SS433, for which this interpretation is well established (Fabrika2004). However, super-orbital periods have also now
been seen in wind-fed high-mass X-ray binaries, for which such a scenario is unlikely to be viable(Corbet & Krimm2013),
and other, more exotic mechanisms such as triple systems have been proposed in some cases(see Kotze & Charles2012for a recent review of super-orbital variability in X-ray binaries).
It is difficult to distinguish between these scenarios based on the observed timescale. Several authors have suggested that even if ULXs host standard stellar remnant black holes(MBH∼
10M), some may have very long orbital periods (up to ∼100
days or more) if they accrete from evolved stellar companions via Roche-lobe overflow (e.g., Madhusudhan et al. 2008).
Currently, we have no independent observational constraints on the nature of the stellar companion in NGC 5907 ULX1 owing to both its distance and the obscuring column toward this source (NH~1022cm−2; the host galaxy NGC 5907 is seen edge-on). However, Heida et al. (2014, 2015) have recently
reported a number of ULXs with candidate red supergiant companions, demonstrating that some of the ULX population likely do have evolved counterparts. Indeed, if we assume Roche-lobe overflow and that the period is orbital, we can estimate a density for the stellar counterpart of r ~3 ´10-5
g cm−3(Faulkner et al.1972), implying the counterpart may be
either an M giant or an F supergiant(Drilling & Landolt2000).
Furthermore, the ULX P13 in NGC 7793 has an orbital period of ∼64 days (Motch et al.2014), so a ∼80 day orbital period
may be a plausible scenario for NGC 5907 ULX1. Similarly, super-orbital periods have been observed across a very wide range of timescales in Galactic systems, at least from 3 to 300 days(Kotze & Charles2012), fully consistent with the period
observed here. Should this be the correct interpretation, this The Astrophysical Journal Letters,827:L13(6pp), 2016 August 10 Walton et al.
would obviously imply a significantly shorter orbital period for this system.
In addition to the flux variations observed, we also investigated briefly whether there is any evolution in the hardness ratio between the 0.3–2 and 2–10 keV energy bands with phase that might indicate spectral changes across the observed cycle. We did not find any strong evidence for such variations, indicating that either the spectrum is not system-atically varying across the cycle, or that the spectral changes are subtle enough that they are not well probed by a simple hardness ratio. A detailed multi-epoch spectral analysis of the high signal-to-noise ratio data available for NGC 5907 ULX1 will be presented in a follow-up paper(F. Fuerst et al. 2016, in preparation). Ultimately, we conclude that despite some of the orbital scenarios seeming unlikely, the question regarding the nature of this periodicity currently remains open.
Finally, should NGC 5907 ULX1 be exhibiting dipping behavior in addition to its periodic variability, this would be of particular interest. X-ray dips have only been reported from a handful of other ULXs to date, notably NGC 55 ULX(Stobbart et al. 2004), NGC 5408 X-1 (Grisé et al. 2013; Pasham & Strohmayer2013b), a source in M72 (Lin et al.2013), and an
ultrasoft source in M51(Urquhart & Soria2016). Analogy with
the dipping phenomenon seen in Galactic X-ray binaries would imply we are viewing NGC 5907 ULX1 at a high inclination (e.g., Díaz Trigo et al.2006). This would naively appear to be
at odds with the expectation from the inclination-based framework proposed to explain ULXs with soft and hard spectra(as observed below 10 keV) within a super-Eddington framework, discussed in Sutton et al. (2013b) and Middleton
et al.(2015). This assumes the accretion flow has a large scale
height, as expected for super-Eddington accretion (e.g., Poutanen et al. 2007), resulting in an inclination dependence
for the observed X-ray spectrum. ULXs with soft spectra (as seen from NGC 55 ULX, NGC 5408 X-1, and the M51 source) are viewed at high inclination, such that the lower-temperature regions of the outer accretion flow dominate the observed emission and the hotter regions of the innerflow are obscured. ULXs with hard spectra are viewed more face-on, with the hotter regions being visible. NGC 5907 ULX1 has a hard spectrum (classified as a “hard ultraluminous state” by Sutton et al.2013b), and so would be expected to be viewed at a low
inclination. However, it may still be possible to reconcile dipping and a hard spectrum within this framework if our viewing angle lies close to the opening angle of the accretion flow, such that we are viewing the innermost regions through the uppermost atmosphere of the outer regions, which super-Eddington simulations predict to be dominated by a clumpy outflow (Takeuchi et al. 2013). If NGC 5907 ULX1 is a
standard∼10M stellar remnant, its extreme luminosity would
suggest the opening funnel for the accretionflow would likely be quite narrow, and so the wind could well be close to our line of sight.
Continued monitoring of this remarkable source will test the stability of this period over a longer baseline, helping to distinguish between orbital and super-orbital scenarios, and may identify additional potential dips for further investigation. The authors would like to thank the reviewer for their timely and positive feedback, which helped to improve the final manuscript. A.C.F. acknowledges support from ERC Advanced Grant 340442. The work of D.J.W./D.S. was
performed at JPL/Caltech, under contract with NASA. D.B. and N.W. acknowledge financial support from the French Space Agency(CNES), M.J.M. acknowledges support from an Ernest Rutherford STFC fellowship, and T.P.R. acknowledges support from the STFC consolidated grant ST/L00075X/1. This work made use of data supplied by the UK Swift Science Data Centre at the University of Leicester, and also made use of the XRT Data Analysis Software(XRTDAS) developed under the responsibility of the ASI Science Data Center (ASDC), Italy. We acknowledge the use of public data from the Swift data archive. This research has also made use of a collection of ISIS functions (ISISscripts) provided by ECAP/Remeis observatory and MIT.10
Facility: Swift.
REFERENCES
Bachetti, M., Rana, V., Walton, D. J., et al. 2013,ApJ,778, 163
Burrows, D. N., Hill, J. E., Nousek, J. A., et al. 2005, SSRv,120, 165
Cherepashchuk, A. M., Sunyaev, R. A., Molkov, S. V., et al. 2013,MNRAS,
436, 2004
Church, R. P., Dischler, J., Davies, M. B., et al. 2009,MNRAS,395, 1127
Corbet, R. H. D., & Krimm, H. A. 2013,ApJ,778, 45
Davies, S. R. 1990, MNRAS,244, 93
Díaz Trigo, M., Parmar, A. N., Boirin, L., Méndez, M., & Kaastra, J. S. 2006,
A&A,445, 179
Drilling, J. S., & Landolt, A. U. 2000, in Astrophysical Quantities, ed. A. N. Cox(4th ed.; New York: Springer), 381
Evans, P. A., Beardmore, A. P., Page, K. L., et al. 2009,MNRAS,397, 1177
Fabrika, S. 2004, ASPRv,12, 1
Falanga, M., Bozzo, E., Lutovinov, A., et al. 2015,A&A,577, A130
Faulkner, J., Flannery, B. P., & Warner, B. 1972,ApJL,175, L79
Fürst, F., Suchy, S., Kreykenbohm, I., et al. 2011,A&A,535, A9
Gehrels, N., Chincarini, G., Giommi, P., et al. 2004,ApJ,611, 1005
Godet, O., Lombardi, J. C., Antonini, F., et al. 2014,ApJ,793, 105
Grisé, F., Kaaret, P., Corbel, S., Cseh, D., & Feng, H. 2013, MNRAS,
433, 1023
Heida, M., Jonker, P. G., Torres, M. A. P., et al. 2014,MNRAS,442, 1054
Heida, M., Torres, M. A. P., Jonker, P. G., et al. 2015,MNRAS,453, 3511
Kaaret, P., & Feng, H. 2007,ApJ,669, 106
Kotze, M. M., & Charles, P. A. 2012,MNRAS,420, 1575
Larsson, S. 1996, A&AS,117, 197
Leahy, D. A. 1987, A&A,180, 275
Lin, D., Irwin, J. A., Webb, N. A., Barret, D., & Remillard, R. A. 2013,ApJ,
779, 149
Madhusudhan, N., Rappaport, S., Podsiadlowski, P., & Nelson, L. 2008,ApJ,
688, 1235
Middleton, M. J., Heil, L., Pintore, F., Walton, D. J., & Roberts, T. P. 2015,
MNRAS,447, 3243
Motch, C., Pakull, M. W., Soria, R., Grisé, F., & Pietrzyński, G. 2014,Natur,
514, 198
Mukherjee, E. S., Walton, D. J., Bachetti, M., et al. 2015,ApJ,808, 64
Pasham, D. R., & Strohmayer, T. E. 2013a,ApJL,774, L16
Pasham, D. R., & Strohmayer, T. E. 2013b,ApJ,764, 93
Poutanen, J., Lipunova, G., Fabrika, S., Butkevich, A. G., & Abolmasov, P. 2007,MNRAS,377, 1187
Qiu, Y., Liu, J., Guo, J., & Wang, J. 2015,ApJL,809, L28
Rana, V., Harrison, F. A., Bachetti, M., et al. 2015,ApJ,799, 121
Reig, P. 2011,Ap&SS,332, 1
Remillard, R. A., & McClintock, J. E. 2006,ARA&A,44, 49
Rico, J. 2008,ApJL,683, L55
Staubert, R., Klochkov, D., Vasco, D., et al. 2013,A&A,550, A110
Stobbart, A.-M., Roberts, T. P., & Warwick, R. S. 2004, MNRAS,
351, 1063
Sutton, A. D., Roberts, T. P., Gladstone, J. C., et al. 2013a, MNRAS,
434, 1702
Sutton, A. D., Roberts, T. P., & Middleton, M. J. 2013b, MNRAS,
435, 1758
Sutton, A. D., Roberts, T. P., Walton, D. J., Gladstone, J. C., & Scott, A. E. 2012,MNRAS,423, 1154
10
Takeuchi, S., Ohsuga, K., & Mineshige, S. 2013,PASJ,65, 88
Timmer, J., & Koenig, M. 1995, A&A,300, 707
Urquhart, R., & Soria, R. 2016,MNRAS,456, 1859
Vaughan, S., Fabian, A. C., & Nandra, K. 2003,MNRAS,339, 1237
Vaughan, S., Uttley, P., Markowitz, A. G., et al. 2016,MNRAS,461, 3145
Walton, D. J., Harrison, F. A., Bachetti, M., et al. 2015a,ApJ,799, 122
Walton, D. J., Harrison, F. A., Grefenstette, B. W., et al. 2014,ApJ,793, 21
Walton, D. J., Middleton, M. J., Rana, V., et al. 2015b,ApJ,806, 65
Walton, D. J., Roberts, T. P., Mateos, S., & Heard, V. 2011,MNRAS,416, 1844
Yan, Z., Zhang, W., Soria, R., Altamirano, D., & Yu, W. 2015,ApJ,811, 23