University of Pisa
Department of Economics and Management
Sant’Anna School of Advanced Studies
Master of Science in Economics Master’s Thesis
Network Flow Techniques:
An application to Integrated Energy
Systems
Supervisor: Riccardo Cambini Candidate: Loredana Fattorini Academic Year 2013/2014”I have no special talents. I am only passionately curious”. Albert Einstein
Abstract
Energy has become one of the most crucial problem in modern society and for this reason it must be investigated, analyzed and solved.
The main goal of this thesis is to look at the economics of energy by analyzing the relationship between the availability of energy resources and economic activity in a network context. The idea is to provide an efficient distribution of energy resources.
The methodology that has been used is that of Network Flow Optimiza-tion. A particular attention has been given to a Multi period Generalized Network Flow model proposed in literature, in order to solve Integrated En-ergy Systems problems.
Acknowledgements
I would like to express my sincere appreciation to Professor Riccardo Cambini for his supervision, for his positive attitude and for his confidence in me.
Furthermore, I would like to express my deep gratitude to my parents, Mauro and Maria, for being present in every moments of my life, for all the sacrifices they have made to support me and for teaching me the good values of life.
Moreover, I would like to thanks Alban, my sweetheart, for encouraging me to always have the best from life and for supporting me in every moments. A special thanks goes to my close friends, in particular to my dearest Giulia and Daniela, that have shared with me difficulties and satisfactions.
Finally, I wish to thank all the people who have been present during these years at University.
Contents
Introduction 1
Chapter 1 6
1.1 Historical background . . . 6
1.2 Energy and Economy relationship . . . 11
1.3 Urban metabolism . . . 18
Chapter 2 24 2.1 Urban Energy Systems . . . 24
2.2 Distributed Energy System (DES) . . . 27
2.3 Integrated Energy System . . . 35
2.4 Measures to reduce energy inefficiency in Europe . . . 37
Chapter 3 42 3.1 Introduction . . . 42
3.2 Preliminaries . . . 44
3.2.1 Graph and flows . . . 45
3.2.2 Paths and Cycles . . . 47
3.2.3 Path Flows and Conformal Decomposition. . . 50
3.3 Network flow techniques . . . 51
3.3.1 The Shortest Path Problem. SPP . . . 51
3.3.2 The Maximum Flow Problem . . . 57
3.3.3 The Minimum Cost Flow Problem . . . 66 3.3.4 Variation and extension of network flow problems . . . 74
Chapter 4 78
4.1 Application of Network Flow techniques to the Energy System 78 4.2 Top-Down and Bottom-Up Approaches . . . 82 4.3 Models description . . . 86
4.3.1 Multi period generalized network flow model of an In-tegrated Energy System . . . 86 4.3.2 Analysis of an Integrated Thermal Power System . . . 101 4.3.3 Stochastic fuel costs in a generalized network flow model
of Integrated Energy Systems . . . 105 4.4 Stochastic model and deterministic model . . . 117
Conclusion 118
APPENDIX 119
A Two-Stage Stochastic Programming 120
List of Figures
1 Complete Energy System . . . 3
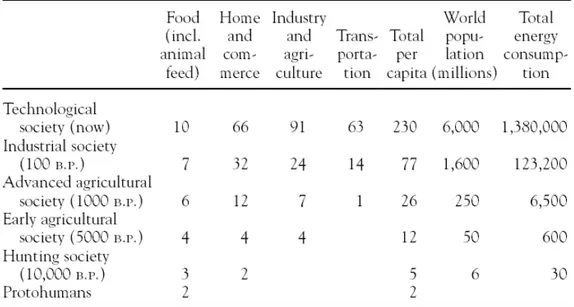
1.2 Average daily per capita energy consumption in di↵erent his-torical eras. . . 7
1.3 Energy consumption per capita in di↵erent eras. . . 8
1.4 U.S. gross domestic product (GDP) and total primary energy use. . . 12
1.5 Energy GDP causality tests USA 1947-1990. . . 15
1.6 Cointegration modela. . . 17
1.7 Chronological review of Urban Metabolism studies . . . 20
1.8 Comparison of the main urban metabolism simulation methods. 23 2.9 Centralized Energy System . . . 27
2.10 Decentralized Energy System . . . 28
2.11 Distributed Energy System . . . 29
2.12 Summary of benefits and drawbacks of DES. . . 33
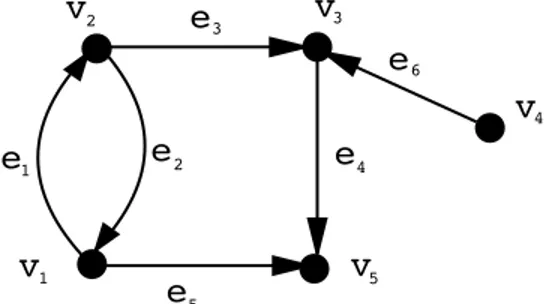
3.13 Example of directed graph . . . 46
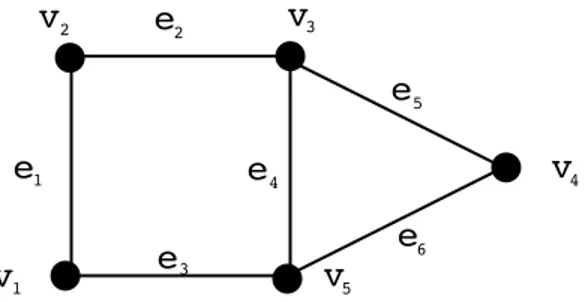
3.14 Example of undirected graph . . . 47
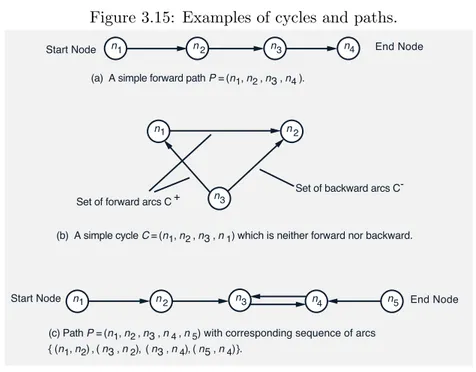
3.15 Examples of cycles and paths. . . 49
3.16 Generalized Network example . . . 75
4.17 Characteristics of Top-Down and Bottom-Up Models . . . 85
4.18 node arc incidence matrix example . . . 88
4.19 Two regions system example . . . 93
4.20 Unit Characteristics . . . 94
4.21 Fuel Characteristics . . . 94
4.22 Results of the optimization problem . . . 96
4.23 Nodal prices results . . . 96
4.24 Complete procedure . . . 98
4.25 Summary of the results . . . 100
4.26 India Thermal Power System Model . . . 101
4.27 Unit characteristics . . . 102
4.28 India thermal generation and load for 2010 . . . 102
4.29 Fuel characteristics . . . 103
4.30 Tie line and storage capacities . . . 103
4.31 Results . . . 104
4.32 Rolling two-stage approach: first period . . . 110
4.33 Rolling two-stage approach: second period . . . 110
4.34 Rolling two-stage approach: third period . . . 111
4.35 Rolling two-stage approach: fourth period . . . 111
4.36 Rolling two-stage approach: Complete procedure . . . 112
4.37 Numerical example: Energy system . . . 113
4.38 Comparison solution approaches . . . 115
Nomenclature
i, j, k, s, u, v : Nodes
cij(l,t): Per unit cost of the energy flowing from node i to node j,
corre-sponding to the l-th linearization segment, during time t.
bj: Supply (if positive) or negative of the demand (if negative) at node j,
during time t.
eij.max: Upper bound on the energy flowing from node i to node j.
eij.min: Lower bound on the energy flowing from node i to node j.
eij: Energy flowing from node i to node j, corresponding to the l-th
lin-earization segment, during time t.
M or E: Set of arcs.
N or V: Set of nodes.
T: Set of time periods.
Lij: Set of linearization segments on the energy flowing from node i to node j.
⌘ij(l ): Efficiency parameter associated with the arc connecting node i to
node j, in the loth linearization segment.
SO2i(t): Sulphur dioxide emissions rate associated with the fuel consumed
by power plant i, during time t.
↵i: Removal efficiency of the pollution control equipment installed at power
plant i. If no pollution equipment exists at power plant i, then ↵i=0.
NSO2: U.S. national SO2 limit.
uij: Upper bound on the energy flowing from node i to node j, during period t.
lij: Lower bound on the energy flowing from node i to node j, during period t.
rij(t): Efficient parameter associated with the arc from node i to node j,
in period t.
cf: Residual capacity.
w : Weight function.
Introduction
”Take the money out of the economy: an economy could continue to function via barter, albeit in an awkward, limited and inefficient way. Take the energy out of the economy: the economy would immediately contract immensely or stop”.
Energy is one of the most important element of our daily life. We use energy to work, to power our vehicles, to warm our houses, to cook, to play music, to light, to wash and dry clothes, to communicate . . . in a way or in another we are strictly connected and dependent on energy. This explains why we have to give energy a lot of attention from an economic, a politic and a social points of view.
Energy can be defined as follow ”Measure of the ability of a body or system to do work or produce a change, expressed usually in joules or kilowatt hours (kWh). No activity is possible without energy and its total amount in the universe is fixed. In other words, it cannot be created or destroyed but can only be changed from one type to another. The two basic types of energy are (1) Potential: energy associated with the nature, position, or state (such as chemical energy, electrical energy, nuclear energy). (2) Kinetic: energy associated with motion (such as a moving car or a spinning wheel)”.
The main characteristic of energy is that it is not a single commodity, we can find it from di↵erent sources and forms. Energy sources, e.g. crude oil,
natural gas, coal, hydro, uranium, wind, sunlight or geothermal deposits, can be used to produce energy commodities such as gasoline, diesel fuel, natural gas, coal or electricity. This characteristic has helped the transition to new energy sources during the time according to costs and availability. The sub-stitution of one form of energy for another has developed gradually, some of the major changes took place over millennia and have proceeded at di↵erent stages of development in di↵erent parts of the world.
Moreover the transition of di↵erent forms of energy has changed the demand side, by changing life styles, raising standards of living and helping urban-ization.
The aim of this dissertation is to look at the economics of energy, which studies how economic agents -firms, households, governments- supply and demand energy resources and commodities, convert, transport them in order to satisfy their increasing needs. Moreover it includes markets and regulatory institutions which play an important role in establishing prices and alloca-tions. Another relevant aspect is the involvement of environment that in the last years is one of the most crucial problem of the modern society.
The objective is to analyze the relationship between the availability of energy resources and the economic activities in a network context under the idea of providing an efficient distribution of energy resources. Complex relations, constraints and influences of the economic, social and political systems are at the basis of this analysis. Many intuitive expectations are invalidated, for example the possession of abundant energy resources for some countries has been no a guarantee for a good economy performance, while the ”absence” has been no obstacle to achieve economic prosperity for other countries.
In particular my attention focuses on methodologies, i.e. network flow techniques, to analyze the problem of allocating energy resources in the sup-ply chain and not only.
dimen-fed the horses, from agriculture (the transformer technology), which harnessed the energy from the sunlight (primary energy source). Thus, this five-component chain forms an energy system for transpor-tation. Although animal powers for transportation would be regarded today as alternative and renewable approach to transportation, only a little over 100 years back, the main and the popular means of transportation in European cities were the horse-drawn wagons. However, the horse excretions not only made the city streets dirty, but also smell horrible, especially under the burning sunshine in the summer—this had become the horrendous environmental problem of the time arising from the use of horse power for transportation in urban areas. At that time, the main concern of environmental degradation was the terrible smell in the air from the animal excretion (the so-called air pollution of the time), and it was no wonder that automobile powered by petroleum oils was hailed as a ‘‘perfect solution’’ to the then horrendous environmental problem.
Automobile (the service technology) that provides transportation from one place to another (the energy service needed) uses gasoline or diesel as the energy carrier; and gasoline or diesel is derived from crude oils (the primary energy source) through oil exploration and oil refineries (the transformer technology)—thus a new energy system is formed for transportation based on fossil fuels. The inevitable negative impact of this energy system on the environment became obvious only a few decades after automobiles were mass introduced. It was then realized that automobile powered by petroleum oils was not a ‘‘perfect’’ solution after all (such as the famous smog in Los Angeles); automobile exhaust emissions not only degrade the local environment,
especially urban areas, but also contribute to the deterioration of global environment, and increase the health risk for humans and animals as well as plants. It is estimated that (Veziroglu, 2004) this year alone, some 90 billion tons of fossil fuel pollutants, viz., CO2, CO,
SO2, NOx, soot and ash, will be spewed out into the
atmosphere. These pollutant emissions are the main causes of the green house effect, air pollution and acid rains. The annual cost of damage, caused by these pollutants, to the humans, to the crops, to all flora and fauna as well as to man-made structures, or in general to our entire environment on a worldwide basis, is around five trillion US dollars, equivalent to about 14% of the gross world product. It is also noticed that automobile emission constitutes the single largest source of emis-sions within the present fossil fuel based energy system, and is the dominant source of emissions and health risk for many of the world’s urban areas.
This example of transportation energy system clearly illustrates the evolutionary nature of the environmental problem associated with the energy system; or alter-natively, different energy systems have different impact on the different aspect of the environment. Further, the negative impact on the environment seems to become more severe and the damage caused seems to become farther reaching with the advancement of the energy technology involved.
So the natural question is what is the ‘‘perfect’’ solution to the environmental problem caused by the present fossil fuels based energy system? Opinion abounds! It ranges from alternative fuels and renewable energy sources to the visionary hydrogen energy system as the long-term solution. From the Clinton-era partner-ship in next generation vehicles (PNGV) to the present
ARTICLE IN PRESS
Services TechnologiesService Currencies TechnologiesTransformer Sources
Examples: Keeping warm/cool Communication Transportation Facilitating Trade/commerce Food Preparation Illumination Health care Examples: Air heating Telephones Automobiles aircraft Heat pumps Refrigerators Microwave Ovens Light bulbs CAT-scans X-rays Examples:
Drilling rigs & Oil refineries Dams / hydraulic generators Uranium mines / Nuclear generators Photovoltaic arrays Windmills Thermal power generators Examples: Coal Sunlight Crude oil Geothermal Water power Wind Natural gas Uranium Tides What People Want Not Changing Driver of Change What People “think” leads change What Nature Provides Not Changing Energy Sector Examples: Jet Gasoline Methanol Hydrogen Electricity Methanol Diesel
Fig. 1. A complete energy system includes the traditional energy sector that provides the energy needed as well as the services wanted and the technologies delivering the services (Scott, 1995).
X. Li / Energy Policy 33 (2005) 2237–2243 2239
Figure 1: Complete Energy System (Scott, 1995).
sion.
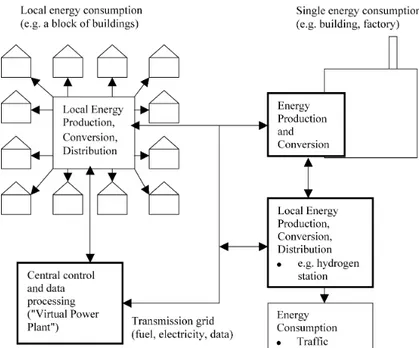
Modern cities for example, can be considered as integral part of modern en-ergy systems, so one can look at urban enen-ergy systems to analyze how they are organized in terms of delivering services such as heating, cooling, light-ing, mobility, communication..., and how they can improve in an efficient way in a period in which per capita energy use is increasing, the energy sys-tem structure is becoming more complex and service provision is driven by innovations.
The questions that are at the basis of modern energy systems are: How peo-ple will behave in the future?What kind of services will they want?And how to best deliver those services in an efficient way?
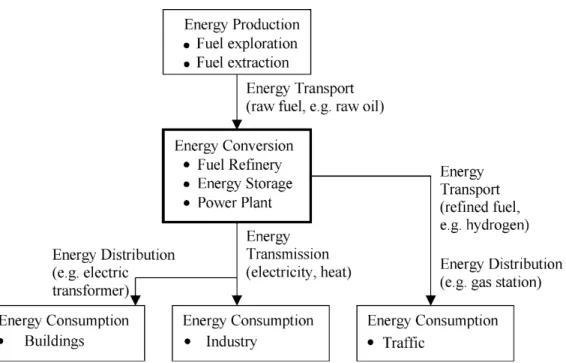
All these aspects have to be taken into account by modern societies in plan-ning energy provisions. A very simple outline is presented in Fig.??.
In the last years a lot attention has been given to renewable energy sources, but the big problem of these sources is that they are intermittent, that means they are not able to provide a uniform distribution of energy. The
remedy could be the integration between di↵erent sources in order to have a compensation, that is the aim of smart grids. A smart grid can be defined as an evolved electricity network that can manage electricity demand in a sustainable, reliable and economic manner, built on advanced infrastructure and tuned to facilitate integration of all involved.
Another relevant aspect that could be investigated into is that of economic dependence on energy sector in particular by European countries, whose sup-ply comes from outside the area, from markets that are not hold in check. This is the question that nowadays is in discussion in European and Global Institutions.
This thesis is structured as follows. In chapter one, a brief review of the most significant energy transitions in human history is presented, in order to understand the growing dependence on energy of modern society. Moreover, to highlight the crucial importance of this issue, it is analyzed the relation-ship between energy and economy. Finally, the growing concept of Urban Metabolism is illustrated.
Chapter two is dedicated to the description of Energy Systems, with partic-ular attention to Urban Energy Systems, Distributed Energy Systems and Integrated Energy Systems. In the final section, several measures adopted in the framework of energy policy in Europe are described, in order to see the institutional side of energy and what have been done and what could be done from this perspective to increase energy efficiency.
In chapter three, a short review of the most important problems concerning Network Flows is presented. The aim is to present di↵erent techniques to optimize Network Flows. After a review of the basic notions about networks, the attention is given to three di↵erent kind of network flow problems that is to say: the Shortest Path Problem, the Maximum Flow Problem and the Minimum Cost Flow Problem.
The last chapter, chapter four, focuses on the application of Network Flows techniques to energy system, a deterministic and a stochastic model are de-scribed.
Chapter 1
1.1
Historical background
Modern society has turned back on the past for what concerns renewable energy; wind, water, sunlight are again at the center of new innovations, for this reason it is important to remark the most significant energy transitions in human history.
At the beginning of human existence, man’s needs for energy were very simple: he used fire to keep warm and to cook.
However the inefficient use of fire, in this period, did not help to keep under control energy flow.
The first energy transition took place when the first permanent settlement happened. Settled communities were able to devote time domesticating draft animals and moreover to use fire in a more productive way. Fire started to be used for producing metals and other durable materials.
These new innovations improved man’s life by enabling him to increase his diet, to keep warm, to provide light, to better control the environment and to protect himself.
Several millennia later, the second transition happened, but it proceeded at di↵erent stages of development in di↵erent parts of the world.
substi-tuted human and animal exertion with renewable energy flows, that increased in power and efficiency.
The use of sails to capture the power of the wind accelerated the trade around the world. Water-wheel was at the beginning used for irrigation and for gird-ing cereals; moreover, later, water was used to power a variety of machines such as blacksmithing, tanning, fulling and woodturning.
It is estimated that energy consumed per capita doubled, see Fig.1.2 and Fig. 1.3.
Used by permission for Bridging World History, 11
The Annenberg Foundation copyright © 2004
consume about fifty thousand times as much energy as our ancestors once did (Chart 2). [End Page 449] They demonstrate a control over energy that no other species can match. The equivalent graph for chimpanzees (or, for that matter, for any other nonhuman animals) would show no significant change in either total or per capita energy consumption over the last one hundred thousand years or more.
Figure 1.2: Average daily per capita energy consumption in di↵erent historical eras (Units of energy= 1000 calories per day).
Source: Simmons I. G., Changing the Face of the Earth: Culture, Environment, History. Second Edition. Oxford: Blackwell, p. 27, 1997.
However until the Middle Ages, with relatively small population and mod-est per capita consumption, it was possible to maintain a balance between renewable energy supply and energy demand. In this period wood was used
Used by permission for Bridging World History, 12
The Annenberg Foundation copyright © 2004
The accelerating ecological power of humans shows up in many other ways as well. One of the most powerful measures of human ecological power is summarized in Table 4. The table gives the dates by which 25%, then 50%, then 75% of several different types of ecological impact had been reached. For example, the date 1950 in the population row and the 50% column implies that half of all human population growth occurred after that date (within the lifetime of many [End Page 450] [Begin Page 452] people alive today). The table shows clearly how human impacts on the environment have accelerated in the last two centuries. 18
Figure 1.3: Energy consumption per capita in di↵erent eras. Data from Fig.1.2.
as a fuel, while wind and water to provide power. But since that moment local production of wood and its consumption as a fuel were not coordinated, some areas were devastated and a prosperous agriculture allowed the growth of wide urban settlements that required a lot of fuel.
With the development of metal technology high energy requirements grew up. Copper was the first metal that di↵used, its reduction temperature is fairly low, but it was not abundant.
On the other hand iron was considerably more abundant, but it is required a much higher reduction temperature. During the Middle Ages iron produc-tion expanded, but forests were depleted. The scarcity of wood led to the use of coal as a fuel.
The third transition happened when after millennia of dependence on an-imate sources of energy and biomass fuels, gradually we passed to fossil fuels, that still today are the principal energy commodities.
Coal mines were developed in particular in England. By 1800, lots of coal was used in households, iron industry required a lot of provisions. The early mining of coal was based on outcrops above the water table, but as soon as the increasing demand had to be satisfied deeper mines were required and to mine there was an urgent need of a new form of mechanical power, other than water-wheels.
In 1692 Thomas Savery invented a coal fired steam engine for draining mines, but it had some practical disadvantages and it was not successful. Later Newcomen applied the idea of Papin of using a piston to increase the heights through which water could be lifted. Important improvements arrived be-tween 1763 and 1782, when Watt introduced an enclosed cylinder in which steam could not only power the downward stroke but also the upward stroke. Further improvements were sufficiently to extend the use of steam engine in several sectors included transport.
The discovery of coal-based technology for smelting iron and the invention of steam engine provided the basis for the Industrial Revolution which led to a restructure of the urban energy services, through network infrastructures.
Technological innovations had a significant impact on energy demand coming from growing urban populations and firms. To improve safety of people and to lengthen the working day, street light was a new priority of that time. Oil lamps entered the houses and lightened the streets but de-mand for higher quality stimulated the researchers. Light produced by gas or oil improved but gas was expensive and electricity spread.
Edison designed the first electrical generating system, which provided elec-tricity to customers through copper wires. It was the success of electric bulb that helped the commercialization of Edison’s integrated power and lighting system. This is the latest energy transition, that since that time have pushed modern economies to increase their consumption of fossil fuels indirectly as electricity. New forms of electricity generation have been introduced, such
as nuclear fission, wind turbine, photovoltaic cells, but hydrocarbons, crude oil and natural gas are still the dominant fuels generators.
All of these developments had enormous personal and collective conse-quences: improving the quality of life has been the principal individual ben-efit because of increased food harvest, improved health and longevity, spread of education and leisure opportunities, enhanced of personal mobility. How-ever the great energy transitions did not decline the disparities between rich and poor societies and this is still today a crucial issue.
Other consequences have been the growth of the world population, the rise of economic power of nations thank to Industrialization, the extension of military capabilities, the expansion of trade and the globalization of human a↵airs. Finally the downsides have been greater environmental burdens and wars for the provisions of energy resources. These are today big problems at the basis of future choices in terms of energy that are discussed globally by Institutions.
1.2
Energy and Economy relationship
In the past, improvements in energy efficiency usually coincided with im-provements in the nation’s overall productive efficiency. Beginning with the industrial revolution, increased energy use has fueled economic development in advanced industrialized societies (Fouquet, 2008). There is agreement that the use of available energy resources, such as coal, combined with technology innovations allowed to impressive growth results. However this has not hap-pened in the last decades. Since 1973 progress in energy efficiency has been accompanied by market slowdown in productivity; the explanation could be that those enhancements are bounded. Therefore it is crucial to understand which is the relationship between energy and economy in order to highlight the importance of this issue.
The starting point is to investigate the role of energy in production. Busi-ness and financial economists pay significant attention to the impact of oil and other energy prices on economic activity, but the mainstream theory of economic growth pays little or no attention to the role of energy or other nat-ural resources in promoting economic growth. Moreover institutional aspects has to be considered since they influence the role of energy in a complex way. All economic processes, in particular the production one, require energy and there are limits to the substitution of other factors of production for energy, so energy is always an essential factor of production (Stern, 1997a). It is a necessary but not sufficient input and moreover according to the law of thermodynamics, nothing can be changed without it. A simplified pro-duction function could take the form of GDP=f(capital, labor, energy, land, materials and know-how), where the contribution of each factor to output depends on the development of the economy, physical conditions and loca-tion, factor price and factor productivity. By using the production function approach we have that the optimal energy input and thus the energy demand
can be determined by first order conditions where the marginal productivity is equal to the factor price.
tion of the environment. Using more and more of the environment as a sink for pollution means less and less of it is available for other life-support uses. Compared to current fossil fuel technologies, alter-native energy sources may require larger areas of the environment for energy capture and may also generate wastes, etc. in the production of the energy capture and transmission capitals.
2.3.2 Limits to Technological Change
Even if substitution possibilities are limited, sustain-ability is possible if technological change is natural capital augmenting and unlimited in scope. The arguments for technological change as a solution would be more convincing if technological change were really something different from substitution. The neoclassical approach assumes that an infinite number of efficient techniques coexist at any one point in time. Substitution occurs among these techniques. Changes in technology occur when new, more efficient techniques are developed. However, in a sense, these new techniques represent the substitu-tion of knowledge for the other factors of producsubstitu-tion. The knowledge is embodied in improved capital goods and more skilled workers and managers, all of which require energy, materials, and ecosystem services to produce and maintain. Thus, however sophisticated the workers and machinery become, there are still thermodynamic restrictions on the extent to which energy and material flows can be reduced.
Another question is whether technology will follow the ‘‘right’’ direction. If natural resources are not priced correctly due to market failure—a common and pervasive phenomenon that is the main topic of study of mainstream environmental econom-ics—then there will be insufficient incentives to develop technologies that reduce resource and energy use. Instead, technological change would result in more resource use, not less.
3. FACTORS AFFECTING LINKAGE BETWEEN ENERGY AND GROWTH
There has been extensive debate concerning the trend in energy efficiency in the developed economies, especially since the two oil price shocks of the 1970s. Taking the example of the U.S. economy, energy consumption hardly changed in the period 1973 to 1991 (Fig. 4). This was despite a significant increase in GDP. These facts are indisputable. The reasons for
the break in the trend have been the subject of argument. It is commonly asserted that there has been a decoupling of economic output and resources, which implies that the limits to growth are no longer as restricting as in the past.
The discussion here starts from the neoclassical perspective of the production function to examine the factors that could reduce or strengthen the linkage between energy use and economic activity over time. A general production function can be represented as follows:
Q1;y; Qm
ð Þ0¼ f A; X! 1;y; Xn; E1;y; Ep"; ð1Þ
where the Qi are various outputs (such as
manufac-tured goods and services), the Xjare various inputs
(such as capital, labor, etc.), the Ek are different
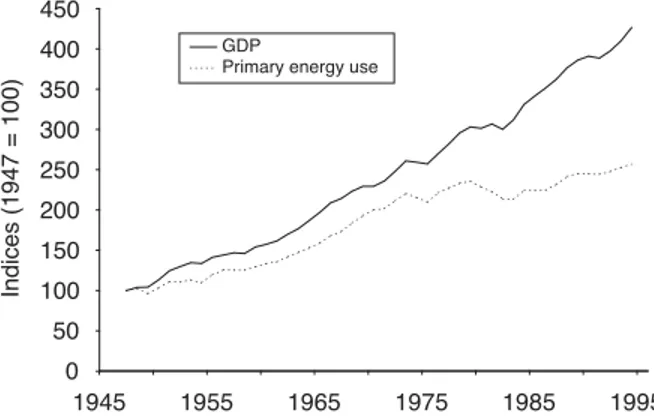
energy inputs (such as coal, oil, etc.), and A is the state of technology as defined by the total factor productivity indicator. The relationship between energy and an aggregate of output such as gross domestic product can then be affected by substitu-tion between energy and other inputs, technological change (a change in A), shifts in the composition of the energy input, and shifts in the composition of output. Also, shifts in the mix of the other inputs— for example, to a more capital-intensive economy from a more labor-intensive economy—can affect the relationship between energy and output, but this issue has not been extensively discussed in the literature and so will not be pursued further here. It is also possible for the input variables to affect total factor productivity, though in models that invoke exogenous technological change, this is assumed not to occur. 0 50 100 150 200 250 300 350 400 450 1945 1955 1965 1975 1985 1995 Indices (1947 = 100) GDP
Primary energy use
FIGURE 4 United States gross domestic product (GDP) and total primary energy use. GDP is in constant dollars, i.e., adjusted for inflation. Both variables are indexed to 100 in 1947.
44 Economic Growth and Energy
Figure 1.4: U.S. gross domestic product (GDP) and total primary energy use. GDP is in constant dollars, i.e. adjusted for inflation. Both variables are indexed to 100 in 1947 [36].
Taking the example of U.S. economy, as it can be seen in Fig.1.4, it can be observed that in the period 1973 to 1991, the trend between energy consumption and GDP hardly changed. In order to explain the reasons for this break in the trend an examination of the factors that could reduce or strengthen the relationship between energy use and economic activity, could be done through the neoclassical production function that can be represented as follows:
Q1, . . . Qm= f (A, X1, . . . Xn, E1, . . . Ep),
where Qi are various outputs such as goods and services, Xj are various
inputs such as capital and labor, Ek are di↵erent energy inputs, and A is
the technological progress as defined by the total factor productivity. The relationship between energy and GDP can be a↵ected by shifts in the
com-position of energy inputs or output. Samuel Schurr was among the first that recognize the economic importance of energy quality, that is the contrast between di↵erent forms of energy. Overtime the composition of energy use has changed, and according to Schurr the general shift toward higher quality fuels reduces the amount of energy required to produce a dollar’s worth of GDP. On the other hand it can be remarked that usually, over the course of economic development, also the output mix changes. At the beginning there is a shift from agriculture toward heavy industry, and later on toward services and lighter manufacturing. Following this path the result will be an increase in energy used per unit of output in the early stages of development and then a reduction in energy used later in the process. However recent studies show that the shift toward the service sector contributed to a decoupling of energy and economic growth. Service industries still need large amount of energy and input resources, for this reason the energy-intensity ratio1 is not
decreasing.
1Energy efficiency of a nation’s economy can be measured by using the Energy/GDP
ratio, that represents the amount of energy required to produce a dollar’s worth of good and services. Energy-intensity can be written as a function of energy efficiency (eit) and
economic activity component, i.e. sectoral activities (sit). Specifically:
et=(Et Y t)=Pi(Eit Y it)(Yit Y t)Peitsit,
whereEtis the aggregate energy consumption in year t, Eit is the energy consumption in
sector i in year t, Ytis the GDP in year t, and Yit is a measure of economic activity in
sector i in year t.
Causality in the energy-GDP relationship
In order to deeper analyze the relationship between economic growth and energy use, it could be useful to focus on empirical testing. Ordinary linear regression or correlation methods can not be used to establish a causal relation between these variables, this is because when two variables appear to trending over time, they result to be correlated simply because of the shared. Two methods to test causality among economic growth and energy use are the Granger causality test and the cointegration analysis.
Granger causality tests whether one variable in a relation can be mean-ingfully described as a dependent variable and the other variable as an in-dependent variable; whether the relation is bidirectional; and/or whether meaningfully relation exists. Many analysts have used this test to test if energy use causes economic growth or vice versa in the context of a bivari-ate vector autoregression. Generally the results were inconclusive but when significant results where obtained, the majority showed that the causality goes from output to energy use. For example Stern (1993) tested US data (1947-1990) for Granger causality in a multivariate setting using a vector au-toregression (VAR) model of GDP, energy use, capital and labor inputs. The multivariate methodology is important because changes in energy uses are countered by the substitution of other factors of production. The measure of energy use was made by its thermal equivalents and by the Divisia aggre-gation method2. Moreover energy use was weighted to take into account the
composition of energy inputs, because growth e↵ects of energy are due to
2Divisia is an aggregation method used in economics that permits variable substitution
among material types without imposing a priori restrictions on the degree of substitution. Divisia aggregation in this context, is an appropriate way to aggregate energy use for investigating its role in the economy.
the substitution with higher quality energy resources (Jorgenson, 1984, Hall et al., 1986). The results of Stern study are shown in Fig.1.5, and as can been seen in both the Bivariate and the Multivariate model, energy is found to ”Granger-cause” GDP. These results are consistent with the price-based studies of Hamilton (1983) and Burbridge and Harrison (1984), that will not be analyzed here. C.J. Cle!eland et al. / Ecological Economics 32 (2000) 301–317 311
Table 3
Energy GDP causality tests USA 1947–1990a
Multivariate model Bivariate model
Quality adjusted energy
Primary BTUs Primary BTUs Quality adjusted energy
0.9657 0.5850 Energy causes 0.8328 3.1902 0.4402 0.5628 0.4428 0.3188E-01 GDP 0.3421 GDP Causes 0.7154 9.0908 0.8458 0.5878 Energy 0.7125 0.7163E-03 0.5106
aThe test statistic is an F statistic. Significance levels in italics. A significant statistic indicates that there is Granger causality in
the direction indicated.
7.2. Cointegration and the energy GDP relation Stern (1998) tests for cointegration between en-ergy use and economic activity in the same multi-variate model used in Stern (1993) with US data from 1948 to 1994. If a multivariate approach helps uncover the direction of Granger causality between energy and GDP, then a multivariate approach should clarify the cointegrating rela-tions among variables. The Johansen methodol-ogy (Johansen, 1988; Johansen and Juselius, 1990) is used to test for the number of cointegrating vectors in the multivariate Vector Error Correc-tion Model (VECM) estimate their parameters, and the rate at which energy use and economic activity adjusts to disequilibrium in the long-run relations. The VECM is given by:
!yt=!+"#"[1, t, yt − 1]"+"i!yt − i+$t (7)
in which y is a vector of variables (in logarithms), $tis a vector of random disturbances,! is the first
difference operator, t is a deterministic time trend, !is a vector of coefficients to be estimated, " is a matrix of adjustment coefficients (to be esti-mated), # is the matrix of cointegrating vectors (to be estimated), and the %i are matrices of
short-run dynamics coefficients (to be estimated). The test for the number of cointegrating vectors determines the dimensions of " and #.
The cointegrating vectors indicate that energy use and GDP are present in both cointegrating relations but the elements of " indicate that these cointegrating relations affect the equation for en-ergy use only. This result indicates that there is a statistically significant relation between energy use
and GDP, but the direction of causality runs from economic activity to energy use. This result is consistent with Stern (1993).
Table 4 presents the results for the model using the quality-adjusted energy index. The third row in Table 4 presents tests for excluding each of the variables from the long-run relation. Restrictions that eliminate energy from the long-run relation-ships are rejected while the same restrictions for capitol cannot be rejected. However, the statistics in the fourth row show that none of the variables can be treated as exogenous variables. The causal pattern is in general mutual. The fifth and sixth rows show the signs and significance of the adjust-ment coefficients. The first cointegrating relation has no significant effect on the capital equation. However, all the other coefficients are significant. This again confirms the mutual causality pattern. Use of quality adjusted energy indices clearly has an important effect on analyses of Granger causality and cointegration. When energy is mea-sured in thermal equivalents, research predomi-nantly finds that either there is no relation between energy and GDP or that the relation runs from GDP to energy in both bivariate and multi-variate models. The implications for the impor-tance of energy in the economy are quite different in the two cases.
8. Case study 3: the determinants of the energy–GDP relationship
One of the most widely cited macroeconomic indicators of sustainability is the ratio of total Figure 1.5: Energy GDP causality tests USA 1947-1990. [37].
Another kind of test is the Cointegration Test which can be applied only to linear models of integrated time series. The irregular trend in time series is known as a stochastic trend as opposed to a simple linear determin-istic time trend. Usually GDP and energy use are integrated. Cointegration analysis aims to uncover causal relations among variables by determining if the stochastic trends in a group of variables are shared by the series so that the total number of unique trends is less than the number of variables. The presence of cointegration can be interpreted as the presence of a long-run equilibrium relationship between the variables considered. Stern (1998) tested the cointegration between energy use and economic activity by using a multivariate model with US data from 1948 to 1994. To test cointegration
Johansen methodology3 (Johansen and Joselius, 1990) was used in the
Mul-tivariate Vector Error Correction Model (VECM). The VECM is given by:
yt = + ↵ [1, t, t-1] + i yt-1+ ✏t,
Where y is a vector of variables (in logarithms), ✏t is a vector of
ran-dom disturbances, is the first di↵erence operator, t is a deterministic time trend, is a vector of coefficient to be estimated, ↵ is a matrix of adjustment coefficients to be estimated, is the matrix of cointegrating vectors to be estimated, and finally i are matrices of short-run dynamics coefficients to
be estimated. The aim of the test is to estimate ↵ and . The cointegrating vectors indicate that energy and GDP are present in both cointegrating rela-tions but the elements of ↵ indicate that these cointegrating relarela-tions a↵ect the equation for energy use only.
The result of the test indicates that there is a statistically significant relation between energy use and GDP, but the direction of causality was from economic activity to energy use, and this is consistent with the results obtained by Stern (1993). Other analysts have found that energy, GDP and energy prices cointegrate and that when all three variables are included there is a mutual causation between energy and GDP.
3Johansen methodology, is a procedure for testing cointegration of several time-series,
that allows for more than one cointegrating relationship, unlike Granger method, but it is subject t8 asymptotic properties, i.e. large sampler.
C.J. Cle!eland et al. / Ecological Economics 32 (2000) 301–317
312
energy use to total economic activity, or the energy/ real GDP ratio (E/GDP ratio). This ratio has declined since 1950 in many industrial nations. Controversy arises regarding the interpretation of this decline. Many economists and energy analysts argue that the declines indicate that the relation between energy use and economic activity is rela-tively weak. This interpretation is disputed by many biophysical economists. They argue that the decline intheE/GDPratiooverstatestheabilitytodecouple energy use and economic activity because many analyses of the E/GDP ratio ignore the effect of changes in energy quality (Fig. 1).
The effect of changes in energy quality (and changes in energy prices, and types of goods and services produced and consumed) on the E/GDP ratio can be estimated using Eq. (6), which was developed by Gever et al. (1986) and Cleveland et al. (1984): E GDP=!+"1Ln
!
Natural gas E"
+"2Ln!
Oil E"
+"3Ln!
Primary electricity E"
+"4!
PCE GDP"
+"5(Product mix) +"6Ln(Price)+# (8)in which E is the total primary energy consumption (measured in heat units), GDP is real GDP, Primary electricity is electricity generated from hydro,
nu-clear, solar, or geothermal sources, PCE is real personal consumption expenditures spent directly on energy by households, Product mix measures the fraction of GDP that originates in energy intensive sectors (e.g. chemicals) or nonenergy intensive sectors (e.g. services), and Price is a measure of real energy prices. Kaufmann (1992) applied this model to France, Germany, Japan and the United King-dom.
The effect of energy quality on the E/GDP ratio ismeasuredbythefractionoftotalenergyconsump-tionfromindividualfuels.Thesignontheregression coefficients "1, "2, and "3is expected to be negative
because natural gas, oil, and primary electricity can do more useful work (and therefore generate more economic output) per heat unit than coal. The rate at which an increase in the use of natural gas, oil, or primary electricity reduces the E/GDP ratio is not constant. Engineering studies indicate that the efficiency with which energies of different types are converted to useful work depends on their use. Petroleum can provide more motive power per heat unit of coal, but this advantage nearly disappears if petroleum is used as a source of heat (Adams and Miovic, 1968). From an economic perspective, the law of diminishing returns implies that the first uses of high quality energies are directed at tasks that are best able to make use of the physical, technical, and economic aspects of an energy type that combine to determine its high quality status. As the use of a high quality energy source expands, it
Table 4
Cointegration modela
ln GDP ln Energy
Variables ln Capital ln Labor Trend
−1.174 0.354
Coefficients of the first cointegrating vector −0.191 1 0.014
−0.689 −0.009 −0.157
−0.237 1
Coefficients of the second cointegrating vector
13.24 11.48
Chi-square test statistic for exclusion of variable from the 18.08 1.62 17.92 cointegration space (5% critical level=5.99)
11.80 16.13 8.18 16.27 –
Chi-square test statistic for weak exogeneity of the variables (5% critical level=5.99)
0.046 0.053
First column of alpha (t stats in parentheses) −0.005 0.087 (4.239) – (2.005) (2.150) (−0.974)
1.624 0.229 0.801 –
1.155 Second column of alpha (t stats in parentheses)
(4.213) (5.472) (3.551) (3.271) – aCoefficients of the cointegrating vectors multiply the relevant variables in the first row. Alpha coefficients transmit the effects of the first and second cointegrating relations to the equations for the relevant variables in the first row. First and second columns of alpha load first and second cointegrating relations, respectively, into the relevant equations.
Figure 1.6: Cointegration modela.[37].
1.3
Urban metabolism
”No other century -no millennium- in human history can compare with the twentieth for its growth in energy use. We have probably deployed more en-ergy since 1900 than in all of human history before 1900”.
(McNeill, 2000)
In the recent years cities have grown in a complex way due to interlinked geographical forces and institutional frameworks. In particular cities are now dependent on access to resources and ecosystems outside their boundaries and this is a result of globalization.
The rapid expansion in size, density and complexity, has been accom-panied by increasing energy flows of inputs and outputs, that enter, exit and/or accumulate within and external of the cities’ boundaries. Under-standing this system made by interactions and interdependencies can help to shape energy provisions and uses in a more efficient way. Measuring and un-derstanding cities’ resources and energy inputs, outputs and storage could be done through Urban metabolism, that o↵ers a platform for expanded urban system analysis.
In the context of energy, Urban metabolism has emerged from a growing understanding of the limited availability of fossil fuels and their impact on the environment as well efficiency use. Urban metabolism was firstly discussed by Karl Marx in 1883. He used the concept of metabolism to describe material and energy interactions between nature and society, through human activity. Marx wrote that man lives from nature -and is a natural being himself- but
in addition, he also transforms nature to produce his material needs. (Marx in Foster, 2000) In his analysis, metabolism took on both a specific ecolog-ical meaning and a wider social meaning, that we can call socio-ecologecolog-ical metabolism.
The concept was later on applied by Abel Wolman that in 1965 wrote a pioneering article ”The Metabolism of Cities”. In the article he proposed a model of a hypothetical American city of one million people, to actually calculate the inputs of materials and outputs of waste for such an urban system, taking UM to a quantitative proof of concept. While Marx used the concept of UM putting the emphasis on the social organization of harvesting of Earth’s materials, Wolman developed UM as a method to analyze cities through the quantification of inputs-water, food, fuels-outputs and waste, in order to develop sustainable cities. Since Wolman first study a lot of re-searches have been undertaken, a chronological review is described in Fig.1.7 .
Urban metabolism may be defined as ”the sum total of the technical and socio-economic processes that occur in cities, resulting in growth, production of energy, and elimination of waste” (Kennedy et al., 2007).
According to this methodology UM is similar to the metabolism of an organ-ism that consumes resources and excretes wastes.
”Cities transform raw materials, fuel, and water into the built environment, human biomass and waste” (Decker et al., 2000).
However a city is more complex than a single organism, because it includes lots of di↵erent organisms. It can be defined an artificial organism whose ob-jective is to follow the model of natural ecosystems, that are usually energy
wastes from the urban metabolism are also necessary to quantify greenhouse gas emissions for cities. Beyond accounting exercises, moreover, the review of applications shows how study of urban metabolism is also being used as a basis for sustainable urban design, and how a few mathematical models of urban metabolism have been used for policy analysis.
2. Development of the urban metabolism concept
Since the first study of an urban metabolism by Wolman in 1965, about 15e20 comprehensive studies of urban metabolism have been undertaken, in addition to numerous related studies (Table 1). This section describes the evolution of methodological approaches for studying urban metabolism. The primary focus is on
quantitative studies, as opposed to works that invoke urban metabolism in a political science context (e.g.,Heynen et al., 2005), or in a qualitative historical context (e.g.,Tarr, 2002).
In his seminal study,Wolman (1965)used national data on water, food and fuel use, along with production rates of sewage, waste and air pollutants to determine per capita inflow and outflow rates for a hypothetical American city of one million people (White, 2002). His approach to determining material flows, even with the omission of important inputs such as electricity, infrastructure materials, and other durable goods, helped focus attention on system-wide impacts of the consumption of goods and the gener-ation of wastes within the urban environment (Decker et al., 2000). The first metabolism studies of real cities were conducted in the 1970s. Interestingly the first three studies of Tokyo (Hanya and
Table 1
Chronological review of urban metabolism studies.
Author (year) City or region of study Notes/contribution
Wolman (1965) Hypothetical US city of
1 million people
Seminal study
Zucchetto (1975) Miami Emergy approach
Stanhill (1977); Odum (1983) 1850s Paris Emergy approach
Hanya and Ambe (1976). Toyko
Duvigneaud and Denayeyer-De Smet (1977)
Brussels Includes natural energy balance
Newcombe et al. (1978); Boyden et al. (1981)
Hong Kong Particularly comprehensive metabolism study
Girardet (1992) Recognized link to sustainable development of cities
Bohle (1994) Critiqued metabolism perspective for studying food in
developing cities European Environment
Agency (1995) Prague (comprehensivemetabolism study) Energy use data for Barcelona and seven other Europeancities given in the report.
Nilson (1995) Gävle, Sweden Phosphorus budget
Baccini (1997). Swiss Lowlands
Huang (1998). Taipei Emergy approach
Newman (1999);
Newman et al. (1996) Sydney Adds liveability measures
Stimson et al. (1999) Brisbane & Southeast Queensland Framework relating urban metabolism to quality of life.
Hermanowicz and Asano (1999) Water
Hendriks et al. (2000). Vienna & Swiss Lowlands Warren-Rhodes and Koenig (2001). Hong Kong
Baker et al. (2001) Phoenix & Central Arizona Nitrogen balance
Sörme et al. (2001) Stockholm Heavy metals
Svidén and Jonsson (2001) Stockholm Mercury
Obernosterer and Brunner (2001) Vienna Lead
Færge et al. (2001) Bangkok Nitrogen & Phosphorus
Chartered Institute of Wastes Management (2002)
London
Gasson (2002) Cape Town
Barrett et al. (2002) York, UK Materials
Obernosterer (2002) Metals
Sahely et al. (2003). Toronto
Emmenegger et al. (2003) Geneva
Burstrom et al. (2003) Stockholm Nitrogen & Phosphorus
Gandy (2004) Water
Lennox and Turner (2004) State of the Environment report
Hammer and Giljum (2006) Hamburg, Vienna and Leipzig Materials
Kennedy et al. (2007) Review of changing metabolism
Schulz (2007) Singapore Materials
Barles (2007a) Paris Historical study of nitrogen in food metabolism
Forkes (2007) Toronto Nitrogen in food metabolism
Zhang and Yang (2007) Shenzhen, China Develops eco-efficiency measure
Ngo and Pataki (2008) Los Angeles
Chrysoulakis (2008) New project under EU 7th framework
Schremmer and Stead (2009) New project under EU 7th framework
Barles (2009, 2007b) Paris Analysis of central city, suburbs and region.
Zhang et al. (2009) Beijing Emergy approach
Niza et al. (2009) Lisbon Materials
Deilmann (2009) Studies relationship between metabolism and city surface
Baker et al. (2001) Water
Thériault and Laroche (2009) Greater Moncton, New Brunswick
Water
Browne et al. (2009) Limerick, Ireland Develops measure of metabolic efficiency
C. Kennedy et al. / Environmental Pollution xxx (2010) 1e9 2
Please cite this article in press as: Kennedy, C., et al., The study of urban metabolism and its applications to urban planning and design, Environmental Pollution (2010), doi:10.1016/j.envpol.2010.10.022
self-sufficient. UM is a quantitative framework that enables policy-makers to identify early trends, set priorities, develop indicators and establish policy directives. It provides information about energy efficiency, material cycling, waste management and infrastructure and finally is an important tool to un-derstand energy use in communities.
Methodologies
The basic rationale behind the urban metabolism concept is that the rela-tionship between the environment and an urban system can be described by systematically recording all flows to and from the environment in physical terms.
The behavior of energy as a flow, follows two basic principles of thermody-namics: First Law -energy transforms to another form and is neither created nor destroyed; Second Law -in all processes of energy, some energy will be degraded in quality and transformed into waste heat.
UM has evolved into two distinct approaches: Odum’s Emergy method and mass balance accounting.
Emergy is one of the most important concept for studying energy flows. It is defined as the available energy used directly or indirectly to make product or deliver a service. It measures the work of nature and humans in generating products and services as a common metric of environmental and economic values (Odum, 1996: Odum 2006).
The Emergy method incorporate environmental, social and economic aspects into a common unit of non-monetary measure and objectively assesses the
sustainability of systems and processes. It can be used to compare the sus-tainability of di↵erent supply chains. It is measured in emjoules, a unit that refers to the available energy of one kind consumed in transformations. However it is practically difficult to express all urban processes in common units. Emergy accounting faces challenges of inadequate data as well as dif-ficulties of integrating and/or comparing materials and energy represented in di↵erent units. The complexity of this approach and its resulting limited application is due to converting flows to the seJ metric (Huang, 1998; Huang, Chen, 2009; Huang, Hsu, 2003; Odum, 1996).
Thus, there are other methodologies that deal with energy-material flux such as: material flow analysis (MFA), mass balance, life cycle assessment (LCA), Economic Input-Output Life Cycle Assessment (EIO-LCA).
MFA provides a framework for analyzing the ways urban areas transform natural resources. It measures the material flowing into the system, the stocks and flows within it, and the resulting outputs from the system to other systems in the form of pollution, waste or exports. (Sahely, Dudding, Kennedy, 2003) MFA is based on the principle of mass conversion where mass in=mass out+stock changes.
Mass balance is an application of the physical principle of conservation of mass, therefore the mass of inputs into a process has to balance the mass of outputs as products, emissions or wastes, plus any exchange in stocks.
International Standard Organization defines Life cycle assessment as the complication and evaluation of the inputs, outputs and the potential envi-ronmental impacts of a product system throughout its life cycle.
esti-mates the materials and energy resources required for, and the environmental emissions resulting from activities in the economy.
All these methodologies can be used jointly or separately according to Researchers needs. Fig.1.8 shows merits and drawbacks of each UM method.
and the magnitude of the impact. Using this approach, researchers have analyzed 4 Chinese municipalities (Liu et al., 2012b), 30 Chi-nese provinces (Zhang et al., 2011d,2012a), and Shanghai (Guo, 2009), among other areas.
To analyze endogenous mechanisms, network analysis is increasingly being adopted to simulate the structure and function of a metabolic system. Hannon (1973) pioneered the use of ecological network analysis (ENA) based on inputeoutput tech-niques to simulate the structural distribution of ecosystem com-ponents and the complex interrelationships between different trophic levels.Finn (1976)improved Hannon’s method by using total system throughflow, average path length, and a cycling index to quantify the ecosystem structure and function derived from the analysis of flows. Based on the interdependence among the different components of an ecosystem, which can be described in terms of the flows of materials and energy,Patten (1982)refined the traditional ENA method. He proposed the concept of analysis based on an “environ”, which was his terminology for the within-system environment. An object’s environ ends at the within-system’s boundary. Exchanges across the boundary with the external envi-ronment are deemed inputs and outputs, depending on the flow direction. The basis of this method is to establish an ecological network flow diagram that indicates the relative amounts of ma-terial and energy flows between components of the system through direct and indirect relationships (Levine, 1980;Patten, 1982;Suh, 2005).Szyrmer and Ulanowicz (1987)extended the analysis of material and energy flows by defining a matrix of total flows, which provides a more convenient starting point for such tasks as sensi-tivity analyses, description of the cycles, identification of key components of the system, optimal resource reallocation, and definition of the trophic status. They also described the differences between ENA and inputeoutput analysis from the perspective of the differences between economics and ecology. Specifically, they noted that economists are primarily interested in what leaves a system (i.e., the final outputs or the demand that drives those outputs), whereas ecologists are more interested in the total effect that the output from component i of a system has on the total output of component j.Patten’s (1982)environ analysis resembled structural path analysis (Defourny and Thorbecke, 1984) and the ENA framework attempted to integrate the framework ofGhosh
(1958)rather than that ofLeontief (1941), which had been the general approach used previously in inputeoutput economics (e.g., Pauly and Christensen, 1995). TheGhosh (1958)framework is a supply-driven model based on an input-side balance, whereas the Leontief (1941)framework is a demand-driven model based on an output-side balance.
ENA simulates material and energy flows through an ecosystem from a holistic perspective. It is therefore an effective method for analyzing the structure and function of a system (Fath and Killian, 2007;Levine, 1980;Patten, 1982;Szyrmer and Ulanowicz, 1987). Currently, it is applied in research on natural ecosystems (Baird et al., 2009;Borrett et al., 2007;Christian et al., 2009;Dame and Christian, 2008;Gattie et al., 2006;Heymans et al., 2002;Jordán et al., 2009) more often than in research on socioeconomic sys-tems (Chen, 2003;Chen et al., 2010a;Zhang et al., 2012b,2012c). However, it has been applied to the overall metabolism of Beijing (Li et al., 2012;Liu et al., 2010;Zhang et al., 2009a); the water metabolism of a small municipality in northern Italy (Bodini and Bondavalli, 2002), of China’s Yellow River Basin (Li et al., 2009), and of Beijing (Zhang et al., 2010a); the energy metabolism of Xiamen (Zhao, 2006) and of four Chinese municipalities (Zhang et al., 2010b,2011a,2011b); the carbon metabolism of Hong Kong (Chen and Chen, 2012a) and of Vienna (Chen and Chen, 2012b); and the phosphorus (Wu and Shi, 2010a) and nitrogen (Wu and Shi, 2010b) metabolisms of the Yixing economic development zone.
In simulation models of an urban metabolism, it is necessary to divide metabolic actors into increasingly precise compartments such as sectors of the economy and to clarify metabolic flows among the compartments. The inputeoutput analysis method makes this possible. Most urban metabolic research now defines metabolic actors based on economic sectors in the inputeoutput tables. Furthermore, the research estimates the material and en-ergy flows based on the flows of economic value between urban metabolism sectors; in China, this data can be obtained from the Chinese inputeoutput tables, which are only compiled as economic values.
Network models have typically defined the structure of the system, the processes that define the flows among the system’s structural compartments, and the quantity of each flow. In the 1970s, the inputeoutput analysis method was widely applied to
Table 2
Comparison of the main urban metabolism simulation methods.
Model type Approach Drawbacks
Ecological dynamics Constructing descriptions of causal feedback relations to analyze the operation and evolution trends of an urban metabolic system in chronological order, and combining the elements of society, the economy, and nature to simulate the evolution trend of the urban metabolic system.
Unifying the flow processes for multiple ecological elements quantitatively is problematic because there is no unified accounting method. Thus, researchers have mostly focused on simulating the metabolic processes for a single element. The emergy simulation studies that combine many elements cannot account well for wastes, and there are therefore deficiencies in the ecological dynamics models. Ecological network
analysis Through the methods of flow, utility, and path analysis, researchersquantitatively simulate the structure and functional relationships among components of the system.
The lack of flows among networks in a socioeconomic system makes it difficult to refine the sectors of the network, and the ecological connotation of simulating the network structure require additional analysis. In addition, such analyses require large amounts of data, and the data is often unavailable or of questionable quality. Inputeoutput
analysis Combining economic elements with material- and energy-flowanalysis allows the construction of environmental inputeoutput tables, which can help to refine our understanding of the actors in urban metabolic processes.
On an urban scale, it’s necessary to obtain data from the provinces and countries that engage in exchanges with the urban area to quantify differences in the inputs or imported products or technologies embodied in services. The combination of material and energy flows with inputeoutput tables is difficult; although it is possible to account for the exchanges among sectors because of limited availability of data on material and energy flows (which must be accounted for using economic (capital) matrices), the result remains a rough simulation. Process analysis Provides a life-cycle accounting for resource use and the associated
environmental impacts from extraction of the original raw materials to disposal of the final wastes.
Large quantities of data are required, and this may be prohibitively expensive or time-consuming to obtain. In addition, the results may be precise for a given study area, but cannot be generalized to other areas.
Y. Zhang / Environmental Pollution 178 (2013) 463e473 468
Figure 1.8: Comparison of the main urban metabolism simulation methods [41].
Urban metabolism is much more than an accounting exercise since urban metabolism can also influence sustainable urban design and inform policy analysis (Kennedy et al, 2011). Therefore UM focuses its attention not only on environmental impacts, but also on economic and social dimensions of sustainable cites. We can conclude that the main goal of UM studies is to make citizens and companies aware of these impacts and as a result to promote society collaboration and smarter decision-making processes.
Chapter 2
2.1
Urban Energy Systems
Cities are now the dominant form of spacial organization in which people live, economies operate, technologies are generated and used. According to United Nations, by the year 2030 nearly two thirds of the global popula-tion will be located in cities. This trend can be explained in large part by economic and social forces, as cities o↵er their citizens new opportunities for business, education, security, and community, therefore it will cause city planners and key infrastructure stakeholders to face the big problem of pro-viding good quality services, meeting environmental targets and propro-viding energy services to an increasing number of customers. Moreover it can be observed a strong trend of convergence of developing countries toward level of urbanization of developed countries, that will require equitable access to clean-energy services, energy securities as well as environmental capabilities, that for this reason have to be considered in the study of Urban Energy Sys-tem.
Jaccard’s (2005) defines an Energy System as ”the combined processes of acquiring and using energy in a given society or economy”. This definition is relevant to identify at least three important features.
The first one deals with ”combined processes”: Delivering energy ser-vices requires many di↵erent steps including resource extraction, refining, transportation, storage, and conversion to end service. While the urban en-vironment may be physically separate from many of these processes, they should be considered in an overall analysis if they are ultimately being used to service urban demands4.
The second one deals with ”acquiring and using”: Energy systems rep-resent a balance between supply and demand. Historically cities might be seen as centers of passive demand which must be supplied from an ex-urban source, but recent work suggests that there are now significant opportunities for in-city energy generation 5.
Finally the issue of ”given society and economy” highlights that: Energy System is a socio-technical system, comprised of more than just pipelines, fuels, and engineering equipments. Markets, institutions, consumer behav-iors and other factors a↵ect the way technical infrastructures are constructed and operated.
A Urban System can be defined as a network of towns, cities and their
4See: Kennedy C, Steinberger J, Gasson B, Hansen Y, Hillman T, Havr´anek M, et al.
Methodology for inventorying greenhouse gas emissions from global cities. Energy Policy 38(9):4828-4837, 2009
5See: ”Foresight Sustainable Energy Management and the Built Environment Project”
Final project report. Tech. Rep. London: Government Office for Science; 2008. Retrieved from http://www.bis.gov.uk/foresight/our-work/projects/published-projects/sustainable-energy-management-and-the-built-environment.
hinterlands, which can be seen as a system in the sense that it depends on the movements of labor, goods and services, and capital through the network. It is a phenomenon that has to be analyzed from a functional perspective, in addition to territorial and administrative perspectives. A Urban Energy System is therefore a network that relates the use and the provision of energy services with the functional Urban System.
The development of Urban Energy Systems arises some big problems that are today faced by several administrative and political institutions from all over the world and in particular by Europe. The high density of the population and the concentration of economic activities arise the problem of energy supply capability. In many larger cities it is required a large-scale imports of renewable energy generated elsewhere. To stop this reliance on foreign provisions, it could be useful to plan Urban Energy System in a more integrated way. Increasing Energy Networks synergies could be an opportunity to improve energy efficiency delivery. Therefore the question that is presented here is to investigate what could be the benefits if cities are organized to integrate their energy use. There are several issues to be taken into account, the first one is to understand how people will behave in the future and what kind of services they will ask for. The related aspect is to understand how to deliver those services in the most efficient way. Another important issue is to understand where technology moves in order to invest in the right places. Finally, a crucial issue is that of energy saving, that actually seems to be the best way to solve the problem of energy provision capabilities.