Clinical Study
Repeatability and Reproducibility of Retinal
Nerve Fiber Layer Parameters Measured by Scanning
Laser Polarimetry with Enhanced Corneal Compensation
in Normal and Glaucomatous Eyes
Mirian Ara,
1Antonio Ferreras,
1,2Ana B. Pajarin,
3Pilar Calvo,
1Michele Figus,
4and Paolo Frezzotti
51Department of Ophthalmology, Miguel Servet University Hospital, Aragon Health Sciences Institute, 50009 Zaragoza, Spain 2Department of Surgery, Gynecology and Obstetrics, University of Zaragoza, 50009 Zaragoza, Spain
3Department of Family Medicine, Seminario Primary Health Care Center, 50009 Zaragoza, Spain 4Department of Neurosciences, University of Pisa, 56100 Pisa, Italy
5Department of Ophthalmology, University of Siena, 53100 Siena, Italy
Correspondence should be addressed to Antonio Ferreras; [email protected] Received 7 September 2014; Accepted 4 March 2015
Academic Editor: Alfredo Garc´ıa-Layana
Copyright © 2015 Mirian Ara et al. This is an open access article distributed under the Creative Commons Attribution License, which permits unrestricted use, distribution, and reproduction in any medium, provided the original work is properly cited.
Objective. To assess the intrasession repeatability and intersession reproducibility of peripapillary retinal nerve fiber layer (RNFL)
thickness parameters measured by scanning laser polarimetry (SLP) with enhanced corneal compensation (ECC) in healthy and glaucomatous eyes. Methods. One randomly selected eye of 82 healthy individuals and 60 glaucoma subjects was evaluated. Three scans were acquired during the first visit to evaluate intravisit repeatability. A different operator obtained two additional scans within 2 months after the first session to determine intervisit reproducibility. The intraclass correlation coefficient (ICC), coefficient of variation (COV), and test-retest variability (TRT) were calculated for all SLP parameters in both groups. Results. ICCs ranged from 0.920 to 0.982 for intravisit measurements and from 0.910 to 0.978 for intervisit measurements. The temporal-superior-nasal-inferior-temporal (TSNIT) average was the highest (0.967 and 0.946) in normal eyes, while nerve fiber indicator (NFI; 0.982) and inferior average (0.978) yielded the best ICC in glaucomatous eyes for intravisit and intervisit measurements, respectively. All COVs were under 10% in both groups, except NFI. TSNIT average had the lowest COV (2.43%) in either type of measurement. Intervisit TRT ranged from 6.48 to 12.84. Conclusions. The reproducibility of peripapillary RNFL measurements obtained with SLP-ECC was excellent, indicating that SLP-ECC is sufficiently accurate for monitoring glaucoma progression.
1. Introduction
Progressive death of retinal ganglion cells and their axons in the retina leads to characteristic changes in the optic nerve head, which are the typical signs of glaucomatous optic neuropathy. These structural changes also result in func-tional visual field loss as measured by standard automated perimetry (SAP). Therefore, evaluating the retinal nerve fiber layer (RNFL) and monitoring its changes are key compo-nents in glaucoma management. Objective and quantitative
assessment of the RNFL largely relies on digital imaging technologies, including scanning laser polarimetry (SLP).
SLP is an imaging technology used to measure the birefringence of the RNFL. Polarized light passing through a birefringent structure, such as the RNFL, experiences a phase shift (retardation) that is linearly related to the RNFL
thickness [1]. The cornea and the lens also exhibit birefringent
properties, which are neutralized in the SLP with variable
corneal compensation (VCC) [2]. Although SLP-VCC usually
compensates correctly the birefringence of the anterior pole,
Volume 2015, Article ID 729392, 6 pages http://dx.doi.org/10.1155/2015/729392
atypical birefringence pattern images may be observed in
some cases [3]. Thus, the latest generation of SLP, SLP with
enhanced corneal compensation (ECC), includes an enhance-ment module to improve the performance of SLP-VCC for
detecting RNFL damage [4–7] and progressive RNFL changes
[8].
SLP has a theoretical advantage in detecting changes because reduction of RNFL retardance resulting from disrup-tion of the microtubules could be evident before the actual loss of nerve fibers due to injury of the optic nerve. The present study assessed the intravisit and intervisit repro-ducibility of peripapillary SLP-ECC parameters in healthy and glaucomatous eyes.
2. Methods
2.1. Subjects. The Institutional Review Board (Clinical
Research Ethics Committee of Aragon, CEICA) approved the study design and all methods adhered to the principles of the Declaration of Helsinki. Informed consent was obtained from all participants. Healthy eyes were consecutively recruited from patients referred for refraction that underwent routine examination without abnormal ocular findings, hospital staff, and relatives of patients. The glaucoma group was recruited consecutively from an ongoing longitudinal follow-up study at the Miguel Servet University Hospital. This group included patients with primary open-angle glaucoma, pseudoexfoliative glaucoma, and pigmentary glaucoma. One hundred and forty-two white individuals were evaluated (82 healthy control subjects and 60 patients with glaucoma). When both eyes fulfilled the inclusion criteria, only one eye per subject was randomly included in the study.
Inclusion criteria were age between 18 and 80 years, refractive error not exceeding a 5-diopter sphere and a 3-dio-pter cylinder, best-corrected visual acuity of at least 20/25 (Snellen scale), and transparent ocular media. Participants with any history of cardiovascular, severe hematologic, or neuroophthalmologic disease, optic nerve abnormalities (e.g., tilted disc, drusen), or angle anomalies; any retinal disease (e.g., macular degeneration, diabetic retinopathy, and retinal detachment); or ocular surgery within 1 month of enrollment were excluded.
All subjects underwent a comprehensive ophthalmic examination, comprising a review of their medical and oph-thalmologic history, determination of best-corrected visual acuity, slit lamp biomicroscopy, Goldmann applanation tonometry, central corneal ultrasonic pachymetry (OcuScan RxP; Alcon Laboratories Inc., Irvine, CA), fundus examina-tion, and at least two reliable SAPs (24-2 Swedish Interac-tive Threshold Algorithm Standard examinations; Humphrey Field Analyzer, model 750i; Carl Zeiss Meditec, Dublin, CA). If fixation losses were higher than 20% or false-positive or false-negative rates were higher than 15%, the tests were repeated at least 3 days apart to avoid a fatigue effect. Abnor-mal SAP results were defined as typical glaucomatous defects with a pattern standard deviation significantly increased beyond the 5% level and/or a Glaucoma Hemifield Test result outside normal limits.
2.2. Classification into Groups. Healthy eyes were defined by
an intraocular pressure of 21 mmHg or less and normal SAP. Glaucomatous eyes were defined as those with intraocular pressure readings of at least 21 mmHg and consistent abnor-mal visual field defects on SAP.
2.3. Scanning Laser Polarimetry with Enhanced Corneal Com-pensation Imaging. The same operator acquired the first
three scans (15-minute intertest intervals) at the initial visit using the same SLP-ECC (GDx PRO, Carl Zeiss Meditec, software version 1.0) following a standard protocol to assess intrasession variability. A different operator obtained the fourth and fifth scans at two additional visits at least 4 weeks apart (±1 week) to assess intersession variability. All scans were acquired through undilated pupils with low ambient light. The participants kept their head still during each scan acquisition and looked at the internal fixation point to obtain the best alignment. A primary scan was captured before each calculation to compensate for the corneal birefringence.
The ECC mode introduced a predetermined large bire-fringence bias to shift the total retardation to a higher value to remove noise and minimize the effect of atypical patterns
[9]. Following image acquisition, the birefringent bias was
removed mathematically, point by point, from the final RNFL image. Calculations were performed on a ring of fixed-sized tissue centered on the optic disc automatically determined by the SLP-ECC software.
In this study, we excluded images that were obtained during eye movement. Only good quality images from SLP were accepted: centered and well-focused scans with a quality scan score higher than 6. SLP parameters included in the statistical analysis were nerve fiber indicator (NFI), temporal-superior-nasal-inferior-temporal (TSNIT) average, superior average, inferior average, and TSNIT standard deviation. Although some studies indicate that the NFI is the most
sensitive parameter of SLP for glaucoma diagnosis [10,11], its
calculation method is based on various parameters and the result does not directly indicate RNFL thickness.
2.4. Statistical Analysis. All statistical analyses were
cal-culated using IBM SPSS (version 20; IBM Corporation, Somers, NY) and MedCalc (version 12; MedCalc, Mariakerke, Belgium) statistical software. After checking for a normal
distribution of variables, two-tailed Student’s 𝑡-tests were
used to calculate differences between normal subjects and patients with glaucoma.
The SLP measurement variability was assessed by the intr-aclass correlation coefficient (ICC), coefficient of variation (COV), and the test-retest variability (TRT). The ICC is a statistic that condenses the reproducibility of a parameter for a given group of subjects. A large ICC suggests small fluc-tuations among repeated measurements in the same
individ-ual. The ICC value can range from 0 to a maximum of 1 [12].
The COVs were calculated as the relevant standard deviation divided by the mean of the measurement values expressed as a percentage. TRT was defined as two times the standard deviation.
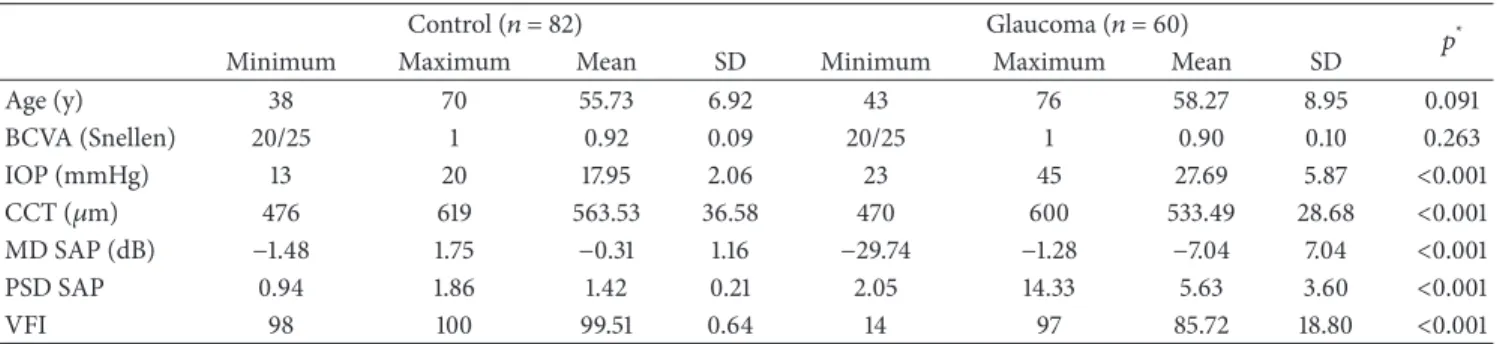
Table 1: Demographic and clinical characteristics of the sample.
Control (𝑛 = 82) Glaucoma (𝑛 = 60) 𝑝*
Minimum Maximum Mean SD Minimum Maximum Mean SD
Age (y) 38 70 55.73 6.92 43 76 58.27 8.95 0.091 BCVA (Snellen) 20/25 1 0.92 0.09 20/25 1 0.90 0.10 0.263 IOP (mmHg) 13 20 17.95 2.06 23 45 27.69 5.87 <0.001 CCT (𝜇m) 476 619 563.53 36.58 470 600 533.49 28.68 <0.001 MD SAP (dB) −1.48 1.75 −0.31 1.16 −29.74 −1.28 −7.04 7.04 <0.001 PSD SAP 0.94 1.86 1.42 0.21 2.05 14.33 5.63 3.60 <0.001 VFI 98 100 99.51 0.64 14 97 85.72 18.80 <0.001
*Student’s𝑡-test between the control and glaucoma groups.
SD: standard deviation; BCVA: best-corrected visual acuity; IOP: intraocular pressure; CCT: central corneal thickness, MD: mean deviation; SAP: standard automated perimetry; PSD: pattern standard deviation; VFI: Visual Field Index.
Repeatability was considered to be the variation in meas-urements acquired by the same operator under the same con-ditions at the same visit. Reproducibility was considered the ability of SLP to consistently obtain the same measurement performed by different operators at different visits. Thus, the intravisit analysis only included the three measurements obtained at the first visit, while the intervisit reproducibility included all five scans acquired during the study.
3. Results
3.1. Demographic Parameters. The present study comprised
142 subjects ranging in age from 38 to 76 years (mean 57.6): 60 eyes with stable open-angle glaucoma and 82 healthy eyes (control group). Other demographic and clinical
characteris-tics of the sample are shown inTable 1.
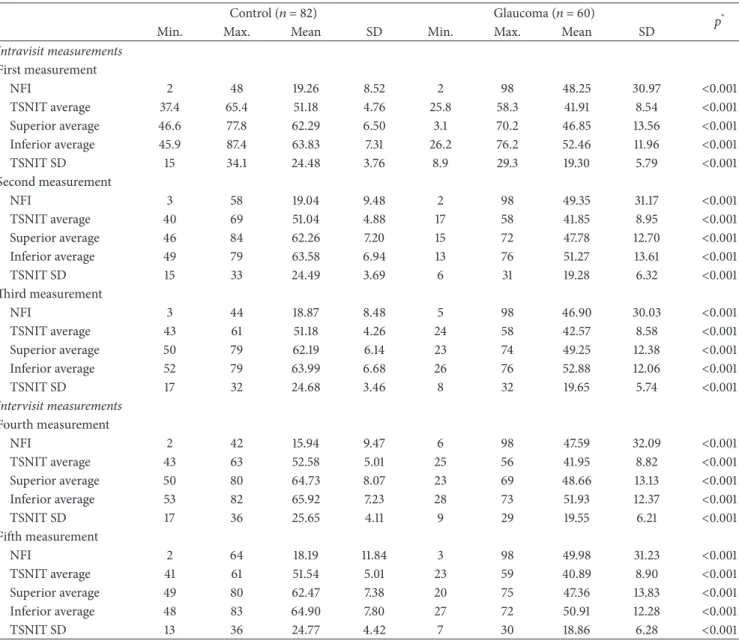
3.2. Reproducibility of SLP-ECC Parameters. Table 2 shows
the comparison of SLP parameters between the normal and glaucoma groups. Intravisit and intervisit ICCs were excellent
for all RNFL parameters (Tables 3and 4). TSNIT average
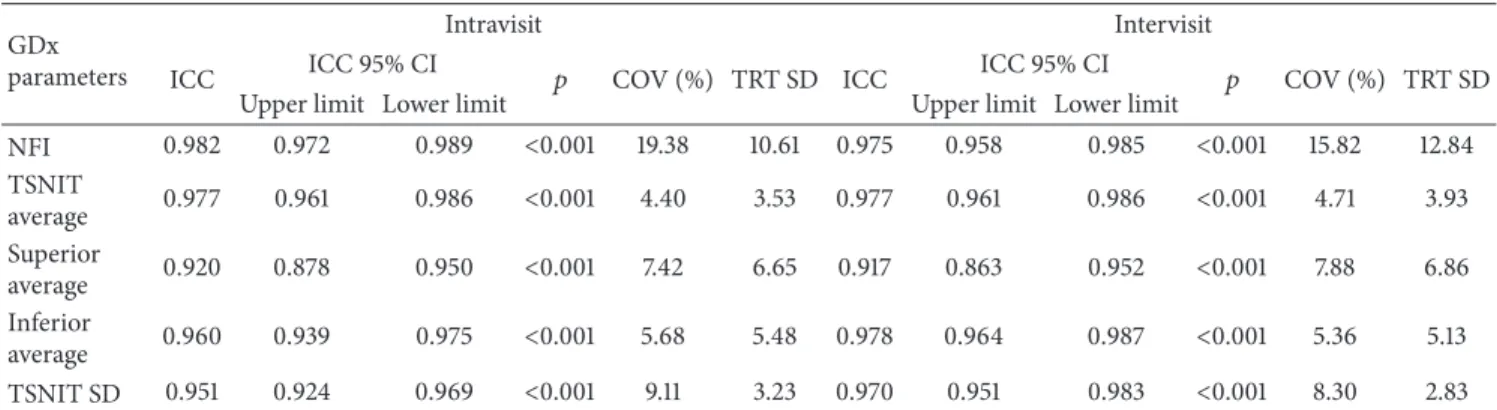
had the highest values (0.967 for intravisit and 0.946 for intervisit measurements) in normal eyes, while NFI (0.982 for intravisit analysis) and inferior average (0.978 for intervisit analysis) had the best values in glaucomatous eyes. TSNIT standard deviation (0.928) and NFI (0.910) exhibited the lowest ICC values for the intra- and intervisit measurements, respectively, in the normal group. Superior average (0.920 for the intravisit and 0.917 for the intervisit analysis) produced the lowest ICCs in the glaucoma group. All COVs were under 10% for both the intravisit and intervisit measurements in both groups, except the NFI. TSNIT average had the lowest intravisit (2.43% in the normal group and 4.40% in the glaucoma group) and intervisit COVs (2.68% in the normal group and 4.71% in the glaucoma group). The TRT for NFI ranged from 6.48 to 6.55 in the normal group and from 10.61 to 12.84 in the glaucoma group. The intervisit TRT was 2.73 for the TSNIT average in the normal group and 3.93 in the glaucoma group. The TSNIT standard deviation had the lowest intervisit TRT (2.83) in the glaucoma group.
4. Discussion
The reproducibility of measurements obtained with any diag-nostic test is key for diagdiag-nostic accuracy and for monitoring changes over time. Glaucomatous progression is typically slow, and, for that reason, it may be difficult to identify small changes during follow-up. The validity of a test for detecting this change depends on its ability to differentiate actual progression from the inherent variability among measure-ments. Quantifying measurement variability is, therefore, critical. Visual field assessment results are subject to long-term fluctuations, which limit the ability to detect glaucoma
progression between two consecutive tests [13,14]. On the
other hand, while a series of fundus photographs can be used to evaluate changes in the optic disc, the subjective nature of this method and the requirement for experienced evaluators limit its accuracy for detecting progression as well as its
general applicability [15,16].
SLP assesses RNFL thickness around the optic nerve head. Because the technology is based on reflectivity, mea-surement is hampered by polarization of the ocular media, which can lead to measurement errors induced by non-RNFL birefringence. Improvements in this technology, including ECC, have led to more reproducible results and more accurate
discrimination between healthy and glaucomatous eyes [17].
Although other investigators have evaluated the repeata-bility of RNFL measurements using SLP-ECC, the present study is unique in the fact that it demonstrates not only repeatability but also reproducibility of SLP-ECC parameters over time. Thus, our study design (measurements at 3 dif-ferent visits) and 2 study groups (normal and glaucomatous eyes) provide new information regarding the reproducibility of SLP reported to date. We found that RNFL measurements acquired with SLP-ECC had low variability (high ICCs and low COVs) for healthy and glaucomatous eyes. These findings
are consistent with those of Sehi et al. [7] who evaluated
the repeatability of SLP-VCC and SLP-ECC. Mai et al. [18]
evaluated the repeatability of RNFL measurements acquired with SLP-ECC in 16 normal subjects, 32 subjects with ocular hypertension, and 35 glaucoma patients and reported similar results but found that the measurement reproducibility in glaucomatous eyes was slightly worse than that in healthy eyes.
Table 2: SLP parameters for the five tests performed in the normal and glaucoma groups.
Control (𝑛 = 82) Glaucoma (𝑛 = 60) 𝑝*
Min. Max. Mean SD Min. Max. Mean SD
Intravisit measurements First measurement NFI 2 48 19.26 8.52 2 98 48.25 30.97 <0.001 TSNIT average 37.4 65.4 51.18 4.76 25.8 58.3 41.91 8.54 <0.001 Superior average 46.6 77.8 62.29 6.50 3.1 70.2 46.85 13.56 <0.001 Inferior average 45.9 87.4 63.83 7.31 26.2 76.2 52.46 11.96 <0.001 TSNIT SD 15 34.1 24.48 3.76 8.9 29.3 19.30 5.79 <0.001 Second measurement NFI 3 58 19.04 9.48 2 98 49.35 31.17 <0.001 TSNIT average 40 69 51.04 4.88 17 58 41.85 8.95 <0.001 Superior average 46 84 62.26 7.20 15 72 47.78 12.70 <0.001 Inferior average 49 79 63.58 6.94 13 76 51.27 13.61 <0.001 TSNIT SD 15 33 24.49 3.69 6 31 19.28 6.32 <0.001 Third measurement NFI 3 44 18.87 8.48 5 98 46.90 30.03 <0.001 TSNIT average 43 61 51.18 4.26 24 58 42.57 8.58 <0.001 Superior average 50 79 62.19 6.14 23 74 49.25 12.38 <0.001 Inferior average 52 79 63.99 6.68 26 76 52.88 12.06 <0.001 TSNIT SD 17 32 24.68 3.46 8 32 19.65 5.74 <0.001 Intervisit measurements Fourth measurement NFI 2 42 15.94 9.47 6 98 47.59 32.09 <0.001 TSNIT average 43 63 52.58 5.01 25 56 41.95 8.82 <0.001 Superior average 50 80 64.73 8.07 23 69 48.66 13.13 <0.001 Inferior average 53 82 65.92 7.23 28 73 51.93 12.37 <0.001 TSNIT SD 17 36 25.65 4.11 9 29 19.55 6.21 <0.001 Fifth measurement NFI 2 64 18.19 11.84 3 98 49.98 31.23 <0.001 TSNIT average 41 61 51.54 5.01 23 59 40.89 8.90 <0.001 Superior average 49 80 62.47 7.38 20 75 47.36 13.83 <0.001 Inferior average 48 83 64.90 7.80 27 72 50.91 12.28 <0.001 TSNIT SD 13 36 24.77 4.42 7 30 18.86 6.28 <0.001
*Student’s𝑡-test between the control and glaucoma groups.
Min.: minimum; Max.: maximum; NFI: nerve fiber indicator; TSNIT: temporal-superior-nasal-inferior-temporal; SD: standard deviation.
Table 3: Intravisit repeatability and intervisit reproducibility of SLP-ECC parameters in the normal group (𝑛 = 82). GDx
parameters
Intravisit Intervisit
ICC ICC 95% CI 𝑝 COV (%) TRT SD ICC ICC 95% CI 𝑝 COV (%) TRT SD
Upper limit Lower limit Upper limit Lower limit
NFI 0. 935 0.906 0.956 <0.001 21.82 6.55 0.910 0.855 0.947 <0.001 19.91 6.48 TSNIT average 0.967 0.949 0.979 <0.001 2.43 2.51 0.946 0.912 0.968 <0.001 2.68 2.73 Superior average 0.940 0.913 0.959 <0.001 3.86 4.84 0.938 0.900 0.963 <0.001 3.88 4.90 Inferior average 0.944 0.919 0.962 <0.001 3.69 4.76 0.934 0.894 0.961 <0.001 3.82 4.84 TSNIT SD 0.928 0.896 0.951 <0.001 6.20 3.03 0.912 0.857 0.948 <0.001 8.54 3.56
ICC: intraclass correlation coefficient; CI: confidence interval; COV: coefficient of variation; TRT SD: test-retest variability; NFI: nerve fiber indicator; TSNIT: temporal-superior-nasal-inferior-temporal; SD: standard deviation.
Table 4: Intravisit repeatability and intervisit reproducibility of SLP-ECC parameters in the glaucoma group (𝑛 = 60). GDx
parameters
Intravisit Intervisit
ICC ICC 95% CI 𝑝 COV (%) TRT SD ICC ICC 95% CI 𝑝 COV (%) TRT SD
Upper limit Lower limit Upper limit Lower limit
NFI 0.982 0.972 0.989 <0.001 19.38 10.61 0.975 0.958 0.985 <0.001 15.82 12.84 TSNIT average 0.977 0.961 0.986 <0.001 4.40 3.53 0.977 0.961 0.986 <0.001 4.71 3.93 Superior average 0.920 0.878 0.950 <0.001 7.42 6.65 0.917 0.863 0.952 <0.001 7.88 6.86 Inferior average 0.960 0.939 0.975 <0.001 5.68 5.48 0.978 0.964 0.987 <0.001 5.36 5.13 TSNIT SD 0.951 0.924 0.969 <0.001 9.11 3.23 0.970 0.951 0.983 <0.001 8.30 2.83
ICC: intraclass correlation coefficient; CI: confidence interval; COV: coefficient of variation; TRT SD: test-retest variability; NFI: nerve fiber indicator; TSNIT: temporal-superior-nasal-inferior-temporal; SD: standard deviation.
Although we also evaluated the reproducibility of the NFI, it does not seem to be the best parameter for detecting glaucoma progression. NFI is a machine-learning classifier based on a linear support vector machine, not a parameter to measure disease severity. We found that NFI showed the best ICC (0.982) in the intravisit session and extremely good intervisit session reproducibility (ICC = 0.975) in the glaucoma group, but in all cases with a worse COV. In fact, the Guided Progression Analysis software provided by the manufacturer does not rely on the NFI to compare measurements over time, but on the TSNIT average, superior average, and inferior average, as well as different maps and graphs.
S´anchez-Garc´ıa et al. [19] recently evaluated the
repeata-bility of RNFL parameters measured with SLP-VCC in 75 normal eyes and reported good results. They compared the variability between SLP-VCC, Cirrus optical coherence tomography, and confocal scanning laser tomography. They observed less fluctuation between examinations with SLP-VCC, particularly in the superior RNFL. It should be noted, however, that their intravisit measurements were based on only two scans. Similar findings for intravisit variability were
reported by Rao et al. [20], who assessed the repeatability
of SLP-ECC in 140 eyes of 73 healthy subjects. Their COVs ranged between 1.7% (average TSNIT) and 11.4% (NFI).
Garas et al. [21] used the COV to assess the intravisit
repeatability of RNFL thicknesses measured with RTVue-100 spectral-domain optical coherence tomography, SLP-VCC, and SLP-ECC in 37 eyes, including 14 normal or ocular hypertensive eyes and 23 eyes with moderate to severe glaucoma. COVs for the average thickness and the RNFL thickness in the four quadrants were less than 10% in eyes with moderate to severe glaucoma.
The present study has some limitations. First, only good quality images with a signal strength of at least 7 were included in the statistical analysis, which might have influ-enced the upper and lower limits of the variability of SLP-ECC parameters. Thus, our results can be applied to patients with moderate and good quality scans, while worse repro-ducibility results may be expected when diagnosing glaucoma progression based on a series that includes poor quality
images. Further studies are needed to clarify the effect of low quality scans, such as those obtained in subjects with media opacities, which is common in daily clinical practice. Second, some glaucoma patients had previous experience with SLP testing, which might have contributed to the low variability observed in this group. This seems unlikely, because there is no evidence that SLP requires a training period due to a learning effect. Third, despite the fact that our sample comprised a wide range of glaucoma severities, our results
may not extrapolate to all clinical situations [22].
In conclusion, intravisit and intervisit measurements of peripapillary RNFL obtained with SLP-ECC had excel-lent reproducibility. Clinicians must take into account the reproducibility of every SLP-ECC parameter to differentiate variability and true progression when monitoring patients with glaucoma.
Conflict of Interests
The authors declare that there is no conflict of interests regarding the publication of this paper.
Acknowledgment
The paper is supported in part by the Instituto de Salud Carlos III Grant PI1101239 with FEDER funds.
References
[1] R. N. Weinreb, S. Shakiba, and L. Zangwill, “Scanning laser polarimetry to measure the nerve fiber layer of normal and glaucomatous eyes,” American Journal of Ophthalmology, vol. 119, no. 5, pp. 627–636, 1995.
[2] Q. Zhou and R. N. Weinreb, “Individualized compensation of anterior segment birefringence during scanning laser polarime-try,” Investigative Ophthalmology and Visual Science, vol. 43, no. 7, pp. 2221–2228, 2002.
[3] H. Bagga, D. S. Greenfield, and W. J. Feuer, “Quantitative assess-ment of atypical birefringence images using scanning laser polarimetry with variable corneal compensation,” American
[4] M. Sehi, D. C. Guaqueta, and D. S. Greenfield, “An enhancement module to improve the atypical birefringence pattern using scanning laser polarimetry with variable corneal compensa-tion,” The British Journal of Ophthalmology, vol. 90, no. 6, pp. 749–753, 2006.
[5] T. A. Mai, N. J. Reus, and H. G. Lemij, “Diagnostic accuracy of scanning laser polarimetry with enhanced versus variable corneal compensation,” Ophthalmology, vol. 114, no. 11, pp. 1988–1993, 2007.
[6] C. Bowd, I. M. Tavares, F. A. Medeiros, L. M. Zangwill, P. A. Sample, and R. N. Weinreb, “Retinal nerve fiber layer thickness and visual sensitivity using scanning laser polarimetry with variable and enhanced corneal compensation,” Ophthalmology, vol. 114, no. 7, pp. 1259–1265, 2007.
[7] M. Sehi, D. C. Guaqueta, W. J. Feuer, and D. S. Greenfield, “Scan-ning laser polarimetry with variable and enhanced corneal compensation in normal and glaucomatous eyes,” American
Journal of Ophthalmology, vol. 143, no. 2, pp. 272–279, 2007.
[8] F. A. Medeiros, L. M. Zangwill, L. M. Alencar, P. A. Sample, and R. N. Weinreb, “Rates of progressive retinal nerve fiber layer loss in glaucoma measured by scanning laser polarimetry,” The
American Journal of Ophthalmology, vol. 149, no. 6, pp. 908–915,
2010.
[9] M. T´oth and G. Holl´o, “Enhanced corneal compensation for scanning laser polarimetry on eyes with atypical polarisation pattern,” The British Journal of Ophthalmology, vol. 89, no. 9, pp. 1139–1142, 2005.
[10] F. A. Medeiros, L. M. Zangwill, C. Bowd, and R. N. Weinreb, “Comparison of the GDx VCC scanning laser polarimeter, HRT II confocal scanning laser ophthalmoscope, and stratus OCT optical coherence tomograph for the detection of glaucoma,”
Archives of Ophthalmology, vol. 122, no. 6, pp. 827–837, 2004.
[11] A. Ferreras, L. E. Pablo, A. B. Pajar´ın, J. Garc´ıa-Feijoo, and F. M. Honrubia, “Scanning laser polarimetry: logistic regression anal-ysis for perimetric glaucoma diagnosis,” Eye, vol. 23, no. 3, pp. 593–600, 2009.
[12] P. E. Shrout and J. L. Fleiss, “Intraclass correlations: uses in assessing rater reliability,” Psychological Bulletin, vol. 86, no. 2, pp. 420–428, 1979.
[13] H. D. Jampel, S. Vitale, Y. Ding et al., “Test-retest variability in structural and functional parameters of glaucoma damage in the glaucoma imaging longitudinal study,” Journal of Glaucoma, vol. 15, no. 2, pp. 152–157, 2006.
[14] P. Fogagnolo, C. Sangermani, F. Oddone et al., “Long-term peri-metric fluctuation in patients with different stages of glaucoma,”
The British Journal of Ophthalmology, vol. 95, no. 2, pp. 189–193,
2011.
[15] A. Azuara-Blanco, L. J. Katz, G. L. Spaeth, S. A. Vernon, F. Spen-cer, and I. M. Lanzl, “Clinical agreement among glaucoma experts in the detection of glaucomatous changes of the optic disk using simultaneous stereoscopic photographs,” The
Ameri-can Journal of Ophthalmology, vol. 136, no. 5, pp. 949–950, 2003.
[16] L. E. Pablo, A. Ferreras, P. Fogagnolo, M. Figus, and A. B. Pajar´ın, “Optic nerve head changes in early glaucoma: a comp-arison between stereophotography and Heidelberg retina tomo-graphy,” Eye, vol. 24, no. 1, pp. 123–130, 2010.
[17] K. A. Townsend, G. Wollstein, and J. S. Schuman, “Imaging of the retinal nerve fibre layer for glaucoma,” The British Journal of
Ophthalmology, vol. 93, no. 2, pp. 139–143, 2009.
[18] T. A. Mai, N. J. Reus, and H. G. Lemij, “Retinal nerve fiber layer measurement repeatability in scanning laser polarimetry with
enhanced corneal compensation,” Journal of Glaucoma, vol. 17, no. 4, pp. 269–274, 2008.
[19] M. S´anchez-Garc´ıa, R. Rodr´ıguez De La Vega, M. Gonz´alez-Hern´andez, and M. Gonz´alez De La Rosa, “Variability and reproducibility of 3 methods for measuring the thickness of the nerve fiber layer,” Archivos de la Sociedad Espa˜nola de
Oftalmolog´ıa, vol. 88, no. 10, pp. 393–397, 2013.
[20] H. L. Rao, C. R. Venkatesh, K. Vidyasagar et al., “Retinal nerve fiber layer measurements by scanning laser polarimetry with enhanced corneal compensation in healthy subjects,” Journal of
Glaucoma, vol. 23, no. 9, pp. 589–593, 2014.
[21] A. Garas, M. T´oth, P. Vargha, and G. Holl´o, “Comparison of repeatability of retinal nerve fiber layer thickness measurement made using the RTVue fourier-domain optical coherence tomo-graph and the GDx scanning laser polarimeter with variable or enhanced corneal compensation,” Journal of Glaucoma, vol. 19, no. 6, pp. 412–417, 2010.
[22] M. Gonzalez-Hernandez, L. E. Pablo, K. Armas-Dominguez, R. R. de la Vega, A. Ferreras, and M. G. de la Rosa, “Structure-func-tion rela“Structure-func-tionship depends on glaucoma severity,” The British
Submit your manuscripts at
http://www.hindawi.com
Stem Cells
International
Hindawi Publishing Corporationhttp://www.hindawi.com Volume 2014
Hindawi Publishing Corporation
http://www.hindawi.com Volume 2014
INFLAMMATION
Hindawi Publishing Corporation
http://www.hindawi.com Volume 2014
Behavioural
Neurology
Endocrinology
International Journal of Hindawi Publishing Corporationhttp://www.hindawi.com Volume 2014
Hindawi Publishing Corporation
http://www.hindawi.com Volume 2014
Disease Markers
Hindawi Publishing Corporation
http://www.hindawi.com Volume 2014
BioMed
Research International
Oncology
Journal ofHindawi Publishing Corporation
http://www.hindawi.com Volume 2014
Hindawi Publishing Corporation
http://www.hindawi.com Volume 2014
Oxidative Medicine and Cellular Longevity
Hindawi Publishing Corporation
http://www.hindawi.com Volume 2014
PPAR Research
The Scientific
World Journal
Hindawi Publishing Corporation
http://www.hindawi.com Volume 2014
Immunology Research
Hindawi Publishing Corporation
http://www.hindawi.com Volume 2014
Journal of
Obesity
Journal ofHindawi Publishing Corporation
http://www.hindawi.com Volume 2014
Hindawi Publishing Corporation
http://www.hindawi.com Volume 2014
Computational and Mathematical Methods in Medicine
Ophthalmology
Journal ofHindawi Publishing Corporation
http://www.hindawi.com Volume 2014
Diabetes Research
Journal ofHindawi Publishing Corporation
http://www.hindawi.com Volume 2014
Hindawi Publishing Corporation
http://www.hindawi.com Volume 2014
Research and Treatment
AIDS
Hindawi Publishing Corporation
http://www.hindawi.com Volume 2014
Gastroenterology Research and Practice
Hindawi Publishing Corporation
http://www.hindawi.com Volume 2014