Plant Ecology
VOLUME 10, NUMBER 5, PAGES 839–850 OctOBER 2017 doi: 10.1093/jpe/rtw092 Advance Access publication 15 September 2016 available online at academic.oup.com/jpe© The Author 2016. Published by Oxford University Press on behalf of the Institute of Botany, Chinese Academy of Sciences and the Botanical Society of China. All rights reserved. For permissions, please email: [email protected]
Bedrock geology interacts with
altitude in affecting leaf growth
and foliar nutrient status of
mountain vascular plants
Renato Gerdol
1,*, Roberta Marchesini
1and Paola Iacumin
21 Department of Life Sciences and Biotechnology, University of Ferrara, Corso Ercole I d’Este 32, I-44121 Ferrara, Italy 2 Department of Physics and Earth Sciences, University of Parma, Viale delle Scienze 158/A, I-43124 Parma, Italy
*Correspondence address. Department of Life Sciences and Biotechnology, University of Ferrara, Corso Ercole I d’Este 32, I-44121 Ferrara, Italy. Tel: +39(0)532293775; Fax: +39(0)532208561; E-mail: [email protected]
Abstract
Aims
Altitude is often used as a proxy for ascertaining how warming affects plant growth and leaf level properties. However, we have a poor understanding of how the effects of altitude-related warming varies across geology. therefore, this study examined the independ-ent and interactive effects of altitude and geology and species on plant growth and foliar nutrient status.
Methods
We determined leaf growth rates and concentrations of major nutrients (nitrogen, N and phosphorus, P) in leaves of five spe-cies across two altitudinal gradients (1200–2200 m) in the Dolomites (south-eastern Alps, Italy). the two transects were located on carbonate bedrock and silicate bedrock, respec-tively. We also determined concentrations of inorganic and organic N and P forms in soils, and δ 15N signature in leaves
and soils.
Important Findings
Foliar N concentrations were unrelated to bedrock geology. the negative foliar δ 15N signature suggested that organic N was the primary source
of N supply across the gradients. Foliar P concentrations were strongly affected by bedrock geology and their altitudinal patterns depended on the concentrations of organic and inorganic P forms in the soil. Phosphates and organic P appeared to be the main sources of P supply. Leaf growth rates increased with higher altitude on silicate bedrock and decreased with higher altitude on carbonate bedrock and presented a significant positive correlation with foliar N:P. In conclusion, bedrock geology inter-acted with altitude in controlling the foliar nutrient status mainly owing to availability of soil P and its effect on foliar nutrient stoichiometry.
Key words: altitude; mycorrhiza; plant functional type; soil
chemistry; 15N
Received: 31 May 2016, Revised: 5 September 2016, Accepted: 9 September 2016
INtRODUctION
Decreasing temperature with increasing altitude can affect both growth rate and nutrient status of mountain vascular plants. Low temperature can limit plant growth by direct effects of cold limitation implying, e.g. insufficient photo-synthesis (carbon gain limitation: Li et al. 2008), suppressed activity of meristems (sink limitation: Körner 1998; Streit et al. 2013) or both. Cold temperatures can also reduce soil nutrient availability because rates of nutrient mineralization are positively related to soil temperature (Salinas et al. 2011; Carbutt et al. 2013). It is difficult to disentangle direct effects of cold limitation from indirect effects of nutrient limitation to plant growth. For example, low soil temperatures depress root growth (Alvarez-Uria and Körner 2007) and also decrease
nutrient uptake rates (Boczulak et al. 2014). The nutrient status of root tissues can trigger a feed-back mechanism for controlling nutrient uptake which indirectly regulates plant growth (Gessler et al. 2002). On the other hand, the nutrient status of plant tissues may depend on other sources besides root uptake of readily available, i.e. mineralized, nutrient com-pounds. Plants can acquire notable amounts of major nutri-ents through mycorrhizal fungi, that access organic nitrogen (N) compounds (Hyodo et al. 2013) or scavenge recalcitrant phosphorus (P) species in the soil (Lambers et al. 2008).
Although upslope reduction in air and soil temperature represents a general feature in mountains (Körner 2008), altitude represents a complex gradient (Körner 2007) in which individual factors can interact with each other in a non-linear way. For example, relationships between nutrient
mineralization and thermal regime can vary in relation to soil moisture content (Marrs et al. 1988). Mycorrhizal infection, as a putative adaptation to nutrient deficiency, tends to increase with increasing altitude. On the other hand, the activity of mycorrhizal fungi can be even stimulated by increased tem-perature (Kytöviita and Ruotsalainen 2007). Some studies reported increasing concentrations of foliar nutrients, espe-cially N, as altitude increases (see, e.g. Morecroft et al. 1992; Peng et al. 2012). Such increases in nutrient concentrations with increasing altitude have been regarded as a side effect of reduced biomass production with increasing altitude. This would give support to direct effects of cold limitation as the main cause affecting foliar nutrient concentrations in moun-tains. However, cold limitation may largely depend on other factors such as plant functional type (PFT), soil water con-tent (SWC) and soil nutrient availability. For example, Körner et al. (1986) found foliar N concentrations to increase with increasing altitude in herbaceous plants but not in evergreen woody plants in New Zealand, which suggests that plant responses to temperature and/or associated environmental factors may vary depending on PFT. Diaz et al. (1996) did not observe any significant effect of altitude on N concentra-tions in leaves of Clusiaceae in Venezuela probably because of interactions between nutrient availability and SWC. Similarly, foliar nutrient concentrations in an evergreen oak species in south-western China peak at intermediate altitude where the plants achieve maximum nutrient use efficiency without lowering water use efficiency (Li et al. 2009). Foliar nutrient concentrations can even decline with increasing altitude, e.g. in conifer trees in North America (Hultine and Marshall 2000) or in species belonging to different PFTs in tropical-montane forest in Ecuador (Soethe et al. 2008). These latter findings point to indirect effects of cold temperatures, possibly related to temperature limitations of soil microbial activity, on foliar nutrient concentrations at high altitude.
Availability of mineral nutrients also depends on geo-chemical processes of mineral weathering. The latter are closely related to the nature of the underlying parent mate-rial, which controls important aspects of soil chemistry, especially pH. Therefore, the nature of the parent mate-rial plays a major role as a source of primarily rock-derived nutrients such as phosphorus (P) and potassium (Castle and Neff 2009; Porder and Ramachandran 2013). As an effect, complex patterns of foliar nutrient concentrations can take place across altitudinal gradients in mountains (Kitayama and Aiba 2002; Porder and Chadwick 2009; Anic et al. 2010) with possible additional inter-relations with ecological fac-tors such as light and/or water (Luo et al. 2004). In this paper, we analyzed growth rates and nutrient concentra-tions in leaves of five species, each belonging to a different PFT, across altitudinal gradients on two different bedrock types. We focused our attention on N and P as the elements most commonly limiting plant growth in terrestrial ecosys-tems (Vitousek et al. 2010). Our objective was to test the following hypotheses.
(i) Foliar nutrient status is primarily determined by temper-ature-dependent growth limitation. If so, we expect foliar nutrient concentrations to increase and leaf growth rates to decline regularly across altitudinal gradients.
(ii) Foliar nutrient status is primarily determined by temper-ature-dependent nutrient limitation through reduced soil microbial activity. If so, we expect nutrient concentrations to decrease consistently across altitudinal gradients unre-lated to growth rates and parent material.
(iii) Foliar nutrient status is primarily determined by (bio) geochemical controls on soil nutrient availability. If so, we expect nutrient concentrations to vary differently across altitudinal gradients depending on parent mate-rial. In this case, foliar growth rates may present varying relationships with foliar N or P concentrations depending on which of the two nutrients are most limiting to plant growth.
MAtERIALS AND MEtHODS
Sampling design and sampling sites
The focal point of our study was to analyze altitudinal pat-terns of leaf growth and foliar nutrient status in plant spe-cies each belonging to a different PFT. As individual spespe-cies within a PFT may differ considerably in foliar nutrient con-centrations with additional variation being associated to local environmental factors (Bombonato et al. 2010), our sampling strategy was based on selecting species all occurring across the whole gradient on both parent materials at environmentally comparable sites. During preliminary surveys we realized that very few species can be actually found both on carbonate and silicate bedrocks across a rather wide altitudinal gradient as ours. We eventually chose five species all of them occur-ring with medium to high frequency over the whole gradi-ent: Vaccinium myrtillus (V. myrtillus), a deciduous dwarf shrub;
Vaccinium vitis-idaea (V. vitis-idaea), an evergreen shrub; Picea excelsa (P. excelsa), a conifer tree; Homogyne alpina (H. alpina),
a wintergreen forb; and Calamagrostis villosa (C. villosa), a grass. All five species currently form mycorrhizal associations with different kinds of fungal partners: ericoid mycorrhizas (ErM) in V. myrtillus and V. vitis-idaea; ectomycorrhizal (ECM) in P. excelsa; arbuscular mycorrhiza (AM) in H. alpina and
C. villosa (Harley and Harley 1987).
Sampling was carried out in two areas in the western part of the Dolomites (southern Alps, province of Trento, Italy). The first area was located in Val San Nicolò (46°25′N, 11°43′E) on carbonate bedrock (dolomite and limestone). The second area was located in Val Cadino (46°13′N, 11°27′E) on silicate bedrock (granitic porphyry). Six sampling sites were set up in each of the two areas. The six sites were located at ca. 200 m intervals, so that each of the two altitudinal transects spanned a ca. 1000 m wide altitudinal range (ca. 1200–2200 m). All sites had moderate slope angle (20° on average), northern aspect and no evident signs of disturbance. Mean air tem-perature during the period May–July 2011 ranged from 14°C
at 1000 m to 7.7°C at 2200 m, with a vertical temperature lapse of 0.52°C per 100 m altitude. Total precipitation dur-ing the same period was ca. 470 mm at the low-altitude sites and ca. 450 mm at the high-altitude sites ( http://www.mete-otrentino.it/dati-meteo/stazioni; http://www.arpa.veneto. it/dati-ambientali/open-data/clima). The soil temperatures during the same period ranged from ca. 9°C at 1200 m to ca. 5°C at 2200 m (see online supplementary material, Appendix 1). The vertical temperature lapse for soil temperatures was somewhat higher in the carbonate sites (0.44°C per 100 m altitude) than in the silicate sites (0.32°C). We did not deter-mine SWC during sampling. However, we did measure SWC at the top of the growing season of 2016 when precipitation during May–July was almost the same compared with May– July 2011 (ca. 450 mm at the low-altitude sites and ca 460 mm at the high-altitude sites). The relative water content in the soil was ca. 23% on average and did not change either with altitude or with bedrock (see online supplementary material, Appendix 2).
The sites from 1200 to 1800 m were located in closed spruce forests. The sites at 2000 m were located in more open spruce forests, close to the treeline. The sites at 2200 m were located above the treeline in subalpine scrubs with sparse trees. The soils were always characterized by a fine grained organic layer (mean depth ca. 10 cm) and an underlying min-eral layer richer in coarser material. At all sites, the ground was covered by a well-developed moss layer (moss cover > 60%), with Rhytidiadelphus triqueter, Hylocomium splendens and
Pleurozium schreberi as the dominant species. The sites had an
area of ca. 1 ha. In each of them we randomly set up five 5 × 5 m plots, at least 15 m apart, for sampling.
Sampling
In spring 2011, we surveyed all sites at 2–3 days intervals in order to monitor the start of leaf growth for the five species in each site. Current-year leaves were sampled during two days (1–2 August 2011). On those dates, deciduous leaves had totally stopped growth while evergreen and wintergreen leaves probably still kept on growing especially at the high-altitude sites. Nonetheless, we decided to sample all leaves in that period because the leaves usually are heavily browsed by herbivores from early August onwards so that sampling later in the season would preclude measurements of both growth and nutrient concentrations (Kaarlejärvi et al. 2013). However, in order to account for possible underestimations of total growth, we adjusted all growth measurements by calcu-lating daily growth rates based on the time elapsed between growth start and sampling (see online supplementary mate-rial, Appendix 3).
Sampling was carried out as follows in each of the five plots in the 12 sites. For V. myrtillus and V. vitis-idaea, we col-lected 10 fully expanded leaves, each taken from a different current-year shoot (usually the fourth leaf from the apex). For P. excelsa, we collected all leaves from four current-year shoots each taken at breast height, at different orientation,
each from a different tree. For H. alpina, which has only leaves as aboveground organs, we collected 10 current-year leaves at least 50 cm apart. For C. villosa, we collected 10 fully expanded leaves each from a different culm (the third or the fourth leaf from the apex). On the same occasion, we col-lected soil samples in all plots. The soil was sampled from the top 5-cm organic layer, using a stainless steel cylindric corer (inner diameter 6.6 cm). In each plot, we took five subsam-ples that were then bulked in a composite sample.
Laboratory analyses
The leaf samples were oven-dried at 40°C for 48 h. A subsam-ple of additional leaves was oven-dried at 105°C and weighed to determine the mass loss between 40°C and 105°C. Foliar growth was expressed as daily growth rate per individual leaf. Fifty milligrams of the leaves used for determining growth rates were powdered, extracted in 3 ml of selenous H2SO4 at 420°C and analyzed for total N concentrations by the salicy-late method and total P concentration by the molybdenum blue method using a continuous flow autoanalyzer (FlowSys; Systea, Anagni, Italy).
The soil samples were air-dried prior to the analyses. A sub-sample of 5 g was used for determining soil pH in a 1:20 aque-ous solution. A subsample of 0.1 g was extracted and analyzed for total N as for the leaves and the litter. A subsample of 20 g was extracted in 200 ml of 0.5 M K2SO4 and analyzed for NH4 by the salicylate method and for NO3 by the cadmium reduction method. A subsample of 1 g was extracted in 1:10 (soil to solution) 0.5 M K2SO4 for determining total dissolved nitrogen (TDN). TDN was analyzed by the cadmium reduc-tion method after digesreduc-tion with an oxidant reagent contain-ing a buffer solution of boric acid (H3BO3), sodium hydroxide (NaOH) and potassium persulfate (K2S2O8). Dissolved organic nitrogen (DON) was calculated by subtracting the sum of dis-solved inorganic nitrogen fractions (NO3 + NH4) from TDN.
A subsample of 0.5 g was sequentially extracted for deter-mining soil P fractions (Kitayama et al. 2000). Different solu-tions (30 ml each) were used in the following steps:
- 0.5 M NaHCO3 adjusted to pH 8.5 with NaOH; - 0.1 M NaOH;
- 1 M HCl;
- concentrated H2SO4.
The extracts of the NaHCO3, NaOH and HCl solutions con-tained both inorganic (Pi) and organic (Po) P fractions. At each of the first three steps (NaHCO3, NaOH and HCl), Pi was determined by the molybdenum blue method while total P was determined after digesting a subsample of the extract with acidified potassium persulfate (K2S2O8) in order to con-vert Po into Pi. At each of these three steps, Po concentra-tion was calculated by subtracting Pi from total P. Only total P was determined, as above, in the concentrated H2SO4 digest. Concentration of residual P (P res) was calculated by subtract-ing the sum of total P in the (NaHCO3 + NaOH + HCl) solu-tions from total P in the concentrated H2SO4 digest.
A subsample of 0.5 g was extracted in concentrated H2SO4 and used for determining total Ca concentration by flame atomic absorption spectrophotometry (Solar 969, Unicam, Cambridge, UK). A subsample of 0.5 g was extracted in 0.2 M acid ammonium oxalate to pH 3, filtered (0.45 µm mesh) and used for determining concentrations of oxalate-extractable Fe and Al by ICP-MS (Thermo X-Series equipped with CCTED; Thermo Fisher Scientific, Bremen, Germany). A subsample of 1 g was oven-dried at 105°C and weighed to determine the mass loss between air-dried and oven-dried material. A sub-sample of 20 mg was used for analyzing total carbon (C) by a Shimadzu TOC-5000A (Shimadzu Corporation; Kyoto, Japan), connected with a solid sample module (Shimadzu SSM-5000A).
Nitrogen isotopic discrimination was assessed by deter-mining 15N content both in soils and leaves. The measure-ments were carried out by an elemental analyzer (EA 1110, Carlo Erba, Milan, Italy) coupled online with an isotope ratio mass spectrometer (delta Plus XP, ThermoFinnigan, Bremen, Germany). The values were expressed as δ 15N:
δ15N −1 1000
sample standard
( ) ((‰ = R /R ) )´
where Rsample is the 15N/14N ratio in the sample and Rstandard the 15N/14N ratio in the standard (atmospheric N
2).
Statistics
The soil chemistry data were analyzed by a multivariate statistic method (principal component analysis; PCA). The analysis was based on the correlation matrix among the 15 soil chemistry variables which provided centred standardized scores for varia-bles and plots, after scaling to unit variance all variable vectors. The data on foliar chemistry were analyzed by three-way factorial analyses of variance with species, altitude, bedrock and their interactions as fixed factors. All data were log-trans-formed when not meeting the assumption of variance normal-ity as assessed by the Kolmogorov–Smirnov test. Significance of differences among means were assessed using the Fishers’s LSD post-hoc test. The data on leaf growth were analyzed by linear regressions of the mean values (N = 5) of each variable against altitude in the six sites across the gradients. Linear regressions were run for foliar chemistry variables as well. The regressions were run separately for the two transects and significance of differences between bedrock types was assessed by Student’s t tests. The statistical computations were carried out using the package STATISTICA (Release 6; StatSoft Inc.©, Tulsa, OK, USA).
RESULtS
Soil chemistry
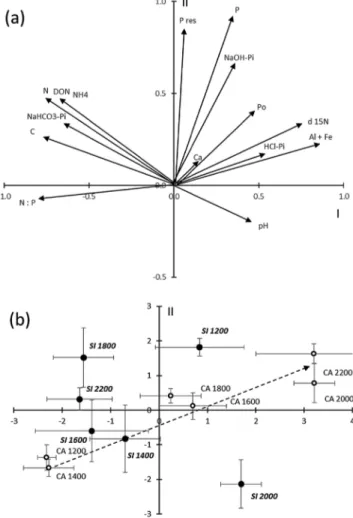
Bedrock geology strongly affected soil chemistry, with rather few soil chemical variables presenting consistent altitudinal patterns on the two parent materials (see online supplemen-tary material, Appendix 4). The results of the PCA mirrored the relationships among soil chemistry variables (Fig. 1a).
Carbon, total N, DON, NH4, NaHCO3-Pi and N:P presented positive correlations with each other (see online supple-mentary material, Appendix 5) and were hence grouped in the left-hand side of the PCA diagram (Fig. 1a). All other variables were located in the right part of the diagram as an effect of their mutual positive correlations (Fig. 1a). In particular, total P concentrations presented significant posi-tive correlations with Po and with all Pi fractions except NaHCO3-Pi (see online supplementary material, Appendix 5). NaOH-Pi was positively correlated with Al + Fe and with Po (see online supplementary material, Appendix 5). HCl-Pi was positively correlated with Ca and with Al + Fe (see online supplementary material, Appendix 5). Soil δ 15N was negatively correlated with both soil total N concentra-tion and soil C concentraconcentra-tion but was positively correlated with all P fractions except NaHCO3-Pi and with Ca and Al + Fe concentrations and pH as well (see online supplementary material, Appendix 5).
The ordination of the plot centroids in the PCA diagram indicated that soil chemistry changed regularly across the alti-tudinal gradient on carbonate bedrock (Fig. 1b). That gradient was principally characterized by increasing concentrations of all P fractions, with the only exception of NaHCO3-Pi, and by increasing soil δ 15N (Fig. 1b). In contrast, there were no consistent changes in soil chemistry across the altitudinal gra-dient on silicate bedrock (Fig. 1b).
Foliar chemistry
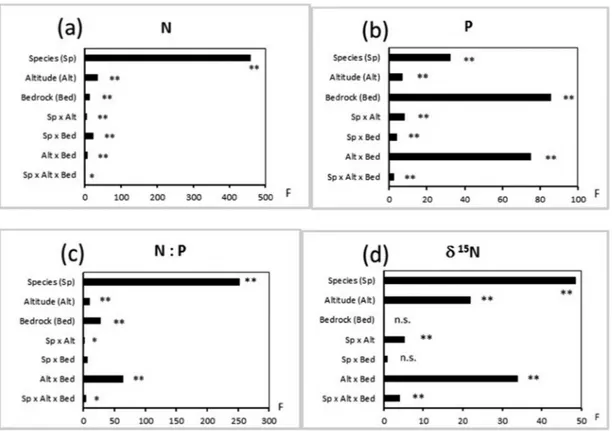
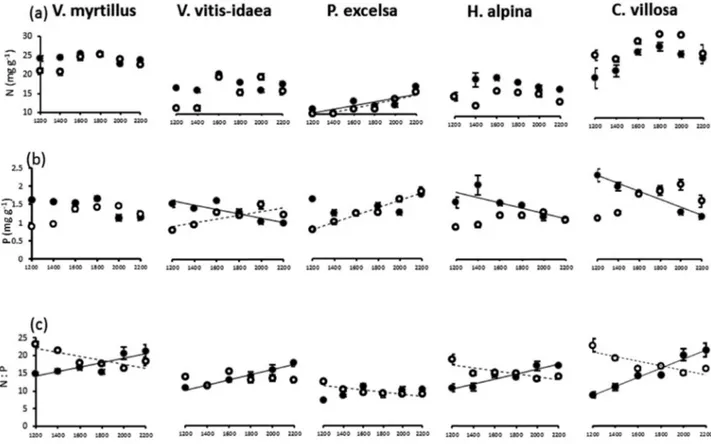
The five species differed strongly in terms of foliar N concen-tration. Species identity accounted for 83% of the explained variance in foliar N concentration, while altitude, bedrock and their interactions with species identity explained only a minor fraction of variance (Fig. 2a). Only in P. excelsa did foliar N con-centrations increase with altitude on both parent materials while in the other species there was no consistent altitudinal trend of foliar N concentrations (Fig. 3a). Foliar P concentra-tion also differed significantly among species but foliar P con-centration was strongly affected by bedrock, which accounted for a larger fraction of the explained variation than species identity (40% vs. 15%, respectively; Fig. 2b). Altitude × bedrock interaction also contributed considerably (35%) to the explained variance, with modest interactions with species identity (Fig. 2b). In fact, foliar P concentrations in all spe-cies declined consistently with altitude on silicate bedrock and increased more or less regularly with altitude on carbonate bedrock (Fig. 3b).
The foliar N:P varied much with species. Indeed, spe-cies identity accounted for 69% of the explained variance (Fig. 2c). Bedrock and altitude × bedrock interaction also accounted for a relatively high fraction of the explained variance (25% in total), with poor interactions with species identity (Fig. 2c). Indeed, the foliar N:P decreased on carbon-ate bedrock and increased on siliccarbon-ate bedrock across the alti-tudinal gradient in all species, generally with a linear trend (Fig. 3c). The foliar δ 15N was always negative (Table 1).
Altitude + altitude × bedrock interaction contributed more than species identity to the explained variance (50% vs. 42%, respectively) in foliar δ 15N while interactions with species identity were overall poor (Fig. 2d). On carbonate bedrock, the foliar δ 15N generally increased, i.e. became less negative, from 1200 to 1800–2000 m and decreased again at 2200. On silicate bedrock, the foliar δ 15N decreased more or less regularly with increasing altitude in all species except
C. villosa that presented an erratic trend across the gradient
(Table 1). The δ 15N
(leaf–soil) difference varied strongly with
altitude in all species (P < 0.001). Conversely, there were no main effects of bedrock on the δ 15N
(leaf–soil) difference for any
species. The δ 15N
(leaf–soil) difference was lowest at the highest
sites (2000 and 2200 m) on both bedrock types for all spe-cies except C. villosa that presented an erratic trend in the δ
15N
(leaf–soil) difference across the gradient on silicate bedrock
(Table 1). This resulted in a significant (P < 0.001) altitude × bedrock interaction for C. villosa.
Leaf growth
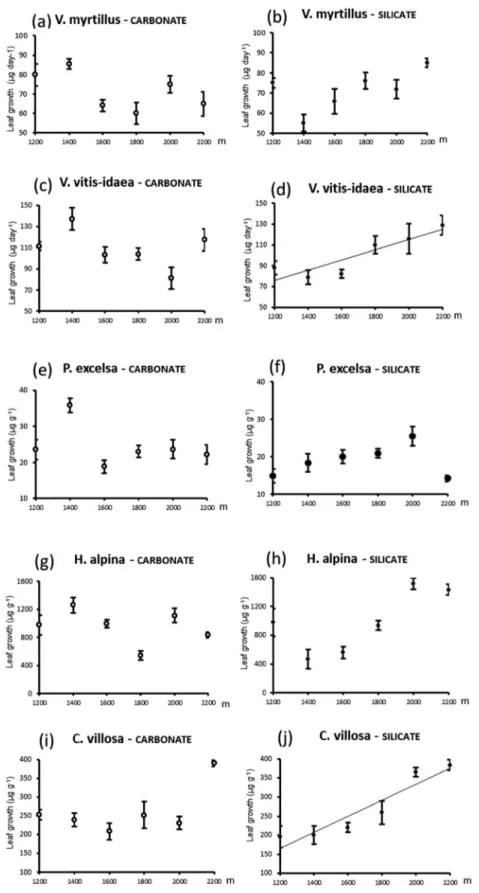
Parent material exerted an overall poor main effect on leaf growth rates, as bedrock significantly influenced leaf growth only in P. excelsa that grew more (P < 0.001) on carbonate bed-rock (Fig. 4e and f). Leaf growth in all species showed differ-ing patterns across the gradient on the two parent materials. Leaf growth rates of all species increased with increasing alti-tude on silicate bedrock, although this trend was linear only for V. vitis-idaea and C. villosa (Fig. 4d and j). In contrast, leaf growth of all species except C. villosa (Fig. 4i and j) tended to decline, although rather erratically, with increasing altitude on carbonate bedrock (Fig. 4a, c, e and g).
Leaf growth rate was negatively correlated with foliar N concentration in all species except C. villosa and even more strongly negatively correlated with foliar P concentration in all five species (Table 2). Consequently, leaf growth rate presented a significant positive correlation with foliar N:P in V. myrtillus, P. excelsa, H. alpina and C. villosa and a weakly (P = 0.07) significant positive correlation with foliar N:P in
V. vitis-idaea. Leaf growth rate was negatively correlated with
foliar δ 15N in V. vitis-idaea, P. excelsa and H. alpina (Table 2).
DIScUSSION
Temperature-dependent leaf growth limitation (hypothesis 1)
There was no evidence of consistent changes in leaf growth rates of the five species across the altitudinal gradients. Only in the conifer tree P. excelsa did leaf growth rates decline at the uppermost sites especially on silicate bedrock. This suggests a threshold effect of temperature that hampers growth of high stature plants above the natural treeline (Paulsen and Körner 2014). In contrast, leaf growth of dwarf shrubs and herbs generally did not decrease, and in some cases even increased with increasing altitude because these species are less prone to temperature-dependent growth limitation thanks to their small stature (Körner 2008). Several studies reported high vegetative growth performances at high altitudes for low-stature plants unless growth was limited by environmental factors such as nutrient availability (Luo et al. 2004) or water availability (He et al. 2014a). In particular, leaf growth rates of C. villosa were highest at high-altitude sites in sparse forests (2000 m on silicate bedrock) or scrubs above treeline (2200 m on both bedrock types), compared with dense forests at lower altitudes where leaf growth of C. villosa was probably limited by insufficient light supply (Patsias and Bruelheide 2013).
In summary, our study did not reveal any consistent trend of leaf growth rates across altitudinal gradients on the two bedrock types. This leads us to exclude direct effects of cold temperature on leaf growth (hypothesis 1).
Figure 1: scores of soil chemistry variables and sampling plots on the
first two PCA axes accounting for 36.5% (I axis) and 18.1% (II axis) of total variance, respectively. The scores of the soil chemistry vari-ables are shown in (a) where the arrows indicate increasing values of
each variable along the two PCA axes. The means (±SE) of the plot score centroids at different altitudes on the two bedrocks (CA = car-bonate, empty symbols, normal characters; SI = silicate, full symbols, italics) are shown in (b) where the dashed arrow indicates ordination
of the plot centroids along an altitudinal gradient on carbonate bed-rock. Abbreviation: SE = standard error.
Growth limitation through reduced mineralization rates (hypothesis 2)
NH4 and NaHCO3-Pi represent the most readily available forms of N and P, respectively. The NH4 occurring in the soil solution results from N mineralization by soil microbes while NaHCO3-Pi is comprised of both mineralized and eas-ily mineralizable Pi forms (Vincent et al. 2014). NH4 and NaHCO3-Pi concentrations presented different altitudinal trends as NaHCO3-Pi concentrations decreased with increas-ing altitude, especially at the high-altitude sites, while NH4 concentrations did not. However, the altitudinal trends in NH4 and NaHCO3-Pi concentrations were much similar on the two parent materials. This suggests that the biogeochemi-cal processes responsible for N and P mineralization possess different sensitivity to temperature, as observed in previous studies. Experimental warming of arctic (Aerts et al. 2012) or alpine (Rui et al. 2012) soils greatly enhanced P mineralization rates. Vincent et al. (2014) observed decreasing concentrations of labile P compounds across an altitudinal gradient in a sub-arctic mountainous region. Conversely, relationships between concentrations of mineral N compounds, especially NH4, and temperature in soils of cold regions are not straightforward as higher temperatures can even result in negative net N min-eralization rates because of increased competition for N with soil microorganisms (He et al. 2014b). Bonito et al. (2003) found increasing N mineralization rates across an altitudinal
gradient in the southern Appalachians probably because of the larger N pools stored in high elevation soils. Interestingly, Bárta et al. (2014) observed lower temperature sensitivity for the enzyme aminopeptidase, responsible for N mineralization compared with phosphatase, responsible for P mineralization, in forest soils.
The overall negative correlations between leaf growth rates and foliar N and P concentrations mean that both nutrients were diluted in the leaf mass when the leaves grew more actively. However, P was diluted more than N which resulted in an overall positive correlations between leaf growth rates and foliar N:P. This contrasts with the assumption of the growth rate hypothesis, stating that N:P ratios tend to decrease in support of fast growth rates because of increased allocation to P-rich ribosomes and rRNA (Elser et al. 2000). Several stud-ies did not find negative correlations between growth rates and foliar N:P ratios in different plant species and ecosystems. In particular, foliar N:P can be decoupled from growth when non-limiting nutrients are taken up in excess of plant demand for metabolic processes and protein synthesis (Elser et al. 2010). The positive relationships between leaf growth and foliar N:P suggest that leaf growth primarily was N-limited, as usu-ally happens on young soils in cold ecosystems (Reich and Oleksyn 2004). However, should leaf growth be limited by insufficient availability of readily available mineral P com-pounds this would imply consistent trends of leaf growth and
Figure 2: results of three-way factorial ANOVAs for N concentration (a), P concentration (b), N: P ratio (c) and δ 15N (d) in leaves of five
spe-cies across altitudinal gradients on carbonate bedrock and silicate bedrock. Abbreviations and d.o.f. are: spespe-cies (Sp; 4,240); altitude (Alt; 5,240); bedrock (Bed; 1,240); sp × alt (20,240); sp × bed (4,240); alt × bed (5,240); sp × alt × bed (20,240). Abbreviation: ANOVA = analysis of variance.
foliar nutrient concentrations independent of plant material. This was not our case, so that we exclude indirect effects of temperature-dependent nutrient limitation on leaf growth (hypothesis 2).
Effects of bedrock geology across the altitudinal gradient (hypothesis 3)
Labile inorganic forms of N and P (NH4 and NaHCO3-Pi, respectively), readily available for plant uptake, represented a minor fraction of the soil nutrient pools on both parent mate-rials. There is indirect evidence that the plants could access more recalcitrant, organic or inorganic nutrient compounds, mainly owing to the activity of their mycorrhizal associates. On one hand, the foliar δ 15N signatures of all species gen-erally were considerably more negative than the soil δ 15N signature, thus indicating isotopic discrimination during N absorption by plants. Poor, if any, isotopic discrimination occurs during NH4 absorption by plant roots (Högberg 1997) while absorption of soluble organic N compounds, especially
through associated mycorrhizal fungi, implies strong 15N depletion in the plant tissues (Hobbie and Colpaert 2003). This suggests that most of the N supply to our plants was pro-vided by dissolved N-containing organic compounds. This is in line with the results of several studies suggesting that foliar δ 15N can be regarded as an index of N availability both at local and regional scale (see Craine et al. 2009 for review). If soil N availability decreases, mycorrhizal fungi trans-fer a lower proportion of N to the host plants (Hobbie et al. 2000). On the other hand, both NaOH-Pi and HCl-Pi can be solubilized by plants through their mycorrhizal associations (Cairney 2011). Mycorrhizal plants are also able to utilize Po by hydrolyzing organic compounds. Production of extracel-lular phosphatases has been demonstrated in a wide range of mycorrhizal fungi: ECM (Antibus et al. 1992), ErM (Gibson and Mitchell 2005) and AM (Koide and Kabir 2000). Po was in turn positively correlated with both NaOH-Pi and soil total P, as observed in other studies (Turner and Engelbrecht 2011). Therefore, phosphates and Po that can be solubilized or
Figure 3: mean (±1SE) values of N concentration (a), P concentration (b) and N: P (c) in leaves of five species across altitudinal gradients on
carbonate bedrock (empty symbols, dashed arrows) and silicate bedrock (full symbols, full arrows). Significant (P < 0.05) linear regressions of the means against altitude are: N—P. excelsa on carbonate bedrock (N = 2.29 + 0.0058 × Altitude; r2 = 0.87); P. excelsa on silicate bedrock (N = 4.12
+ 0.0051 × Altitude; r2 = 0.59). P—V. vitis-idaea on carbonate bedrock (P = 0.31 + 0.0006 × Altitude; r2 = 0.61); V. vitis-idaea on silicate bedrock
(P = 2.56 − 0.0007 × Altitude; r2 = 0.75); P. excelsa on carbonate bedrock (P = −0.44 + 0.0011 × Altitude; r2 = 0.97); H. alpina on silicate bedrock
(P = 2.74 − 0.0007 × Altitude; r2 = 0.62); C. villosa on silicate bedrock (P = 3.55 − 0.0011 × Altitude; r2 = 0.89). N: P—V. myrtillus on carbonate
bedrock (N:P = 28.79 − 0.0056 × Altitude; r2 = 0.66); V. myrtillus on silicate bedrock (N:P = 6.22 + 0.0066 × Altitude; r2 = 0.75); V. vitis-idaea on
silicate bedrock (N:P = 1.47 + 0.0068 × Altitude; r2 = 0.98); P. excelsa on carbonate bedrock (N:P = 13.33 − 0.0027 × Altitude; r2 = 0.71); H. alpina
on carbonate bedrock (N:P = 20.49 − 0.0039 × Altitude; r2 = 0.67); H. alpina on silicate bedrock (N:P = 2.08 + 0.0063 × Altitude; r2 = 0.89); C. vil-losa on carbonate bedrock (N:P = 28.19 − 0.0063 × Altitude; r2 = 0.71); C. villosa on silicate bedrock (N:P = −6.93 + 0.0128 × Altitude; r2 = 0.95).
Abbreviation: SE = standard error.
T
able 1:
Mean (±1 SE) values of foliar chemistry variables across altitudinal gradients on different bedrocks
δ 15N leaf V. myrtillus V. vitis-idaea P.excelsa H. alpina C. villosa Carbonate Silicate Carbonate Silicate Carbonate Silicate Carbonate Silicate Carbonate Silicate 1200 m −6.58 ± 0.45 c −1.75 ± 0.29 a −6.23 ± 0.20 bc −2.73 ± 0.37 a −6.27 ± 0.43 a −3.69 ± 0.24 a −8.06 ± 0.79 c −3.63 ± 0.40 c −4.73 ± 0.50 bcd −4.46 ± 0.17 ab 1400 m −5.88 ± 0.21 bc −5.08 ± 0.22 b −7.51 ± 0.11 c −5.58 ± 0.24 b −9.31 ± 0.54 b −5.82 ± 0.35 b −7.15 ± 0.35 c −4.74 ± 0.66 a −5.65 ± 0.38 d −5.68 ± 0.24 b 1600 m −4.08 ± 0.34 ab −4.07 ± 0.56 b −5.18 ± 0.10 ab −5.54 ± 0.19 b −6.19 ± 0.44 a −5.74 ± 0.56 b −3.66 ± 0.36 a −5.20 ± 0.38 ab −2.53 ± 0.13 a −3.65 ± 0.66 a 1800 m −3.59 ± 0.56 ab −4.82 ± 0.23 b −4.02 ± 0.57 a −6.35 ± 0.07 b −4.67 ± 0.29 a −5.80 ± 0.27 b −4.65 ± 0.28 ab −7.22 ± 0.48 bc −3.18 ± 0.24 abc −3.76 ± 0.20 ab 2000 m −3.06 ± 0.46 a −5.52 ± 0.87 b −3.76 ± 0.25 a −6.63 ± 1.06 b −4.41 ± 0.42 a −6.32 ± 0.39 b −6.21 ± 0.47 bc −7.12 ± 0.58 bc −3.10 ± 0.51 ab −5.00 ± 0.57 ab 2200 m −5.32 ± 0.86 abc −5.79 ± 0.42 b −6.80 ± 0.94 bc −6.95 ± 0.66 b −5.63 ± 0.67 a −7.39 ± 0.36 b −7.62 ± 0.52 c −7.62 ± 0.52 c −4.95 ± 0.31 cd −3.13 ± 0.50 a δ 15N (leaf–soil) V. myrtillus V. vitis-idaea P.excelsa H. alpine C. villosa Carbonate Silicate Carbonate Silicate Carbonate Silicate Carbonate Silicate Carbonate Silicate 1200 m −2.97 ± 0.33 a −1.85 ± 0.72 a −2.62 ± 0.17 a −2.82 ± 0.84 a −2.66 ± 0.36 a −3.79 ± 0.68 a −4.46 ± 0.61 a n.d. −1.12 ± 1.54 a −4.56 ± 1.35 a 1400 m −2.25 ± 0.34 a −1.91 ± 0.27 a −3.88 ± 0.41 ab −2.40 ± 0.43 a −5.67 ± 0.66 bc −2.65 ± 0.49 a −3.52 ± 0.32 a −1.56 ± 0.74 a −2.02 ± 1.10 a −2.50 ± 0.92 b 1600 m −3.47 ± 0.98 a −1.61 ± 1.05 a −4.57 ± 0.59 ab −3.08 ± 0.76 a −5.58 ± 0.46 bc −3.28 ± 1.08 a −3.05 ± 0.82 a −2.74 ± 0.77 a −1.92 ± 1.73 a −1.19 ± 1.46 b 1800 m −2.56 ± 0.86 a −2.35 ± 0.47 a −3.07 ± 0.89 a −3.89 ± 0.49 a −3.72 ± 0.50 ab −3.33 ± 0.54 a −3.71 ± 0.69 a −4.75 ± 0.47 a −2.23 ± 1.33 a −1.29 ± 1.13 b 2000 m −4.97 ± 0.41 b −5.61 ± 1.08 b −5.67 ± 0.52 b −6.71 ± 1.25 b −6.32 ± 0.71 c −6.41 ± 0.37 b −8.12 ± 0.67 b −7.20 ± 0.72 b −5.01 ± 1.77 b −5.08 ± 1.62 a 2200 m −6.37 ± 1.45 b −5.39 ± 0.85 b −7.85 ± 1.05 c −6.55 ± 0.86 b −6.68 ± 1.30 c −6.99 ± 0.48 b −9.32 ± 0.68 b −7.22 ± 0.85 b −6.00 ± 2.13 b −2.73 ± 1.43 b W
ithin each column, the means followed by different letters differ significantly (
P
< 0.05) based on Fisher’
s LSD post-hoc tests. Abbreviations: n.d., not defined; SE, standard error
.
Figure 4: mean (±1SE) leaf growth rates for five species across altitudinal gradients on carbonate bedrock (empty symbols, dashed arrows) and
silicate bedrock (full symbols, full arrows). Significant (P < 0.05) linear regressions of the means against altitude are for V. vitis-idaea on silicate bedrock (leaf growth rate = 17.37 + 0.049 × Altitude; r2 = 0.80) and C. villosa on silicate bedrock (leaf growth rate = −87.30 + 0.21 × Altitude; r2 = 0.89). Abbreviation: SE = standard error.
hydrolyzed, respectively, by mycorrhizal partners appeared to be the main sources of P to our plants.
The main difference in soil chemistry across the altitudinal gradient on the two bedrock types consisted in the increas-ing concentrations of different soil P fractions, paralleled by a concomitant decline in soil C concentrations, across the gradient on carbonate bedrock. This means that the organic matter content in the soil decreased with increasing altitude on carbonate bedrock but not on silicate bedrock. Our data cannot provide a mechanistic explanation for the altitudinal patterns of soil P fractions on carbonate bedrock. However, some indirect support for suggesting possible causes can be drawn by soil δ 15N signature and soil Ca, Al and Fe con-centrations. The strongly negative correlations between soil δ 15N and soil total C concentration can suggest that bulk soil δ 15N reflects the degree of stabilization of soil organic matter (Craine et al. 2015). The higher, i.e. less negative, soil δ 15N values at high altitude on carbonate bedrock were related to lower C concentrations and the greater abundance of min-eral particles in the upper soil layer. On the other hand, soil δ 15N can also reflect SWC as soil δ 15N usually are higher in arid regions (Liu and Wang 2009). This may suggest that SWC decreased with increasing altitude on carbonate bed-rock. Although we did not observe any difference in SWC during humid periods, we cannot rule out the hypothesis that soil moisture in high-altitude carbonate soils is lower during dry periods because of faster infiltration. Indeed, infiltration capacity is strongly affected by soil organic C concentration (Fischer et al. 2015). Independent of the reason why the min-eral fraction was enriched at high-altitude sites on carbonate bedrock, the close association between some P fractions and mineral particles was clearly reflected in the positive correla-tion between soil Al + Fe and Ca concentracorrela-tions on one hand, and NaOH-Pi, HCl-Pi and Po on the other hand. Consistent with the correlations observed in our study, NaOH-Pi and Po are usually sorbed on the surface of Fe and Al minerals while HCl-Pi is incorporated in calcium phosphates (Crews et al. 1995; Giesler et al. 2005). All of these three P species can be absorbed by plants thanks to their mycorrhizal partners, as discussed above.
The strong difference between altitudinal patterns of leaf growth and nutrient concentrations on the two parent mate-rials emphasized the importance of bedrock geology as a
source of variation in foliar chemistry, which gives support to hypothesis 3. Concentrations of inorganic and, especially, organic N forms were similar across the gradient on both par-ent materials which met the species-specific plant N demand. In contrast, the varying concentrations of P compounds across the gradient on the two bedrock types resulted in an increas-ing P-concentration trend across the altitudinal gradient on carbonate bedrock and a decreasing P-concentration trend across the altitudinal gradient on silicate bedrock. When the plants absorbed P in excess of their metabolic demand this appeared to bring about stoichiometric imbalance between N and P content in the tissues (Peñuelas et al. 2013).
In conclusion, the varying patterns of leaf growth rates and nutrient concentrations across the altitudinal gradient in rela-tion to parent material indicate that bedrock geology interacts with altitude in controlling the foliar nutrient status mainly owing to availability of soil P and its effect on foliar nutrient stoichiometry.
SUPPLEMENtARY MAtERIAL
Supplementary material is available at Journal of Plant Ecology
online.
FUNDING
This study was funded by a grant of Ferrara University to R. Gerdol.
AcKNOWLEDGMENtS
M. Tomaselli and R. Tonin assisted during the field work. A. Di Matteo and R. Tassinari assisted during the laboratory work.
REFERENcES
Aerts R, Callaghan TV, Dorrepaal E, et al. (2012) Seasonal climate manipulations have only minor effects on litter decomposition rates and N dynamics but strong effects on litter P dynamics of sub-arctic bog species. Oecologia 170:809–19.
Alvarez-Uria P, Körner C (2007) Low temperature limits of root growth in deciduous and evergreen temperate tree species. Funct
Ecol 21:211–8.
Table 2: Pearson’s correlation coefficients (P-levels in parenthesis) of leaf growth rates with foliar chemistry and foliar δ 15N for five
species across altitudinal gradients on carbonate bedrock and silicate bedrock (N = 60)
V. myrtillus V. vitis-idaea P.excelsa H. alpina C. villosa
Foliar N concentration −0.28 (0.03)* −0.37 (0.003)** −0.28 (0.03)* −0.27 (0.03)* 0.12 (0.35) Foliar P concentration −0.41 (0.001)** −0.56 (<0.001)** −0.36 (0.004)** −0.46 (<0.001)** −0.36 (0.005)** Foliar N: P ratio 0.35 (0.006)** 0.24 (0.07) 0.26 (0.05)* 0.38 (0.003)** 0.41 (0.001)** Foliar δ 15N −0.09 (0.48) −0.39 (0.002)** −0.38 (0.003)** −0.35 (0.006)** −0.02 (0.88) *P values significant at α = 0.05. **P values significant at α = 0.01.
Anic V, Hinojosa LF, Díaz-Forester J, et al. (2010) Influence of soil chem-ical variables and altitude on the distribution of high-alpine plants: the case of the Andes of Central Chile. Arct Antarct Alp Res 42:152–63. Antibus RK, Sinsabuagh RL, Linkins AE (1992) Phosphatase activities
of phosphorus uptake from inositol phosphate by ectomycorrhizal fungi. Can J Bot 70:794–801.
Bárta J, Šlajsová P, Tahovská K, et al. (2014) Different temperature sensi-tivity and kinetics of soil enzymes indicate seasonal shifts in C, N and P nutrient stoichiometry in acid forest soil. Biogeochemistry 117:525–37. Boczulak SA, Hawkins BJ, Roy R (2014) Temperature effects on
nitrogen form uptake by seedling roots of three contrasting coni-fers. Tree Physiol 34:513–23.
Bombonato L, Siffi C, Gerdol R (2010) Variations in the foliar nutrient content of mire plants: effects of growth-form based grouping and habitat. Plant Ecol 211:235–51.
Bonito GM, Coleman DC, Haines BL, et al. (2003) Can nitrogen budg-ets explain differences in soil nitrogen mineralization rates of forest stands along an elevation gradient? Forest Ecol Manag 176:563–74. Cairney JWG (2011) Ectomycorrhizal fungi: the symbiotic route to
the root for phosphorus in forest soils. Plant Soil 344:51–71. Carbutt C, Edwards TJ, Fynn RWS, et al. (2013) Evidence for
tem-perature limitation of nitrogen mineralisation in the Drakensberg Alpine Centre. S Afr J Bot 88:447–54.
Castle SC, Neff JC (2009) Plant response to nutrient availability across variable bedrock geologies. Ecosystems 12:101–13.
Craine JM, Elmore AJ, Aidar MP, et al. (2009) Global patterns of foliar nitrogen isotopes and their relationships with climate, mycorrhizal fungi, foliar nutrient concentrations, and nitrogen availability. New
Phytol 183:980–92.
Craine JM, Towne EG, Miller M, et al. (2015) Climatic warming and the future of bison as grazers. Sci Rep 5:16738.
Crews TE, Kitayama K, Fownes JH, et al. (1995) Changes in soil phos-phorus fractions and ecosystem dynamics across a long chronose-quence in Hawaii. Ecology 76:1407–24.
Diaz M, Haag-Kerwer A, Wingfield R, et al. (1996) Relationships between carbon and hydrogen isotope ratios and nitrogen levels in leaves of Clusia species and two other Clusiaceae genera at various sites and different altitudes in Venezuela. Trees 10:351–8.
Elser JJ, Fagan WF, Kerkhoff AJ, et al. (2010) Biological stoichiometry of plant production: metabolism, scaling and ecological response to global change. New Phytol 186:593–608.
Elser JJ, Sterner RW, Gorokhova E, et al. (2000) Biological stoichiom-etry from genes to ecosystems. Ecol Lett 3:540–50.
Fischer C, Tischer J, Roscher C, et al. (2015) Plant species diversity affects infiltration capacity in an experimental grassland through changes in soil properties. Plant Soil 397:1–16.
Gessler A, Kreuzwieser J, Dopatka T, et al. (2002) Diurnal courses of ammonium net uptake by the roots of adult beech (Fagus sylvatica) and spruce (Picea abies) trees. Plant Soil 240:23–32.
Gibson BR, Mitchell DT (2005) Phosphatases of ericoid mycorrhizal fungi: kinetic properties and the effect of copper on activity. Mycol
Res 109:478–86.
Giesler R, Andersson T, Lövgren L, et al. (2005) Phosphate sorption in aluminum- and iron-rich humus soils. Soil Sci Soc Am J 69:77–86. Harley JL, Harley EL (1987) A check-list of mycorrhiza in the British
flora. New Phytol 105:1–102.
He Y, Kueffer C, Shi P, et al. (2014a) Variation of biomass and mor-phology of the cushion plant Androsace tapete along an elevational gradient in the Tibetan Plateau. Plant Spec Biol 29:E64–71. He Y, Xu X, Kueffer C, et al. (2014b) Leaf litter of a dominant cushion
plant shifts nitrogen mineralization to immobilization at high but not low temperature in an alpine meadow. Plant Soil 383:415–26. Hobbie EA, Colpaert JV (2003) Nitrogen availability and colonization
by mycorrhizal fungi correlate with nitrogen isotope patterns in plants. New Phytol 157:115–26.
Hobbie EA, Macko SA, Williams M (2000) Correlations between foliar
15N and nitrogen concentrations may indicate plant-mycorrhizal
interactions. Oecologia 122:273–83.
Högberg P (1997) 15N natural abundance in soil-plant systems. New Phytol 137:179–203.
Hultine KR, Marshall JD (2000) Altitude trends in conifer leaf morphology and stable carbon isotope composition. Oecologia
123:32–40.
Hyodo F, Kusaka S, Wardle DA, et al. (2013) Changes in stable nitro-gen and carbon isotope ratios of plants and soil across a boreal for-est fire chronosequence. Plant Soil 367:111–9.
Kaarlejärvi E, Eskelinen A, Olofsson J (2013) Herbivory prevents positive responses of lowland plants to warmer and more fertile conditions at high altitudes. Funct Ecol:27 1244–53.
Kitayama K, Aiba SI (2002) Ecosystem structure and productivity of tropical rain forests along altitudinal gradients with contrast-ing soil phosphorus pools on Mount Kinabalu, Borneo. J Ecol
90:37–51.
Kitayama K, Majalap-Lee N, Aiba SI (2000) Soil phosphorus fractiona-tion and phosphorus-use efficiencies of tropical rainforests along alti-tudinal gradients of Mount Kinabalu, Borneo. Oecologia 123:342–9. Koide RT, Kabir Z (2000) Extraradical hyphae of the mycorrhizal
fungus Glomus intraradices can hydrolyse organic phosphate. New
Phytol 148:511–7.
Körner C (1998) A re-assessment of high elevation treeline positions and their explanation. Oecologia 11:445–59.
Körner C. (2007) The use of ‘altitude’ in ecological research. Trends
Ecol Evol 22:569–74.
Körner C (2008) Winter crop growth at low temperature may hold the answer for alpine treeline formation. Plant Ecol Divers 1:3–11. Körner C, Bannister P, Mark AF (1986) Altitudinal variation in
sto-matal conductance, nitrogen content and leaf anatomy in different plant life forms in New Zealand. Oecologia 69:577–88.
Kytöviita MM, Ruotsalainen AL (2007) Mycorrhizal benefit in two low arctic herbs increases with increasing temperature. Am J Bot
94:1309–15.
Lambers H, Raven JA, Shaver GR, et al. (2008) Plant nutrient-acqui-sition strategies change with soil age. Trends Ecol Evol 23:95–103. Li C, Wu C, Duan B, et al. (2009) Age-related nutrient content and
carbon isotope composition in the leaves and branches of Quercus
aquifolioides along an altitudinal gradient. Trees 23:1109–21.
Li MH, Xiao WF, Wang SG, et al. (2008) Mobile carbohydrates in Himalayan treeline trees I. Evidence for carbon gain limitation but not for growth limitation. Tree Physiol 28:1287–96.
Liu WG, Wang Z (2009) Nitrogen isotopic composition of plant-soil in the Loess Plateau and its responding to environmental change.
Chinese Sci Bull 54:272–9.
Luo T, Pan Y, Ouyang H, et al. (2004) Leaf area index and net primary productivity along subtropical to alpine gradients in the Tibetan Plateau. Global Ecol Biogeogr 13:345–58.
Marrs RH, Proctor J, Heaney A, et al. (1988) Changes in soil nitrogen-mineralization and nitrification along an altitudinal transect in tropical rain forest in Costa Rica. J Ecol 76:466–82.
Morecroft MD, Woodward FI, Marrs RH (1992) Altitudinal trends in leaf nutrient contents, leaf size and δ13C of Alchemilla alpina. Funct Ecol 6:730–40.
Patsias K, Bruelheide H (2013) Climate change – Bad news for mon-tane forest herb layer species? Acta Oecol 50:10–9.
Paulsen J, Körner C (2014) A climate-based model to predict poten-tial treeline position around the globe. Alpine Botany 124:1–12. Peng G, Wu C, Xu X, et al. (2012) The age-related changes of leaf
structure and biochemistry in juvenile and mature subalpine fir trees (Abies faxoniana Rehder & E.H. Wilson) along an altitudinal gradient. Pol J Ecol 60:311–21.
Peñuelas J, Poulter B, Sardans J, et al. (2013) Human-induced nitro-gen-phosphorus imbalances alter natural and managed ecosystems across the globe. Nat Commun 4:2934.
Porder S, Chadwick OA (2009) Climate and soil-age constraints on nutrient uplift and retention by plants. Ecology 90:623–36. Porder S, Ramachandran S (2013) The phosphorus concentration of
common rocks—a potential driver of ecosystem P status. Plant Soil
367:41–55.
Reich PB, Oleksyn J (2004) Global patterns of plant leaf N and P in relation to temperature and latitude. Proc Natl Acad Sci USA
101:11001–6.
Rui Y, Wang W, Chen C, et al. (2012) Warming and grazing increase mineralization of organic P in an alpine meadow ecosystem of Qinghai-Tibet Plateau, China. Plant Soil 357:73–87.
Salinas N, Malhi Y, Meir P, et al. (2011) The sensitivity of tropical leaf litter decomposition to temperature: results from a large-scale leaf translocation experiment along an elevation gradient in Peruvian forests. New Phytol 189:967–77.
Soethe N, Lehmann J, Engels C (2008) Nutrient availability at differ-ent altitudes in a tropical montane forest in Ecuador. J Trop Ecol
24:397–406.
Streit K, Rinne KT, Hagedorn F, et al. (2013) Tracing fresh assimilates through Larix decidua exposed to elevated CO2 and soil
warm-ing at the alpine treeline uswarm-ing compound-specific stable isotope analysis. New Phytol 197:838–49.
Turner BL, Engelbrecht BMJ (2011) Soil organic phosphorus in low-land tropical rain forests. Biogeochemistry 103:297–315.
Vincent AG, Sundqvist MK, Wardle DA, et al. (2014) Bioavailable soil phosphorus decreases with increasing elevation in a subarctic tun-dra landscape. PLoS One 9:e92942.
Vitousek PM, Porder S, Houlton BZ, et al. (2010) Terrestrial phospho-rus limitation: mechanisms, implications, and nitrogen-phospho-rus interactions. Ecol Appl 20:5–15.