http://www.scirp.org/journal/me ISSN Online: 2152-7261
ISSN Print: 2152-7245
DOI: 10.4236/me.2017.88069 Aug. 4, 2017 995 Modern Economy
Dynamic Relationship of Commodities Prices
and EUR/USD Exchange Rate Trends in the
Recent Past
Michele Patanè
1, Mattia Tedesco
1, Stefano Zedda
21Department of Business and Law, School of Economics and Management, University of Siena, Siena, Italy 2Department of Business and Economics, University of Cagliari, Cagliari, Italy
Abstract
Gold and Oil have always had a central role within the international economy, and meet the interests of many investors, and in particular, speculators. The Euro introduction (1999) has added the Euro-Dollar exchange rate as a fur-ther main variable that the operators, investing on these commodities, have to consider when implementing their strategies. This paper analyzes the mutual relationship between commodities prices (gold and oil) and the Euro/Dollar exchange rate, within the time frame from 2004 to 2014, so to find which spe-cific variable can give significant information on the expected variation of other variables and on which time horizon. This can support the of investors’ choices on taking more effective speculative positions. Results obtained by means of a VAR model show some significant statistical relationship between the three variables on the short term (i.e. when considering daily data), but also some possible relationship on a longer term (monthly data), suggesting that oil prices can give significant information on the expected value of the Euro/Dollar exchange rate.
Keywords
Commodities, Euro/Dollar Exchange Rate, Relationship
1. Introduction
Gold and oil prices have always been two reference values for the international economy. Over the years their prices have been highly volatile. Consequently, gold and oil meet the interests of investors, but above all speculators.
From a theoretical point of view, gold price should increase during economic
How to cite this paper: Patanè, M., Tedesco, M. and Zedda, S. (2017) Dynamic Relationship of Commodities Prices and EUR/USD Exchange Rate Trends in the Recent Past. Modern Economy, 8, 995-1004. https://doi.org/10.4236/me.2017.88069 Received: July 6, 2017
Accepted: July 31, 2017 Published: August 4, 2017 Copyright © 2017 by authors and Scientific Research Publishing Inc. This work is licensed under the Creative Commons Attribution International License (CC BY 4.0).
http://creativecommons.org/licenses/by/4.0/ Open Access
DOI: 10.4236/me.2017.88069 996 Modern Economy
crises, and decrease in positive financial context. The opposite is expected for oil prices, as they are mainly linked to the industrial activity, thus positively corre-lated with the business cycle. The introduction of the euro in 1999 added the euro/dollar exchange rate as a further reference variable, and this induced the operators and speculators on international markets to include this variable in their models and in the implementation of their strategies.
The aim of this paper is to test for the existence of a long or short-term rela-tionship between the prices of gold, oil and the euro/dollar exchange rate, so to give significant information for making profitable investments in commodities, simply observing the dynamics of the euro/dollar exchange or, conversely, tak-ing positions on currencies, considertak-ing the price dynamics of the two commod-ities.
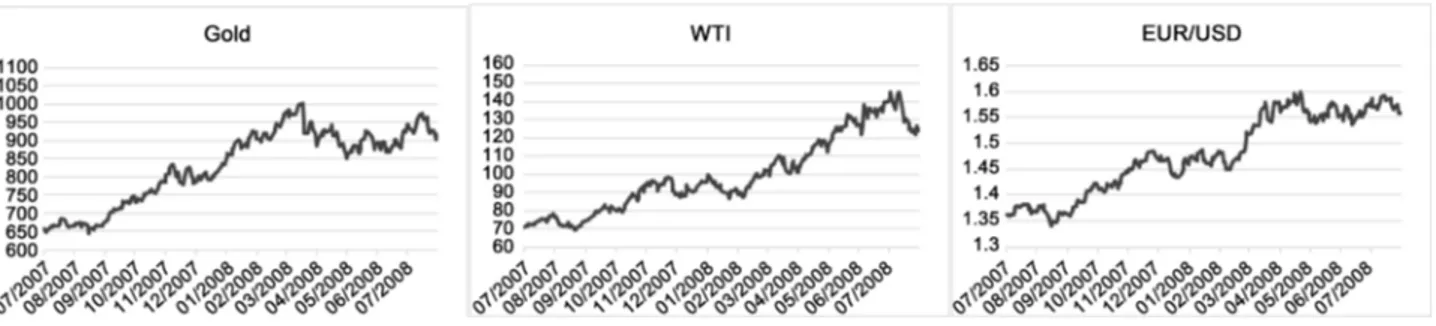
In this aim, the graphical and short-termed analysis can, in some cases, sug-gest a strong relationship. The graphs in Figure 1, referring to the time span between July 2007 and July 2008, are an interesting example.
Actually, this evidence is misleading, because even if the three series have a similar ongoing only on the considered interval, the relationships are more complex to evaluate.
In fact, during the considered time period, the price of gold increased by 41.22%; Oil had an 80% price increase and the Euro/Dollar exchange rate in-creased by 14.87%.
The prices increase of the three variables is due to the turmoil in financial markets resulting from the subprime mortgage1 crisis, that has further weakened the dollar, pulled its value in 2008 to around 1.50 euro.
The Federal Reserve interventions, for limiting the huge deficit of the econo-my, implemented an expansionary monetary policy for sustaining the exports by means of a weaker currency vs. euro.
The oil price increase was due to two main reasons:
1) The dollar weakness. Demand stayed strong, despite the producing coun-tries in-creased their oil production to compensate the lower profit due to the dollar weakness.
2) The international stock markets crisis. All commodities seemed to be a suitable in-vestment for speculative funds.
Source: data processing on Bloomberg dataset.
Figure 1. Daily values of gold, oil and Euro/Dollar exchange rate, from July 2007 to July 2008.
DOI: 10.4236/me.2017.88069 997 Modern Economy
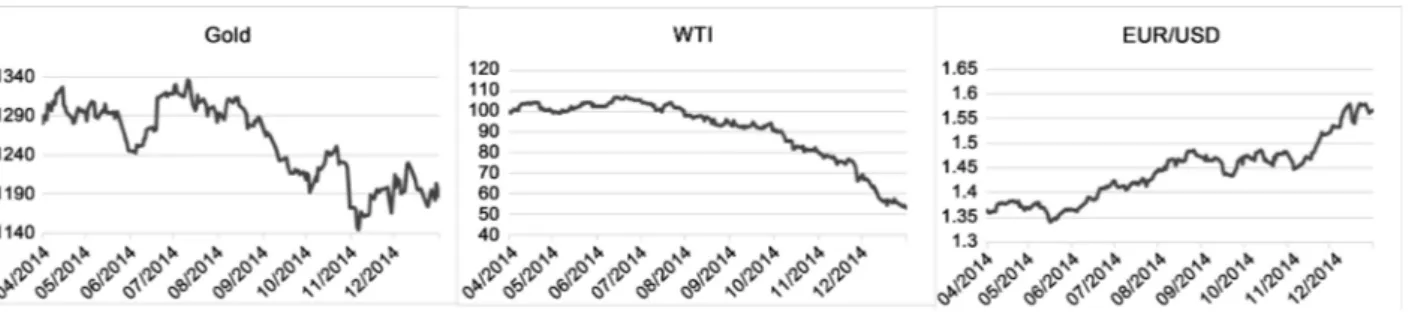
The US dollar weakness led the investors to take “long” positions on gold, pushing up its price. In other words, in this period the demand for gold as a re-fuge was particularly high. A second sub-period (April 2014-December 2014) (see Figure 2), show a joint decrease of the three variables. Specifically, between April 2014 and December 2014, the gold price fell by 7.59%, oil 41.89% and the exchange rate decreased by 7.53%.
Specifically, between April 2014 and December 2014, the gold price fell by 7.59%, oil 41.89% and the exchange rate decreased by 7.53%.
The main elements linked to the decrease of the three goods prices are: • Regarding gold: gold price conveyed when Fed started the “tapering” of the
QE. Moreover, the strong expectation of rising interest rates has recom-mended maintaining long positions in gold.
• Regarding oil: the oversupply of the Arabian and the US (shale oil) countries, and a weak demand from Asian markets, led to a significant decline in oil prices, which fell from $102 in July 2014 to $59 in December 2014.
• Regarding the exchange rate: the ECB started its QE program, that is still ongoing. The resulting lower or even negative interest rates led to a contrac-tion in the euro from 1.35$ in July to 1.23$ in December.
These three short termed observations can suggest a strong correlation be-tween the three variables. But the observation of the same variables on a longer term, clearly contradicts this hypothesis (see Figure 3).
It is, thus, fundamental to perform a quantitative analysis, based on appropri-ate methodologies, for finding the actual linkages between the dynamics of the
Source: data processing on Bloomberg dataset.
Figure 2. Daily values of gold, oil and Euro/Dollar exchange rate, from April 2014 to December 2014.
Source: data processing on Bloomberg dataset.
DOI: 10.4236/me.2017.88069 998 Modern Economy
three considered variables.
The analysis here presented is developed by means of a VAR model on data referring to the time span from January 2004 to December 2014.
The reminder of the paper is structured as it follows: section 2 reports the li-terature review, section 3 and 4 report the econometric model and its results, section 5 discusses the estimation results and its conclusions.
2. Literature Review
This paper mainly refers to a literature stream that, through the analysis of pric-es of gold, oil and exchange ratpric-es, invpric-estigatpric-es over time the relationships be-tween the variations of the considered variables. These studies mainly aim at ve-rifying if the theoretical references on the expected relationships are actually met by market values. These findings always bring useful information for the inves-tors and speculainves-tors operating in the foreign exchange market (Forex) and in the commodities market.
Indeed, no one of these studies includes the euro/dollar exchange rate as ref-erence variable.
In the recent literature, the main references are the following:
• [1] analyzed the dynamic relationships between the gold price, the oil price, the exchange rate2 and the S & P 500 index by means of a VAR model (Vec-tor Au(Vec-toregressive) and the co-integration technique. The results show that the exchange rate is significantly influenced by the price of gold and oil. This evidence suggests that gold and oil play a primary role in determining the exchange rate.
• [2] study, for a period of twenty years, the relationship between the price of gold, oil, exchange rate (US Dollar Index3) and the price of a basket of stocks measured by the Dow Jones Industrial Average. The results show that not all variables are related to each other. Specifically, the share price and the price of gold appear to be sufficiently related. Conversely, the exchange rate and the oil price are influenced by other factors.
• [3] analyzed the relationship between the value of the dollar and the price of gold and oil (monthly data, time period January 1970-July 2008) using the Granger causality test. The results show a negative relationship between the value of the dollar and the prices of the two commodities. As a result, gold and oil can be considered “safe havens” compared to negative changes in the price of the dollar.
• [4] investigated the relationships between the price of oil and the Cana-dian/USD exchange rate. The results show that in the long term (using monthly data) there is no stable relationship. In the short term (with daily data) there is instead a strong relationship between the two variables.
• [5] analyzed the relation between some commodities (gold, oil and copper)
2The authors used the weighted mean of specific exchange rates relative to US dollar.
3The Dollar Index is a measure of the value of the United States dollar relative to other world
DOI: 10.4236/me.2017.88069 999 Modern Economy
and the exchange rate of their producing countries (Canada, Australia and Chile), in the time period 2000-2009, by means of daily dataset. The results show a link between all variables in the short term; on the other hand these links don’t exist for longer period.
• [6] analyzed the dynamic relationship between the price of oil, exchange rate4 and the price of shares5 through the implementation of a vector autoregres-sion model. The results obtained show that positive shocks in oil prices tend, in the short term, to depress the stock price and the exchange rate, while pos-itive shocks in oil production tend to lower the oil price, and pospos-itive shocks on the real economic activity, instead, typically induce the oil price to rise. These results are not univocal, and this is possibly due to the different model-ing, and to the different datasets.
Nevertheless, the main results show significant linkages between the two commodities and the exchange rates on the US dollar on the short term (days), often not confirmed on longer terms (months).
The cited references also show that the euro/dollar exchange rate has not been considered in terms of its linkages to the main commodities. This can be due to the recent (1999) introduction of the European currency in financial markets, and to the small incidence on the European GDP of the gold and oil production, so that no significant theoretical effects of the two commodities prices variations are expected to induce any variations in the exchange rate, thus inducing no in-terest in testing these effects.
It has, instead, a significant interest for speculators, which are interested in having all the possible information on potential mutual relationship between the main commodities and exchange rates trends, so to implement more effective speculation strategies.
The main aim of this study is to test for possible linkages, on a short (days) and longer (months) term, of gold and oil prices and the euro/dollar exchange rate, and, in case, to have some references on which variable can help in having more precise expectations on the other variables variations.
The analysis is performed on the three variables time series, starting from daily values from January 2004 to December 2014.
3. Methodology
The analysis is based on a vector autoregressive model, using data coming from Bloomberg, one of the main financial data providers, which include the daily closing prices of gold (dollars per ounce), oil WTI (dollars per barrel) and the euro/dollar exchange rate, and refer to the time span from January 2004 to De-cember 2014. Overall the dataset is made up of 2870 daily observations for each variable.
The VAR models are based on time series, with multiple dynamic equations in
4See Supra note 2.
5The price of shares is measured by means of the MSCI index, which measures 1612 stocks listed in
DOI: 10.4236/me.2017.88069 1000 Modern Economy
which each variable is considered in its relation to the same and other lagged va-riables.
It is, thus, possible to summarize the dynamic relationships between the con-sidered variables, with no distinction between endogenous and exogenous (or dependent and independent) variables, but the attention is on current (at time t) values, as a function of the previous (at time t-h) values, and the parameters are estimated so to have unbiased and consistent estimations.
As the VAR modeling requests the time series to be stationary, and the Dick-ey-Fuller test on oil and gold prices, as like on the euro/dollar exchange rate, es-timated to be not stationary, the model is applied on the first differences, which resulted to be stationary as requested.
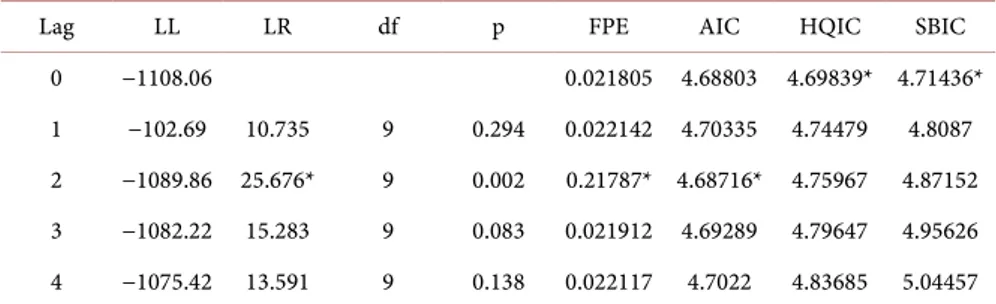
The optimal lag was then chosen on the base of 5 different indexes (LR, FPE, AIC, HQIC, SBIC, see Table 1 and Table 2), and resulted to be 1 for monthly data, and 2 for daily data.
4. Results
4.1. Monthly Data
As it can be seen on Table 3, the results obtained from monthly data only sug-gest a weak relationship between the euro/dollar exchange rate and oil prices. More specifically, euro/dollar exchange rate resulted to be significantly (at 10% level) affected by the previous month oil prices, with a positive sign (positive correlation).
Table 1. Optimal lags selection, gold, oil and euro/dollar exchange rate, monthly values, Jan. 2004-Dec. 2014.
Lag LL LR df p FPE AIC HQIC SBIC
0 −658.135 85.6099 12.9634 12.9947* 13.0406*
1 −644.538 27.194* 9 0.001 78.2397* 12.8733* 12.9983 13.1821 2 −641.087 6.9021 9 0.647 87.2789 12.9821 13.2009 13.5225 3 −635.277 11.619 9 0.236 93.0292 13.0446 13.3573 13.8167 4 −631.979 6.5957 9 0.679 104.272 13.1565 13.5629 14.1601
Source: data processing on Stata output.
Table 2. Optimal lags selection, gold, oil and euro/dollar exchange rate, daily values, Jan. 2004-Dec. 2014.
Lag LL LR df p FPE AIC HQIC SBIC
0 −1108.06 0.021805 4.68803 4.69839* 4.71436*
1 −102.69 10.735 9 0.294 0.022142 4.70335 4.74479 4.8087 2 −1089.86 25.676* 9 0.002 0.21787* 4.68716* 4.75967 4.87152 3 −1082.22 15.283 9 0.083 0.021912 4.69289 4.79647 4.95626 4 −1075.42 13.591 9 0.138 0.022117 4.7022 4.83685 5.04457
DOI: 10.4236/me.2017.88069 1001 Modern Economy Table 3. VAR estimation on gold, oil and euro/dollar exchange rate, monthly values, Jan. 2004-Dec. 2014.
Δ _Gold Coeff. Std. Err. Z P > |z|
Δ_Gold t-1 0.1162511 0.0921111 1.26 0.207
Δ_Oil t-1 0.2640494 0.6922552 0.38 0.703
Δ_EUR/USD t-1 39.96504 146.1948 0.27 0.785
constant 4.116153 3.998092 1.03 0.301
Δ_Oil Coeff. Std. Err. Z P > |z|
Δ_Gold t-1 −0.011622 0.0127144 −0.91 0.361
Δ_Oil t-1 0.3724225 0.0955545 3.90 0.000
Δ_EUR/USD t-1 26.02258 20.1798 1.29 0.197
constant −0.0337552 0.5518713 −0.06 0.951
Δ_EUR/USD Coeff. Std. Err. Z P > |z|
Δ_Gold t-1 −0.0000425 0.0000639 −0.67 0.506
Δ_Oil t-1 0.0008917 0.00048 1.86 0.063
Δ_EUR/USD t-1 0.2080736 0.1013602 2.05 0.040
constant −0.0010629 0.002772 −0.38 0.701
Source: data processing on Stata output.
The Granger causality cannot be performed on these values, as the model is only estimated on lag 1.
4.2. Daily Data
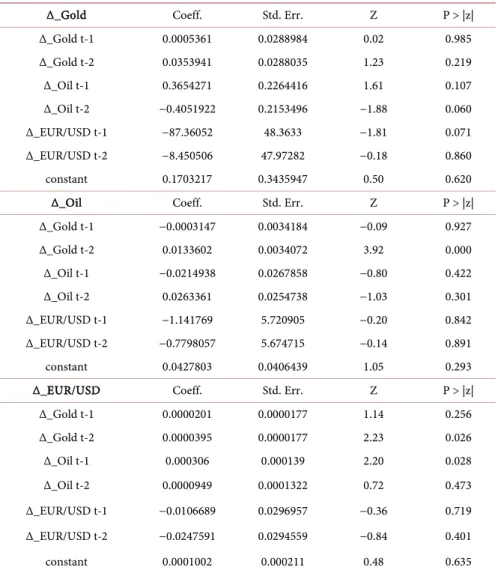
As evident from Table 46, results show some significant short-term relationship coming from daily data.
The estimations based on daily data show that gold prices are significantly af-fected by the oil prices with lag 1 and 2 (respectively with positive and negative correlation), and with the euro/dollar exchange rate with lag 1 (negative correla-tion).
Oil prices are instead linked to gold prices (lag 2) and the exchange rate re-sults to be linked to gold (lag 2) and oil prices (lag 1) with a 5% significance lev-el.
The Granger causality test, reported on Table 5, confirms the actual linkage between the considered variables. More specifically, it shows that:
− Causality for gold prices as due to oil prices cannot be refused at 5% signi-ficance level;
− Causality for oil prices as induced by gold prices cannot be refused at 1% significance level;
− Causality for exchange rates as induced by gold and oil prices cannot be re-fused at, respectively, 10% and 5% significance level.
6As Table 5 shows, all p-values (“P > |z|”) are lower than 0.05 (0.01) and so we have to reject the null
DOI: 10.4236/me.2017.88069 1002 Modern Economy Table 4. VAR estimation on gold, oil and euro/dollar exchange rate, daily values, Jan. 2004-Dec. 2014.
Δ_Gold Coeff. Std. Err. Z P > |z|
Δ_Gold t-1 0.0005361 0.0288984 0.02 0.985 Δ_Gold t-2 0.0353941 0.0288035 1.23 0.219 Δ_Oil t-1 0.3654271 0.2264416 1.61 0.107 Δ_Oil t-2 −0.4051922 0.2153496 −1.88 0.060 Δ_EUR/USD t-1 −87.36052 48.3633 −1.81 0.071 Δ_EUR/USD t-2 −8.450506 47.97282 −0.18 0.860 constant 0.1703217 0.3435947 0.50 0.620
Δ_Oil Coeff. Std. Err. Z P > |z|
Δ_Gold t-1 −0.0003147 0.0034184 −0.09 0.927 Δ_Gold t-2 0.0133602 0.0034072 3.92 0.000 Δ_Oil t-1 −0.0214938 0.0267858 −0.80 0.422 Δ_Oil t-2 0.0263361 0.0254738 −1.03 0.301 Δ_EUR/USD t-1 −1.141769 5.720905 −0.20 0.842 Δ_EUR/USD t-2 −0.7798057 5.674715 −0.14 0.891 constant 0.0427803 0.0406439 1.05 0.293
Δ_EUR/USD Coeff. Std. Err. Z P > |z|
Δ_Gold t-1 0.0000201 0.0000177 1.14 0.256 Δ_Gold t-2 0.0000395 0.0000177 2.23 0.026 Δ_Oil t-1 0.000306 0.000139 2.20 0.028 Δ_Oil t-2 0.0000949 0.0001322 0.72 0.473 Δ_EUR/USD t-1 −0.0106689 0.0296957 −0.36 0.719 Δ_EUR/USD t-2 −0.0247591 0.0294559 −0.84 0.401 constant 0.0001002 0.000211 0.48 0.635
Source: data processing on Stata output.
Table 5. Granger causality test, on gold, oil and euro/dollar exchange rate, daily values, Jan. 2004-Dec. 2014.
Equation Excluded chi2 df Prob> chi2
ΔGold ΔOil 6.5857 2 0.037 ΔGold ΔEUR/USD 3.3154 2 0.191 ΔGold ALL 9.4601 4 0.051 ΔOil ΔGold 15.394 2 0.000 ΔOil ΔEUR/USD 0.06038 2 0.970 ΔOil ALL 16.233 4 0.003 ΔEUR/USD ΔOil 6.2113 2 0.045 ΔEUR/USD ΔGold 5.1681 2 0.075 ΔEUR/USD ALL 13.292 4 0.010
DOI: 10.4236/me.2017.88069 1003 Modern Economy
For daily data, as the white noise test on residuals (reported in Table 6) shows p-values higher than 0.05, it is possible to analyze the effects by means of im-pulse-response functions.
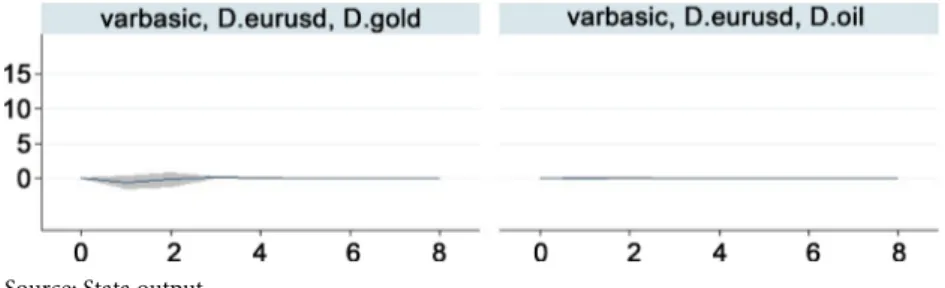
The following Figure 4, Figure 5, Figure 6 report the impulse-response func-tions for the considered variables, only showing weak linkages, as the resulting lines seem to be almost flat.
Table 6. White noise test on gold, oil and euro/dollar exchange rate, daily values, Jan. 2004-Dec. 2014.
Variable Portmanteau (Q) statistic Prob. >chi2(40)
Gold 34.5941 0.7117
Oil 53.1062 0.0803
EUR/USD 31.4806 0.8300
Source: data processing on Stata output.
Source: Stata output.
Figure 4. Impulse-response function, gold vs. oil and euro/dollar exchange rate, daily values, Jan. 2004-Dec. 2014.
Source: Stata output.
Figure 5. Impulse-response function, oil vs. gold and euro/dollar exchange rate, daily values, Jan. 2004-Dec. 2014.
Source: Stata output.
Figure 6. Impulse-response function, euro/dollar exchange rate vs. gold and oil prices, daily values, Jan. 2004-Dec. 2014.
DOI: 10.4236/me.2017.88069 1004 Modern Economy
5. Conclusions
The analysis of gold and oil prices and euro/dollar exchange rate performed on daily data from January 2004 to December 2014 shows some significant infor-mation.
The VAR estimations, like in [4] and some other studies, report a significant linkage between the two commodities and the euro/dollar exchange rate on the short term, confirmed by the Granger causality test. More specifically, we found a direct linkage among oil and gold prices, and among the euro/dollar exchange rate and gold prices. Regarding the analysis performed on monthly data, we found only a direct link between the oil dynamic and euro/dollar exchange rate. These differences can be due to the short impact of the commodities price shocks, which are typically exhausted in a few days, thus no more significant on longer terms.
The impulse-response functions show that only small variations are expected as a consequence of the price shocks, and that the euro/dollar exchange rate gives no significant in-formation on oil and gold expected trends. As regarding the monthly dataset, the euro/dollar exchange rate does not allow to take a fi-nancial position (long or short) on the examined commodities. Instead, the oil prices can give significant information on the expectances of the exchange rate, and suggest possibly effective speculative positions on the currency markets.
Overall, the analysis shows that the linkage between gold price and the ex-change rate is significant only in the short term. For this reason investment strategies based on this link, should be implemented for a short time period (few days). These findings bring new information both from the academic perspec-tive, aimed at understanding the actual linkages between the main currencies and commodities, and from the practical perspective of financial speculators, aimed at developing more effective investment strategies, which can have a technical advantage when using the information coming from these findings.
References
[1] Sujit, K.S. and Rajesh Kumar, B. (2011) Study on Dynamic Relationship among Gold Price, Oil Price, Exchange Rate And Stock Market Returns. International Journal of Applied Business and Economic Research, 9.
[2] Subarna, K.S. and Zadeh Ali, H.M. (2015) Co-Movements of Oil, Gold, the US Dol-lar and Stocks. Modern Economy, 3, 111-117.
[3] Myeong Hwan, K. and Dilts, D.A. (2011) The Relationship of the Value of the Dol-lar, and the Prices of Gold and Oil: A Tale of Asset Risk. Economics Bulletin, 31. [4] Ferraro, D., Rogoff, K. and Rossi, B. (2015) Can Oil Prices Forecast Exchange Rates?
Journal of International Money and Finance, 54, 116-141.
https://doi.org/10.1016/j.jimonfin.2015.03.001
[5] Zhang, H.J., Dufour, J. and Galbraith, J.W. (2016) Exchange Rates and Commodity Prices: Measuring Causality at Multiple Horizons. Journal of Empirical Finance, 36, 100-120.https://doi.org/10.1016/j.jempfin.2015.10.005
[6] Basher, S.A., Haug, A. and Sadorsky, P. (2011) Oil Prices, Exchange Rates and Emerging Stock Market. Munich Personal RePEc Archive. Paper N˚30140.
Submit or recommend next manuscript to SCIRP and we will provide best service for you:
Accepting pre-submission inquiries through Email, Facebook, LinkedIn, Twitter, etc. A wide selection of journals (inclusive of 9 subjects, more than 200 journals)
Providing 24-hour high-quality service User-friendly online submission system Fair and swift peer-review system
Efficient typesetting and proofreading procedure
Display of the result of downloads and visits, as well as the number of cited articles Maximum dissemination of your research work
Submit your manuscript at: http://papersubmission.scirp.org/