Was the Mirandola thrust really involved in the Emilia
2012 seismic sequence (northern Italy)? Implications on the
likelihood of triggered seismicity effects
G. Lavecchia1, R. de NaRdis1,3, G. costa2, L. tibeRi2, F. FeRRaRiNi1, d. ciRiLLo1,
F. bRozzetti1aNd P. suhadoLc2
1 GeosisLab, DiSPUTer, University of Chieti-Pescara “G. d’Annunzio”, Campus Universitario, Chieti Scalo, Italy
2 Dipartimento di Matematica e Geoscienze, University of Trieste, Italy 3 Dipartimento della Protezione Civile, Rome, Italy
(Received: January 30, 2015; accepted: May 4, 2015)
ABSTRACT We present the results of an interdisciplinary study aimed at defining the geometry of
the fault segments activated by the Emilia 2012 thrust sequence (MW up to 6.1), which
are located at the front of the Ferrara Arc (northern Italy) and partially overlap with an area undergoing hydrocarbon exploitation since 1980 (Cavone oil field). We relocate 40
well-recorded earthquakes with MW prevailingly ≥4.0 in the time interval from May 20
to June 12, 2012, plus an event that occurred in a nearby area on July 17, 2011 (MW 5.0).
The geological and seismotectonic setting of the area is discussed, some interpretative geological sections across the hypocentral volumes are elaborated, and the shape of the identified individual seismogenic fault segments is schematically represented as depth contour lines. The resulting earthquake/fault association highlights a rather complex segmentation pattern, with four neighbouring sources involved, all belonging to the SSW-dipping Ferrara Thrust System. The two main events of the Emilia 2012 sequence did not activate the Mirandola thrust underlying the Cavone reservoir, although this thrust was illuminated by some subsidiary activity mainly concentrated close to the hydrocarbon field. The likelihood of triggered seismicity effects due to the extraction/ injection activities within the Cavone oil field are discussed.
Key words: Emilia 2012 seismic sequence, northern Italy, thrust earthquakes, hydrocarbon field, earthquake
relocation, structural style, seismotectonics, triggering effects.
1. Introduction
On May 2012, an intense seismic sequence with two main moderate earthquakes [May 20:
I0 VII MCS, ML 5.9, MW 6.1; May 29: I0 VII MCS, ML 5.8, MW 6.0: Pondrelli et al. (2012)]
was generated by thrust faulting in the Ferrara Arc, at the Padan buried front of the northern Apennines Outer Thrust System (Emilia region, northern Italy) (Figs. 1a and 1c). The sequence produced widespread damage (Galli et al., 2012; Tertulliani et al., 2012), partly due to
shear-wave-amplification effects caused by the unconsolidated sediments in the Po alluvial plain (Malagnini et al., 2012; de Nardis et al., 2014; Milana et al., 2014). The epicentral area of the Emilia 2012 earthquakes was characterized by modest historical and instrumental seismicity
(MW<5) (Rovida et al., 2011; Burrato et al., 2012) and by extensive drilling campaigns for oil
and gas exploration purposes (Casero, 2004) (Fig. 1a). For this reason, soon after the second main event of May 29, a question arose about the possible role of the extraction and/or injection activities in the nearby Cavone oil field (Mirandola exploitation license) in inducing/triggering the 2012 seismic activity. Two international technical-scientific commissions investigated the problem, using a multidisciplinary geological-seismological, statistical, and/or geo-mechanical approach (Astiz et al., 2014; ICHESE, 2014). They both agreed to exclude a case of induced seismicity, with this term referring to a seismic process entirely controlled by a non-tectonic phenomenon, typically occurring within an aseismic area (Cesca et al., 2013b). Conversely, they reached partially different conclusions regarding the triggered component, referring to transient Coulomb failure stress changes capable of promoting the rupture process on the faults. According to Astiz et al. (2014), the fluid pressure increase/decrease linked with the Cavone activities were too localized and negligible to produce any triggering effect at the sources of both the May 20 and 29 main events. According to ICHESE (2014), a triggering component might be hypothesized in the May 20 case, in light of a statistical correlation between the seismic activity and an injection pressure increase within one of the deep Cavone wells, which, according to their geometric reconstruction, was in hydraulic contact with the seismogenic source.
The Astiz et al. (2014) and ICHESE (2014) geometric reconstructions of the Emilia 2012 fault system, which were at the base of their evaluation of the triggered effects, are substantially different, but share the fundamental seismogenic role attributed to the Mirandola thrust, located beneath the Cavone reservoir. As a matter of fact, the Mirandola thrust was largely interpreted (Bignami et al., 2012; Burrato et al., 2012; Marzorati et al., 2012; Scognamiglio et al., 2012; Tizzani et al., 2013; Ventura and Di Giovambattista, 2013; Govoni et al., 2014) as the most likely source of the May 29 event for two main reasons: 1) it was already well known in the literature as an active and possibly seismogenic thrust of the Ferrara Arc (Carminati et al., 2010; DISS Working Group, 2015); 2) it was located just beneath the May 29 epicentral area. This hindered the search for alternative solutions, even if a vertical mismatch of ~5 km between the Mirandola thrust and the May 29 hypocentre was soon evident. In fact, the earliest locations (ISIDe Working Group INGV, 2015), later on confirmed by more detailed data (Chiarabba et al., 2014; Govoni et al., 2014), provided a depth of 9-10 km for the May 29 main event hypocentre, whereas on the same vertical line the Mirandola thrust, as previously interpreted from seismic line and deep wells data (Massoli et al., 2006; Martelli and Molinari, 2008; Toscani et al., 2009), was positioned at depths of about 5 km.
In this paper, based on accurate earthquake locations and on fault geometry interpretation, we support a different hypothesis (Lavecchia et al., 2012), which excludes involvement of the Mirandola thrust in the nucleation of the two main May 20 and 29 events of the Emilia 2012 sequence. These events are instead associated with the activation of a complex pattern of interconnected individual fault segments, all belonging to the Ferrara Thrust System. The Mirandola thrust was only subordinately activated, in the close surroundings of the Cavone field. The spatial relationships between the newly defined individual sources and the regions
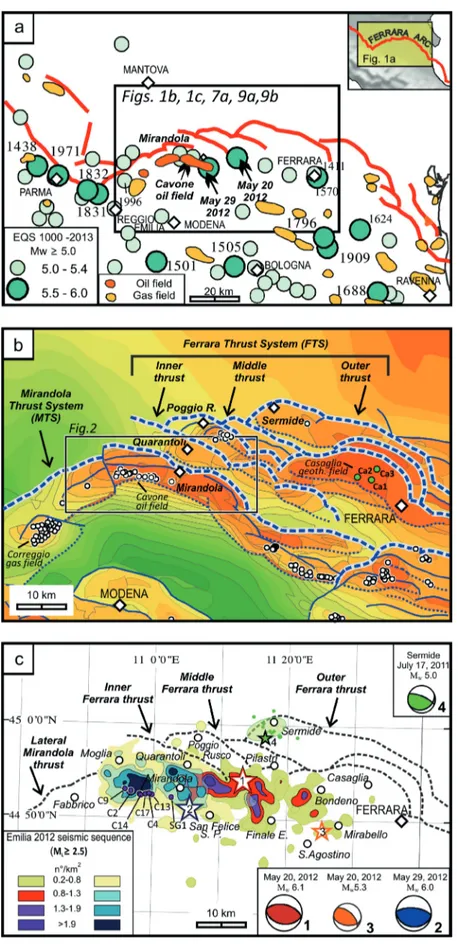
Fig. 1 - Seismotectonic setting of the Emilia 2012 seismic sequence: a) historical and instrumental earthquakes with MW≥5.0 that occurred in the
time interval 1000 - 2013 from CPTI11 (Rovida et al., 2011; ISIDe Working Group INGV, 2015) and boundaries of the oil and gas fields from Casero (2004); red line represents the outer Quaternary front of the northern Apennines Thrust System; b) Plio-Quaternary compressional structures with foredeep deposits decreasing in thickness from dark green (~7 km) to orange (~1 km), from the Structural Model of Italy, scale 1:500,000 (CNR - P.F. Geodinamica, 1990). Key: dashed lines = major Quaternary thrust fronts; continuous lines = other thrusts; dotted lines = back-thrusts and syn-compressional south-dipping normal faults. The white dots represent hydrocarbon drilling sites extracted from ViDEPI Project (2014) (see Fig. 2 for further details) and the green dots Ca1, Ca2, Ca3 refer to the Casaglia geothermal field. c) Epicentral area of the Emilia 2012 sequence from ISIDe database (ISIDe Working Group INGV, 2015) represented as density contours of earthquake locations in the time intervals from May 15 to 28, 2012, and from May 29 to June 15, 2012. Stars 1 and 2 represent the epicentres of two main events (May 20 and 29) of the Emilia 2012 sequence (e.g., EQ1 and EQ2 in this paper); star 3 is the largest event (May 20) recorded within the eastern area of the epicentral sequence (event n. 10 in Table 1); star 4 represents the major event of the small neighbouring sequence that occurred in 2011. Focal mechanisms are from Pondrelli et al. (2012). The Cavone field wells operating in 2012 for extraction and water disposal are highlighted as purple dots (from ICHESE, 2014).
of stress perturbations due to extraction/injection activities within the Cavone oil field will be described and their implications regarding the likelihood of triggered earthquake activity discussed.
Model A Model D Model F M
ID Date Time Lon Lat depth rms ErrH ErrZ Date Time Lon Lat depth rms ErrH ErrZ Date Time Lon Lat depth rms ErrH ErrZ ML* MW* 1 20110717 18.30.26 11.280 44.988 -4.2 0.3 0.6 0.7 20110717 18.30.26 11.275 44.995 -2.1 0.3 0.5 0.6 20110717 18.30.27 11.287 44.995 -2.6 0.3 0.5 1.2 4.8 5.0 2 20120520 02.03.51 11.218 44.907 -5.3 0.3 0.4 0.7 20120520 02.03.52 11.217 44.913 -4.0 0.3 0.4 0.5 20120520 02.03.51 11.230 44.913 -2.9 0.4 0.4 0.7 5.9 6.1 3 20120520 02.07.30 11.330 44.829 -8.6 0.9 0.7 1.6 20120520 02.07.31 11.326 44.830 -8.3 0.9 0.5 3.4 20120520 02.07.31 11.338 44.831 -6.1 0.8 0.6 1.6 5.1 4.5 4 20120520 02.11.45 11.304 44.859 -7.0 0.2 0.6 2.1 20120520 02.11.46 11.299 44.862 -5.7 0.2 0.6 1.0 20120520 02.11.46 11.316 44.868 -3.7 0.1 0.6 0.9 4.3 3.6 5 20120520 02.12.41 11.201 44.880 -7.9 0.3 1.0 2.4 20120520 02.12.42 11.209 44.885 -4.5 0.3 0.7 1.0 20120520 02.12.42 11.222 44.886 -4.6 0.3 0.9 1.9 4.3 4.2 6 20120520 02.21.52 11.132 44.868 -6.9 0.2 0.5 0.4 20120520 02.21.53 11.135 44.872 -6.4 0.2 0.5 0.4 20120520 02.21.52 11.135 44.871 -7.2 0.2 0.5 0.5 4.1 4.4 7 20120520 02.39.08 11.213 44.881 -6.2 0.1 1.5 3.0 20120520 02.39.09 11.217 44.895 -5.6 0.1 1.1 2.5 20120520 02.39.09 11.226 44.896 -5.7 0.0 1.5 2.6 4.0 4.1 8 20120520 03.02.48 11.101 44.872 -9.2 0.3 0.5 0.8 20120520 03.02.49 11.098 44.880 -10.9 0.3 0.6 1.0 20120520 03.02.49 11.100 44.877 -9.2 0.3 0.5 0.8 4.9 5.3 9 20120520 09.13.20 11.203 44.878 -10.2 0.4 0.6 0.6 20120520 09.13.21 11.212 44.884 -9.9 0.3 0.6 1.0 20120520 09.13.21 11.207 44.880 -10.3 0.4 0.6 0.5 4.2 4.6 10 20120520 13.18.02 11.425 44.813 -10.8 0.5 0.4 3.6 20120520 13.18.01 11.418 44.829 -5.5 0.4 0.4 0.7 20120520 13.18.02 11.417 44.823 -3.2 0.4 0.4 1.0 5.1 5.3 11 20120520 17.37.12 11.308 44.879 -5.0 0.4 0.4 0.9 20120520 17.37.13 11.304 44.883 -2.6 0.4 0.4 0.7 20120520 17.37.13 11.312 44.886 -3.1 0.4 0.4 0.8 4.5 4.9 12 20120521 16.37.30 11.322 44.862 -5.8 0.2 0.5 0.5 20120521 16.37.31 11.329 44.865 -4.8 0.3 0.4 0.5 20120521 16.37.31 11.325 44.864 -6.7 0.3 0.4 0.6 4.1 4.4 13 20120522 09.31.13 11.229 44.856 -7.1 0.2 0.3 5.5 20120522 09.31.14 11.240 44.859 -6.7 0.2 0.3 0.4 20120522 09.31.14 11.236 44.860 -8.0 0.2 0.3 0.5 3.8 --14 20120523 21.41.17 11.242 44.844 -9.2 0.4 0.2 0.5 20120523 21.41.18 11.253 44.847 -8.6 0.4 0.3 0.6 20120523 21.41.18 11.250 44.847 -8.9 0.3 0.3 0.5 4.3 4.5 15 20120525 10.31.21 11.217 44.846 -9.3 0.2 0.2 0.6 20120525 10.31.22 11.227 44.849 -8.3 0.2 0.3 0.6 20120525 10.31.22 11.223 44.849 -8.7 0.2 0.2 0.5 3.9 0.0 16 20120525 13.14.03 11.098 44.865 -6.1 0.2 0.2 0.2 20120525 13.14.04 11.100 44.870 -5.8 0.2 0.3 0.2 20120525 13.14.04 11.098 44.868 -5.2 0.2 0.2 0.5 4.0 4.2 17 20120526 21.07.30 11.171 44.830 -11.3 0.2 0.3 0.3 20120526 21.07.31 11.179 44.832 -10.6 0.2 0.3 0.6 20120526 21.07.31 11.176 44.833 -10.8 0.2 0.3 0.5 3.8 --18 20120527 --18.--18.44 11.171 44.854 -5.8 0.2 0.2 0.3 20120527 --18.--18.45 11.177 44.857 -5.7 0.3 0.2 0.3 20120527 --18.--18.45 11.174 44.858 -4.4 0.3 0.2 0.3 4.0 4.5 19 20120527 20.25.41 11.170 44.865 -6.5 0.2 0.4 0.4 20120527 20.25.42 11.177 44.868 -6.2 0.2 0.4 0.4 20120527 20.25.42 11.174 44.870 -7.0 0.2 0.3 0.8 3.8 0.0 20 20120529 07.00.02 11.069 44.842 -8.8 0.3 0.3 0.6 20120529 07.00.03 11.070 44.848 -8.6 0.3 0.3 0.7 20120529 07.00.02 11.070 44.847 -8.7 0.3 0.3 0.6 5.8 5.8 21 20120529 07.07.18 11.018 44.863 -4.4 0.2 2.4 3.2 20120529 07.07.20 11.017 44.863 -3.4 0.2 0.4 0.9 20120529 07.07.20 11.030 44.868 -3.0 0.2 0.5 1.6 4.0 22 20120529 07.49.26 11.138 44.856 -7.3 0.1 0.3 0.5 20120529 07.49.27 11.145 44.861 -6.7 0.1 0.3 0.2 20120529 07.49.27 11.140 44.861 -7.3 0.1 0.3 0.4 3.7 23 20120529 08.15.08 11.090 44.863 -7.8 0.1 0.3 0.7 20120529 08.15.09 11.092 44.868 -7.2 0.1 0.4 0.7 20120529 08.15.09 11.092 44.866 -7.7 0.1 0.3 0.4 3.8 --24 20120529 08.25.50 10.970 44.868 -9.4 0.2 0.3 0.5 20120529 08.25.51 10.963 44.875 -9.0 0.2 0.3 0.7 20120529 08.25.51 10.966 44.874 -9.4 0.1 0.3 0.5 4.5 4.7 25 20120529 08.27.21 11.057 44.882 -6.2 0.2 0.4 0.3 20120529 08.27.22 11.057 44.888 -5.7 0.2 0.5 0.3 20120529 08.27.22 11.055 44.889 -6.2 0.2 0.4 0.4 4.7 4.4 26 20120529 08.40.56 10.993 44.856 -9.8 0.1 0.4 0.5 20120529 08.40.57 10.986 44.862 -10.3 0.1 0.4 1.0 20120529 08.40.57 10.992 44.861 -9.7 0.1 0.4 0.5 4.2 4.5 27 20120529 09.30.20 11.091 44.854 -8.3 0.1 0.3 0.5 20120529 09.30.21 11.093 44.858 -7.6 0.1 0.3 0.5 20120529 09.30.20 11.092 44.857 -7.8 0.1 0.3 0.3 4.2 4.2 28 20120529 10.55.55 11.007 44.861 -9.7 0.2 0.3 0.5 20120529 10.55.56 11.003 44.868 -9.9 0.2 0.3 0.6 20120529 10.55.56 11.005 44.867 -9.8 0.1 0.3 0.4 5.3 5.5 29 20120529 11.00.23 10.953 44.893 -8.3 0.2 0.4 1.0 20120529 11.00.24 10.946 44.900 -7.1 0.1 0.5 1.1 20120529 11.00.24 10.950 44.900 -8.2 0.2 0.4 0.7 5.2 --30 20120529 11.00.00 10.956 44.859 -6.9 0.3 0.3 0.9 20120529 11.00.01 10.951 44.866 -7.5 0.3 0.3 1.4 20120529 11.00.01 10.954 44.864 -8.0 0.3 0.3 0.4 4.9 4.4 31 20120529 14.39.39 11.043 44.882 -6.2 0.1 0.4 0.3 20120529 14.39.40 11.043 44.888 -5.8 0.1 0.4 0.3 20120529 14.39.40 11.045 44.889 -5.2 0.1 0.4 0.5 3.9 32 20120529 18.27.59 10.946 44.890 -8.2 0.2 0.3 0.9 20120529 18.28.00 10.939 44.895 -6.9 0.1 0.5 0.5 20120529 18.28.00 10.942 44.897 -8.3 0.2 0.4 0.6 3.9 33 20120529 18.44.40 11.114 44.865 -6.3 0.1 0.4 0.3 20120529 18.44.41 11.116 44.867 -5.8 0.0 0.3 0.3 20120529 18.44.41 11.113 44.867 -5.3 0.1 0.3 0.7 3.2 --34 20120531 14.58.20 10.897 44.873 -10.0 0.1 0.9 0.8 20120531 14.58.21 10.877 44.883 -8.3 0.1 1.1 2.6 20120531 14.58.20 10.883 44.880 -10.0 0.1 1.0 1.1 4.0 4.2 35 20120531 19.04.02 10.999 44.880 -8.3 0.1 0.3 0.4 20120531 19.04.04 10.995 44.888 -7.6 0.1 0.3 0.5 20120531 19.04.03 10.998 44.887 -8.5 0.1 0.3 0.4 4.2 4.4 36 20120603 19.20.42 10.963 44.895 -5.8 0.4 0.4 0.6 20120603 19.20.43 10.954 44.906 -7.9 0.4 0.4 1.3 20120603 19.20.43 10.956 44.906 -8.1 0.4 0.4 1.1 5.1 5.1 37 20120604 06.55.48 10.984 44.883 -9.4 0.1 0.4 0.7 20120604 06.55.49 10.979 44.889 -8.7 0.1 0.4 0.8 20120604 06.55.49 10.981 44.890 -9.2 0.1 0.4 0.6 3.8 38 20120605 03.11.35 11.083 44.865 -7.9 0.1 0.7 0.5 20120605 03.11.36 11.089 44.873 -7.7 0.1 0.7 0.6 20120605 03.11.36 11.089 44.875 -7.7 0.1 0.7 0.6 2.7 39 20120609 13.25.14 11.100 44.871 -6.3 0.2 0.5 0.3 20120609 13.25.15 11.108 44.883 -5.8 0.2 0.4 0.4 20120609 13.25.15 11.112 44.881 -5.6 0.2 0.5 0.7 3.4 --40 20120612 01.48.35 10.944 44.886 -10.1 0.1 0.3 0.4 20120612 01.48.36 10.937 44.895 -10.1 0.1 0.3 0.5 20120612 01.48.36 10.941 44.893 -10.6 0.1 0.3 0.3 4.3 4.5 41 20120612 15.56.01 10.943 44.905 -7.8 0.1 0.5 1.0 20120612 15.56.02 10.938 44.914 -7.4 0.1 0.6 0.9 20120612 15.56.02 10.938 44.917 -8.2 0.1 0.6 0.7 3.4
--Table 1 - Hypocentral parameters of 41 relocated earthquakes that occurred in Emilia 2012 seismic sequence (northern Italy) during the period May 20 to June 12, 2012, plus one event that occurred in the same area on July 17, 2011 (ML
4.8, MW 5.0). The hypocentral data were computed from travel times manually measured from the digital seismograms
and computed with HYPOELLIPSE code (Lahr, 1999), and the vertically stratified earth models specified in the text and in Fig. 4. ML* and MW* are derived from ISIDe database (ISIDe Working Group INGV, 2015) and Gallo et al.
2. The Ferrara Arc
2.1. Tectonic setting
The Ferrara Arc is an active NNE-verging fold-and-thrust zone at the front of the Apennine compressional belt (Boccaletti et al., 2011). From west to east, its frontal thrust rotates in strike from WSW-ENE to W-E and NW-SE (Fig. 1a). In the western and central portions, the Ferrara Arc is composed of two first-order blind thrust systems (Fig. 1b). From south to north, they are the arcuate and north-convex Mirandola Thrust System (MTS) and the mostly linear, WNW-ESE striking Ferrara Thrust System (FTS), separated for a large portion by a broad syncline filled by Lower Pliocene-Lower Pleistocene sediments. The MTS, which contains in its apical sector the Cavone anticline, is mostly continuous along strike for its overall extent (Picotti and Pazzaglia, 2008; Ghielmi et al., 2010). The FTS, which represents the outermost compressional system at the front of the northern Apennine belt, is articulated into a number of second-order NNE-verging fold-and-thrust structures, generally referred to as Inner, Middle and Outer Ferrara thrusts (Fig. 1b, CNR - P.F. Geodinamica, 1990). The Middle Ferrara Thrust is especially complex and along-strike subdivided into two major fold-and-thrust structures, here referred to as Poggio Rusco and Casaglia segments (Fig. 1c).
The MTS and the FTS differ slightly in their deformation age, the first mainly starting to nucleate during the Late Pliocene and the second during the Early Pleistocene (Ghielmi et
al., 2010). By the Middle Pleistocene, at about 0.6 My, the thrust front of the Ferrara Arc had
reached its present position, but an ongoing N-S compression in the region is verifiable by seismological and geodetic data (Devoti et al., 2011; Montone et al., 2012). Namely, historical and instrumental earthquakes (Fig. 1a) show the activity of 1) the WSW-ENE side of the Ferrara Arc, coinciding with the western lateral ramp sector of the MTS, where the 1831 and 1832
(MW 5.5) and the Reggio Emilia 1996 (MW 5.4) earthquakes occurred; 2) the central nearly
E-W striking portion of the arc, substantially coinciding with the FTS, activated by the Emilia
2012 sequence (MW up to 6.1) and, possibly, by the Ferrara 1570 (MW 5.5) earthquake and 3)
the eastern NW-SE side of the arc, where the Argenta 1624 (MW 5.5) earthquake nucleated. The
focal mechanisms of the instrumental events show prevailing dip-slip reverse kinematics across the Ferrara Arc frontal sector and a prevailing strike-slip component along the WSW-ENE side of the arc, which plays the role of a left-lateral ramp (Selvaggi et al., 2001).
2.2. Hydrocarbon and geothermal fields
The Ferrara Arc is a site of relatively large and economically significant hydrocarbon and geothermal resources in Italy (Fig. 1a). They were discovered and/or exploited since 1950 in the Correggio gas field, since 1956 in the Casaglia geothermal field, and since 1980 in the Cavone oil field (ICHESE, 2014 and references therein); a minor gas field was discovered since 1960 at Poggio Rusco (Fig. 1b). The Cavone and Casaglia fields were both drilled within fractured Mesozoic carbonate reservoirs, at depths of about 2.5-3.0 and 1.2-2.0 km, respectively. The Correggio and Poggio Rusco gas fields were encountered in the Pliocene, at a depth of about 1.0-1.2 km.
The Poggio Rusco gas field and the Casaglia geothermal field are both located within anticline structures at the hanging wall of the Middle Ferrara Thrust (Fig. 1b). The Correggio and Cavone fields are located in a more internal structural position, within hanging-wall
anticlines at the MTS front (Fig. 1b). The Correggio anticline is located along the WSW-ENE striking MTS sector, whereas the Cavone anticline is located in the apical, nearly E-W striking, MTS sector and is overthrusted on another small en echelon anticline, which contains the San Giacomo and Concordia oil fields (Fig. 2). The Cavone, San Giacomo, and Concordia fields are included in the Mirandola exploitation license, and as a whole depict a large, long (~15.0 km) and narrow (~1.5 km) asymmetric, north-verging fold-and-thrust anticline. This structure is slightly arcuate northwards, rotating in strike from about N80°E in the west to about N110°E in the east (Carminati et al., 2010). The Mirandola anticline has been largely explored and drilled by a large number of deep wells, up to a maximum depth of 5507 m in the Cavone 1 well and of 5000 m in the Concordia 1 well. The Cavone reservoir produces a heavy oil (20°-23° API) rich in sulphur (3-4%) (Nardon et al., 1990), and has had an average yearly production during the last seven years of 30,000 tons (ViDEPI Project, 2014). The carbonate reservoir lithotypes are represented by the Lower Jurassic shelf limestones of the Calcari Grigi di Noriglio Fm. and the Lower Cretaceous Brecce di Cavone Fm. (Nardon et al., 1990), located at a minimum depth of 2500 m, with an average thickness of 400-700 m (ICHESE, 2014). The age of the source rock is uncertain, probably Triassic (Anelli et al., 1996).
Whereas the Correggio and Casaglia field are located tens of kilometres outwards from the Emilia 2012 epicentral area, the Cavone oil fields completely overlaps with the May 29 aftershock sequence (Fig. 2). Many wells were operating in 2012 (ICHESE, 2014). Among these, Cavone 2 (depth 4096 m), producing oil with some intervals of inactivity since 1980, Cavone 13 (depth 3310 m), producing oil since December 1987, and Cavone 14 (depth 3400 m) performing water-disposal re-injection since January 1993 (see C2, C3, C14 in Fig. 2). This spatial configuration soon opened the question of the likelihood of exploitation-injection having triggered, or even induced, seismicity in the Emilia 2012 sequence.
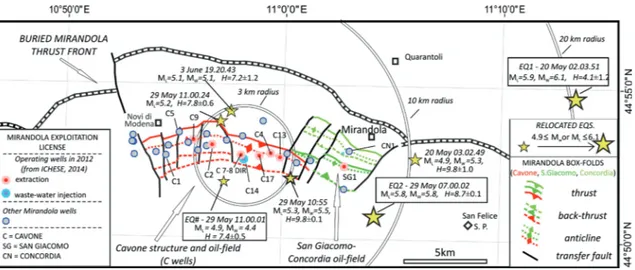
Fig. 2 - Structural detail of the Cavone box fold (after Carminati et al., 2010) with the location of the Mirandola license wells (ViDEPI Project, 2014) and of the wells operating in 2012 before the seismic sequence onset (from ICHESE, 2014). The epicentres of the major events of the Emilia 2012 sequence (ML or MW ≥4.9), relocated in this paper (Table
1) are also reported. Circumference arcs with radii of 3, 10, and 20 km centred on the C14 injection well are shown. ML
3. The Emilia 2012 seismic sequence
The Emilia 2012 thrust sequence was associated with the two major events of May 20 [MW
5.9 in Scognamiglio et al. (2012); MW 6.1 in Pondrelli et al. (2012) and Gallo et al. (2014)]
and May 29 [MW 5.7 in Scognamiglio et al. (2012); MW 5.8 in Gallo et al. (2014) and MW 6.0 in
Pondrelli et al. (2012)] and with other six events with ML and/or MW ≥5.0 (ns. 3, 8, 10, 20, 28,
29 in Table 1). From now on, we refer to the two major events as EQ1 and EQ2.
The overall Emilia 2012 sequence extended for about 50 km, with an average strike of N100°E, over the central portion of the MTS and the western and central portion of the FTS (Fig. 1c) (Lavecchia et al., 2012; Pezzo et al., 2013; Gallo et al., 2014). The sequence was
preceded by a foreshock (MW 4.1), nucleated on May 19 close to the EQ1 hypocentre, and
anticipated by a minor north-verging thrust sequence (MW 5.0), which occurred on July 17,
2011, a few kilometres northwards, close to the locality of Sermide on the FTS front. The time-space distribution of the aftershock sequence, from May 20 to June 12, highlights two distinct left-stepping en echelon epicentral areas, overlapping in between the small localities of Quarantoli and San Felice sul Panaro (see the density contour lines of the number of events with
ML ≥2.5 in Fig. 1c); a minor third cluster may be distinguished eastwards of Finale Emilia.
The hypocentral depths calculated in the literature for the two main events range between 4 and 7 km for EQ1 and between 8 and 13 km for EQ2 (Marzorati et al., 2012; Chiarabba et al., 2014; Govoni et al., 2014; ICHESE, 2014; ISIDe Working Group INGV, 2015; this study). The overall aftershock sequence is mainly confined within the uppermost 11 km (Govoni et al., 2014). Focal mechanisms for the two main events and their major aftershocks, as determined by various authors (Malagnini et al., 2012; Pondrelli et al., 2012; Saraò and Peruzza, 2012; Scognamiglio
et al., 2012), show no substantial differences. They imply a nearly sub-horizontal NNE-SSW
trending P-axis, which is also coherent with geodetic data (Devoti, 2012). The preferential seismic plane strikes about WNW-ESE for EQ1 and about E-W for EQ2.; the dip angles range from 25° to 35° for EQ1 and from 25° to 30° for EQ2, the only exception being the INGV-ICT solutions that provide greater dip angles (45° and 38°, respectively) (Cesca et al., 2013a).
The EQ1 source was commonly associated (Pezzo et al., 2013; Astiz et al., 2014; Govoni et al., 2014) with the shear thrusting on the middle segment of the FTS (Fig. 1b), whereas the association of EQ2 fault source was less clear and more controversial. Some authors, mainly basing their arguments on geodetic data inversion, associated it with shallow thrusting (~5 km) on the MTS segment located just beneath the Cavone reservoir (Bignami et al., 2012; Burrato et al., 2012). Others, mainly arguing on the basis of earthquake locations and/or of structural analysis, suggested a link with a deeper high-angle segment of the Mirandola basal thrust (Astiz et al., 2014; Bonini
et al., 2014; Govoni et al., 2014), with the innermost fault segments of the FTS (Quarantoli thrust
in Fig. 1b) (Lavecchia et al., 2012), or, alternatively, with a blind high-angle thrust located beneath the Cavone reservoir within the Mirandola thrust footwall volume (ICHESE, 2014).
4. Emilia 2012 earthquake relocation
The Emilia seismic sequence occurred within the Padan Plain sedimentary basin, which contains a remarkable thickness (up to about 8 km) of Pliocene-Quaternary foredeep deposits
overlain by recent alluvial sediments. Such a geological setting makes the near-source waveforms particularly complex because of the interference of body and locally generated surface waves with the consequent difficulties in reading S-wave arrival times at the closest stations (de Nardis et al., 2014). Moreover, it could make the use of regional velocity models unsuitable for describing this geological context. In order to contribute with our own data to the discussion on the Emilia 2012 individual seismogenic sources, we focused on locating selected major events, based on the analysis of available and well-constrained waveforms.
We determined the arrival times of 40 well-constrained earthquakes mostly with MW≥4.0,
that occurred during the Emilia 2012 seismic sequence (max MW 6.1) in the time interval from
May 20 to June 12, 2012, plus the event that occurred in the same area on July 17, 2011 (ML 4.8,
MW 5.0). Specifically, we collected and analyzed the waveforms of events recorded by the
permanent and temporary stations of the Italian strong motion network RAN (Gorini et al., 2010; Zambonelli et al., 2011; de Nardis et al., 2014), carefully merging them with the available recordings from ISIDe database (ISIDe Working Group INGV, 2015) and the ones recorded by the Central and Eastern European Earthquake Research Network (jointly managed by the Mathematical and Geosciences Department of the University of Trieste, the National Institute of Oceanography and Experimental Geophysics in Trieste, the Environmental Agency of the Republic of Slovenia, the Zentralanstalt für Meteorologie und Geodynamik in Vienna, and the Croatian Seismological Service in Zagreb).
The integrated database contains more than 900 waveforms (3 channels) recorded at epicentral distances ranging from 4 to 210 km and recorded by 164 stations. In order to overcome the possible difficulties in the detection of S-waves’ arrivals, all the available waveforms were visually inspected and a manual picking was performed. The whole data set comprises 546 P- and 244 S-phases, associated with the most significant events of the seismic sequence. A standard weighting scheme was applied, assigning to each P- or S-arrival a weight, varying from 0 (uncertainty of 0.1 s) to 4 (uncertainty greater than 2.0 s). Considering the time readings of both the P-and S-phases, a modified Wadati method (Chatelain, 1978) was adopted in order to: 1) test the reliability and consistency of P-and S-phases; 2) have a rough evaluation
of the mean velocity ratio VP/VS. From the Wadati plot (Fig. 3), a VP/VS ratio of 1.82, with a
95% confidence interval having a squared correlation coefficient (R2) greater than 0.98, was estimated. This value of the VP/VS ratio is higher than the ones (VP/VS = 1.73, VP/VS = 1.78 and
VP/VS = 1.79) obtained, respectively, by Costa et al. (1992), Zollo et al. (1995), Massa et al.
(2013) and lower than the one (VP/VS = 1.90) proposed by Govoni et al. (2014).
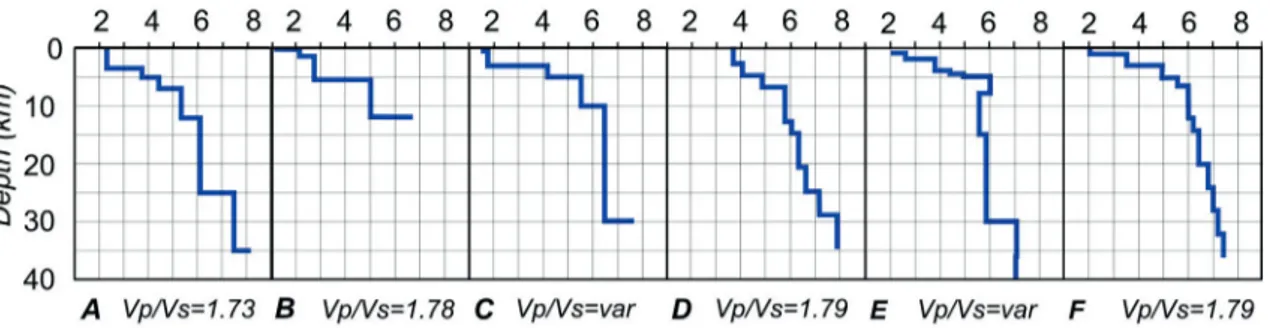
The final location of the entire data set was performed using the Hypoellipse code (Lahr, 1999). Specifically, the P- and S- onsets were inverted considering five P-wave velocity models optimized for the study area (Costa et al., 1992; Zollo et al., 1995; Bragato et al., 2011; Malagnini et al., 2012; Massa et al., 2013) (A to E in Fig. 4) and a velocity model (F in Fig. 4) derived in this paper from the geological interpretation and depth-conversion of the seismic line App. Orient. 1 (ViDEPI Project, 2014) along the trace of section B in Fig. 7b. In the location procedure, we assigned the standard WEIGHT OPTION coherently with the P and S weighting scheme and considered the option RELOCATE, in order to associate the time delays to seismic stations possibly affected by local velocity anomalies. We estimated the quality of the final locations, obtained from the six velocity models, accounting for the distribution of residuals of P- and S- phases (Res P, Res S), root mean square of travel-time residuals (RMS)
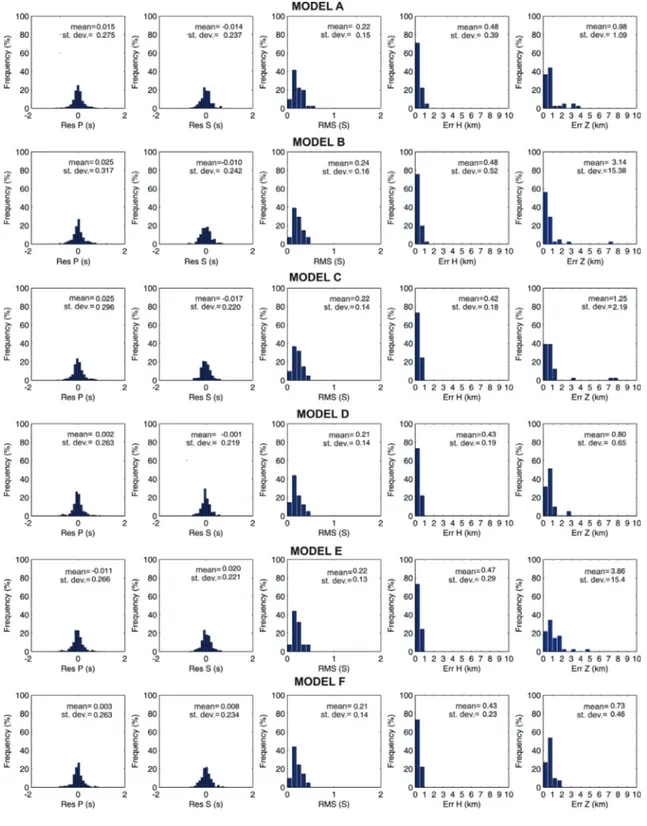
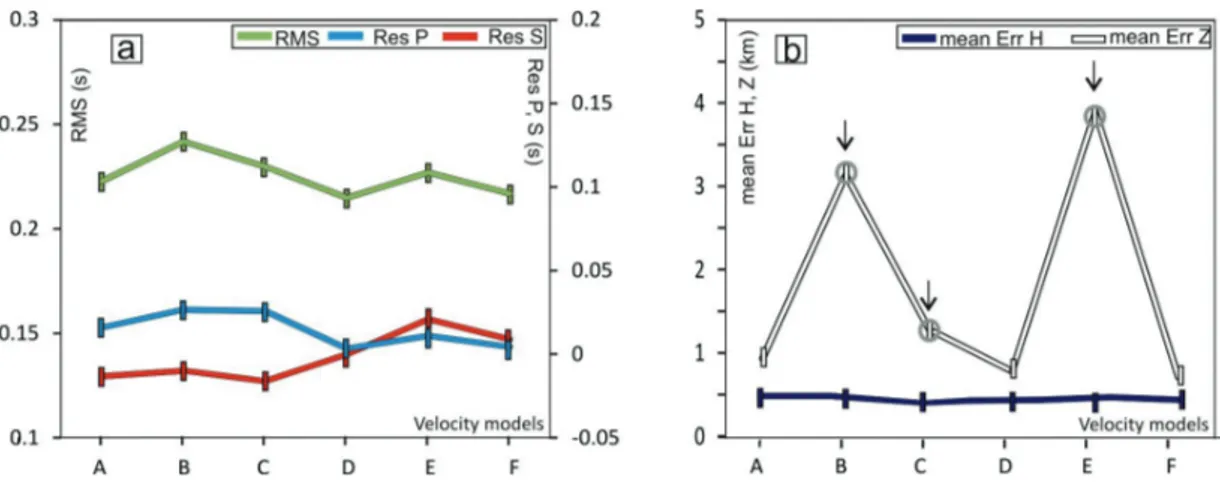
and both horizontal and vertical formal errors (Err H, Err Z). The summary of these results in terms of Res P, Res S, RMS, Err H, and Err Z are shown in Fig. 5. The analysis of such location parameters is synthesized in Fig. 6, where the mean values of Res P, Res S, RMS, and the mean values of horizontal (Err H) and vertical errors (Err Z) are plotted and compared. The differences in terms of mean residuals (Res P, Res S, RMS) did not allow us to assess the quality of the seismic locations with respect to the six velocity models A-F (Fig. 6a). On the contrary, the distribution of the vertical formal errors differs according to the velocity model (Fig. 6b). Based on Fig. 6, we selected the velocity models named A, D, and F in Fig. 4 as the best ones among those analyzed. The corresponding epicentral distributions are reported in the map of Fig. 7a; the range of the hypocentral depth variation for each event is represented in the sections
Fig. 3 - Modified Wadati plot; the data set consists of 546 P- and 244 S-phase arrival times associated with 41 selected earthquakes of the Emilia 2012 sequence (max MW 6.1). The black line represents a simple least squares regression.
Fig. 4 - P velocity profiles of the models used to locate the major events (ML ≥4.0) of the Emilia seismic sequence. Key:
A = Costa et al. (1992), B = Zollo et al. (1995), C = Bragato et al. (2011), D = Massa et al. (2013), E = Malagnini et al. (2012), F = this study; var = variable.
Fig. 5 - Summary of the results for the relocated events using P-wave velocity model from A to F. Histograms of absolute residuals of P- and S-phases (Res P, Res S); root mean square of travel time residuals (RMS); horizontal and vertical location formal errors (Err H, Err Z).
of Figs. 7b and 8 with a vertical bar, representing the standard deviation among the three best selected models. The hypocentral coordinates calculated for the three different velocity models are given in Table 1.
5. Emilia 2012 seismotectonic interpretation
5.1. Earthquake/fault association
To analyze the depth distribution of the relocated events (Table 1) with respect to the geometry of the Quaternary fold-and-thrust structures in the area, we projected the vertical bars corresponding to the standard deviation of the Emilia 2012 hypocentres derived from the selected velocity models, along the traces of two, independently and a priori, interpreted geological sections (sections A and B in Fig. 7b).
Section A extends across the May 29 epicentral area and coincides with the trace of a nearly N-S geological section across the Cavone field, initially interpreted by Nardon et al. (1990). The section clearly shows the Cavone fold structure, which involves the Meso-Cenozoic sequence from the Jurassic-Cretaceous shallow-to-deep water carbonates to the Upper Triassic Dolomia Principale Fm. The anticline is box-shaped with the forelimb overturned and displaced by high-angle thrusts, located at a depth of 4-5 km beneath the anticline crest. The high-angle thrusts splay at depths of 6-7 km from the underlying south-dipping low-angle Mirandola thrust, which also penetrates the Upper Triassic Dolomia Principale Fm, the Triassic evaporites, and the Lower Triassic-Permian meta-sediments (e.g., sedimentary basement). Because the section extends across the most arcuate portion of the Mirandola thrust, and in order to avoid spatial distortion, only the events belonging to the May 29 sequence (time interval from May 29 to June 12, 2012) located within a half-width of 6.5 km from the trace of the section were projected.
Section B was drawn along the trace of a seismic section (“App. Orient 1”), which extends in the NNE-SSW direction across the Ferrara Arc and the Emilia 2012 epicentral area (ViDEPI
Fig. 6 - Analysis of location parameters: a) average RMS (green line), mean absolute P-phase residuals (light blue line) and mean absolute S-phase residuals (red line) for each studied velocity models; b) mean horizontal location errors (blue line) and mean vertical location errors (white line).
Project, 2014). The seismic line was reinterpreted and depth-converted (Fig. 7b); the legend of the identified horizons is given in Fig. 7b. In section B, we clearly recognize, differing in this from other interpretations (Massoli et al., 2006; Toscani et al., 2009; Bertello et al., 2010;
Boniniet al., 2014), five well distinct thrust segments. The innermost segment belongs to the
MTS; the other four are splays of the FTS. All four FTS segments are blind faults that penetrate across the Mesozoic carbonate multilayer, reaching and cross-cutting the Triassic evaporites and the underlying sedimentary basement. In section view, they follow near-parallel down-dip trajectories, but in map view the segmentation pattern appears more complex (Fig. 7a). Also taking into consideration the FTS fold-and-thrust geometry, as schematically derived from the Structural Model of Italy in Fig. 1b (CNR - P.F. Geodinamica, 1990), four major near-parallel alignments may be identified (Fig. 7a). From south to north, they are named here: 1) Quarantoli, 2) Poggio Rusco-Casaglia, 3) Pilastri and 4) Sermide. Quarantoli and Sermide correspond to the Inner and Outer Ferrara thrusts of Fig. 1 (e.g., Internal and External thrusts Auctorum), respectively. Poggio Rusco-Casaglia and Pilastri represent along-strike and perpendicular-to-strike segmentations of the Middle Ferrara Thrust, respectively.
In order to analyze the spatial relationships between the above segments and the Emilia 2012 seismic sequence, as a first approximation, we considered it acceptable to project along the trace of section B the overall relocated hypocentral data set (red and blue vertical bars in Fig. 7b), assuming a cylindrical deformation at a regional scale. This oversimplification has the advantage of offering a complete view of the earthquake/fault association. Subsequently, assuming a uniform half-width of 4 km, we projected the vertical bars along the traces of six interpretative sections (Figs. 8 and 9a). These sections were built across the epicentral area, taking into account the near-surface geometry and segmentation pattern of the major buried thrust fronts (Fig. 7a), the structural style of the fold-and-thrust structures as reconstructed in Fig. 7b, the available information from some hydrocarbon deep wells cutting across the Mirandola thrust (Cavone 1, Bignardi 1, Concordia 1 and Spada 1 wells), and the Casaglia segment of the Middle Ferrara Thrust (Casaglia 1 well) (data from ViDEPI Project, 2014), as well as the depth distribution of the relocated events.
Based on the reconstructed geometric earthquake/fault pattern (Fig. 8), integrated with information from the literature, we fix the following points, which can be significant for the characterization of the individual sources, as well as for the discussion of the likelihood of a triggered component in the Emilia 2012 earthquake sequence.
1 - The Emilia 2012 sequence, which began on May 20 and was preceded by a foreshock
Fig. 7 - Earthquake/fault association for the Emilia 2012 sequence: a) epicentral distribution of the events in the time interval from May 20 to June 12, 2012, as located in this paper according to the three best velocity models (A, D and F) discussed in the text (Table 1). Full symbols represent the events that occurred from May 20 to 28 and the empty ones the events that occurred from May 29 to June 12; the Sermide event that occurred on July 17, 2011, is also reported. Black lines are the traces of the two interpretative sections A and B. The blue and grey dashed line refers to the buried thrust fronts of the FTS segments and of the Mirandola Thrust, respectively; b) hypocentral view of the Emilia 2012 sequence as located in this paper, projected along the traces of two interpretative sections (Section A and Section B); the vertical bars represent the standard deviation of the selected solutions related to the three best velocity models (Table 1). Section A is from Nardon et al. (1990), slightly modified; the half width of the projected seismicity along the section is 6.5 km. Section B is derived from our interpretation of seismic line “App. Orient 1”, available at ViDEPI Project (2014); the overall relocated Emilia 2012 data set (Table 1) is projected along the section trace. EQ1 and EQ2 are the main events (May 20 MW 6.1 and May 29 MW 5.8, respectively); EQ# is a May 29 event (11.00.01 UTC, MW 4.4, event
(MW 4.1) on May 19, progressively activated different segments of the FTS (Fig. 7b). The first
large event, e.g., EQ1 (MW 6.1), nucleated on the Poggio Rusco segment (Figs. 7b and 9b), at a
depth of about 4 km (Table 1), close to the vertical transition between the Jurassic carbonates and the underlying Upper Triassic dolostones (Fig. 7b). The rupture propagated down-dip with an eastward directivity (Convertito et al., 2013). The EQ1 aftershock sequence (May 20 to 28) grew bilaterally from the main event in an average WNW-ESE direction (Fig. 1c). It covered an epicentral area extending for about 25 km along the Poggio Rusco segment and for about 10 km along the Casaglia segment (Figs. 1c and 9c). Along-dip, the May 20-28 hypocentral volume was confined within the highly competent Upper Triassic layers, at depths between 4 and 9 km
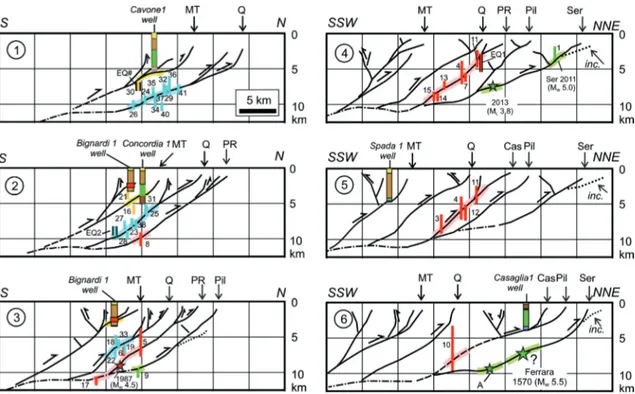
Fig. 8 - Earthquake/fault association for the Emilia 2012 sequence along the trace of interpretative serial cross-sections (traces of the sections in Fig. 9a). Sections 1 and 4 coincide with geological sections A and B in Fig. 7; in the other sections, the depth geometry of the thrust structures is interpreted taking into account the near surface tip-lines of the major buried thrust fronts as in Fig. 7a, the structural style of the fold-and-thrust structures as in Fig. 7b, the available information from hydrocarbon deep wells crossing the thrust segments and the relocated earthquake distribution (from Table 1). The stratigraphic layering drilled by the Bignardi 1, Cavone 1, Casaglia 1, Concordia 1, and Spada 1 wells (data from ViDEPI Project, 2014) is schematically represented with different colors (yellow = Plio-Quaternary, red = intra-Miocene thrust zones, brown = Late Eocene-Messinian, green = Jurassic-Early Eocene, pink = Late Triassic). Key for fault segments denomination: MT = Mirandola, Q = Quarantoli, PR = Poggio Rusco, Cas = Casaglia, Pil = Pilastri, Ser = Sermide, inc = incipient thrust. The colored vertical bars are the standard depth deviation for the Emilia 2012 events, as derived from Table 1; numbers from 2 to 20 refer to the May 20-28 time interval and numbers from 21 to 41 to the May 29 - June 12 time interval. The different colors of the bars represent the proposed attribution to the different fault segments; also, the colored strips along the fault traces highlight inferred seismogenic fault patches activated during the Emilia 2012 sequence and/or associated to other relevant earthquakes (light blue = Quarantoli, pink = Poggio Rusco and Casaglia, green = Sermide); the yellow strip in sections 1 and 2 highlights the subsidiary activation of the Mirandola thrust. The stars represent the approximate location of other events possibly associated to the here identified sources; star A represents the most external relevant event of the Emilia 2012 sequence (2012/05/20, 02:35, MW 4.4), as relocated by Chiarabba et al. (2015). The 1570 Ferrara event has been tentatively attributed to the Sermide
segment, based on the surface location of the corresponding box-shaped source as given by Pettenati et al. (2013) and Vannoli et al. (2014).
(Fig. 7b). The second large event, e.g., EQ2 (MW 5.8), nucleated nearly 15 km WSW-wards from
EQ1, at a depth of about 8.5-9.0 km (Table 1), activating the Quarantoli segment. According to the interpretation proposed in Fig. 7b, the EQ2 hypocentre was located close to the transition between the Rhaetian dolostones (Dolomia Principale Fm.?) and the underlying Norian-Carnian evaporites (Burano Fm?). The rupture propagated quasi-bilaterally with a dominant westward directivity (Convertito et al., 2013). The May 29 - June 12 EQ2 aftershock sequence (Fig. 7a) extended prevailingly in the E-W direction, for a length of about 25 km. The western termination of the Emilia 2012 sequence coincided with the WSW-ENE trending left-lateral ramp of the Mirandola Arc (Govoni et al., 2014). Along-dip, the May 29 to June 12 hypocentral volume was confined within the highly competent Upper Triassic sedimentary sequence, at prevailing depths between 5 and 10 km (Fig. 7b).
2 - The hypocentres, projected in the sections of Figs. 7b and 8 as depth interval bars, show that the May 20 to 28 aftershock sequence (red bars in Fig. 7b) primarily activated the Poggio Rusco segment, at depths between 3-4 to 9-10 km, delineating a seismogenic patch dipping in average 35° southwards, with locally steeper dip-angles (45°-50°) (see sections 3, 4 and 5 in Fig. 8). A few events of the same aftershock group subordinately illuminated the lower flat of the Poggio Rusco segment at depths of about 11 km (event n. 17 in Table 1), as well as the lower flat of the Sermide segment at depths of about 10 km (e.g., event n. 9 in section 3 of Fig. 8). The May 29 to June 12 aftershock sequence (blue bars in Fig. 7b) activated primarily the Quarantoli segment, at depths between 6-7 and 10-11 km, delineating a seismogenic patch dipping in average from 20° to 35° SSW-wards (see sections 1, 2, and 3 of Fig. 8). Few May 29 events (Eqs. n. 16, 21, and 30 in Table 1) fall outside this prevailing seismogenic volume and appear located in the surroundings of the Mirandola thrust.
3 - The depth distribution of the more energetic events of the Emilia 2012 sequence, as relocated in this paper (Figs. 7b and 8), highlights an average moderate dip-angle of about 30°-35° for both the EQ1 and the EQ2 fault sources. Conversely, Govoni et al. (2014), based on a relocated earthquake catalogue of the overall sequence, estimate for the EQ2 fault a high-angle dip of about 70°. Also, considering that the available focal solutions of the May 29 event and those of its aftershocks show moderate to small south-dipping angles [RCMT by Pondrelli et
al. (2012); TDMT by Scognamiglio et al. (2012)], we argue that the steep aftershock volume,
which is mainly confined at depths between 4 and 7 km [section B-B1 in Fig. 6b in Govoni
et al. (2014)], does not represent the main event fault source, but rather a high-angle splay
activated by the microseismic activity. Our data set shows, as well, that the Emilia 2012 more energetic events are all confined within the hanging-wall rock volume of the Ferrara Basal Thrust, at depths shallower than 10-11 km. Therefore, we tend to exclude the activation by the main events of any steep-dipping fault segment in the footwall of the Mirandola frontal thrust, as suggested by other authors (Govoni et al., 2014; ICHESE, 2014).
5.2. Characterization of the individual seismogenic sources
According to our reconstruction and interpretation, the Emilia 2012 sequence and the previous neighbouring 2011 seismicity activated a rather complex pattern of along-dip and along-strike interconnected fault segments, all belonging to the FTS. The two major events, EQ1 and EQ2, nucleated on the Poggio Rusco and Quarantoli left-lateral en echelon segments, respectively, but the overall sequence also strongly involved the Casaglia segment, e.g., the
along-strike prosecution of the Poggio Rusco segment (Fig. 7a). The July 2011 sequence activated the outermost Sermide FTS splay. By schematizing the buried traces of the identified FTS segments, as derived from the Structural Model of Italy (CNR - P.F. Geodinamica, 1990), and connecting points of equal depth along their down-dip trajectory, as interpreted in the serial cross-sections of Fig. 8, we schematically draw the depth contour lines of each fault segments. As all seismogenic master faults, these segments, which were only partially activated during the Emilia 2012 sequence, are intended as irregular surfaces of finite extent. Their upper border simply coincides with the buried near-surface cut-off line. Their lower border corresponds to a branch line located at the intersection of the considered segment with an innermost segment or with the basal detachment, as interpreted in the sections of Fig. 8. Their lateral borders correspond to a tip line, in the case of en echelon segments (e.g., Quarantoli), or to the intersection line between two along-strike nearly continuous segments, as in the cases of Poggio Rusco and Casaglia.
The reconstructed isobath map in Fig. 9b shows the shape, size, and the spatial relationships among the identified FTS fault segments. On the same map, the major historical and instrumental earthquakes tentatively associated with the different sources are reported. The preferential seismic planes derived from the available focal solutions are also drawn; they all dip at low-angle southwards with strongly prevailing dip-slip reverse kinematics. The average fault parameters in terms of strike, dip, length, surface width (the latter measured between the buried fault trace and the horizontal projection of fault branch-line at depth), and depth are given in Table 2. An average rake angle is also indicated; it has been evaluated assuming an average direction of regional transport at the front of the Padan Arc oriented about N15°±5°, as
indicated by strain axes from geodetic data, Shmax from borehole breakouts and slip vectors on
preferential seismic planes from focal mechanisms (Devoti et al., 2011; Montone et al., 2012). In Table 2, the slip rate values from Vannoli et al. (2014) and the most significant historical and instrumental earthquakes possibly associated with the sources (Fig. 9a) are also reported.
The Quarantoli segment extends for ~25 km in a N100°E average direction, with an average surface width of ~15 km and with an average inclination of ~35° from near surface to a depth
of ~11 km. Four of the Emilia 2012 events with ML and/or MW >5.0 (ns. 20, 28, 29, and 36 in
Table 1) may be associated with this source. Three of these events occurred on May 29 (among
which the main MW 5.8 event, e.g., EQ2), and one on June 3. The preferential seismic planes
derived from available focal solutions dip at low-angle southwards with strongly prevailing dip-slip reverse kinematics and a very subordinate left-lateral component (rake 85°). No historical earthquake from the CPTI11 catalogue may be associated with this source, but the macroseismic epicentre of two recently discovered historical events [Mirandola 1761 and Moglia 1778: Castelli et al. (2012)] fall within its surface boundaries.
The Poggio Rusco segment extends for ~25 km in a N105°E average direction, with an average surface width of ~16 km, with an average inclination of ~30° from near surface to a depth of ~10 km and with almost pure dip-slip kinematics (rake 90°). The strongest event of
the Emilia 2012 sequence (e.g., EQ1, MW 6.1, depth ~4 km) may be associated with this source,
together with another relevant May 20 event (n. 8 in Table 1) occurred nearly one hour after EQ1, at a depth of about 10 km, nearly 10 km SW-wards of EQ1. The 1987 Bassa Modenese
south-dipping thrust event (MW 4.6), reported in Carminati et al. (2010), and the historical 1901
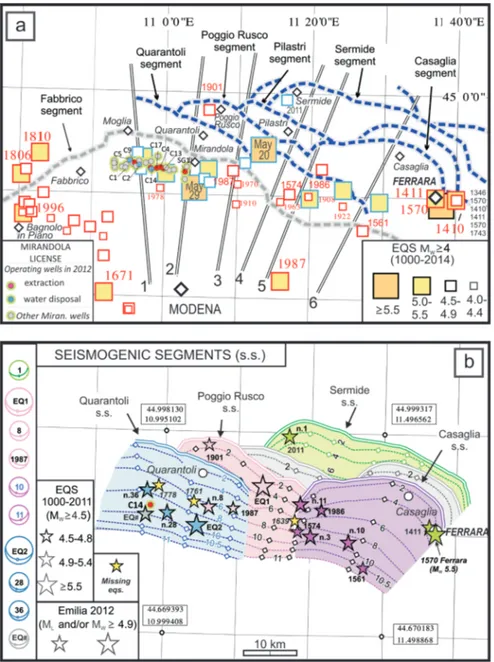
Fig. 9 - Seismotectonic interpretation of the Ferrara Thrust System (FTS) with reconstruction of the individual seismogenic segments partially activated during the Emilia 2012 sequence: a) major earthquakes (MW≥4.0) from the
CPTI11 database (Rovida et al., 2011) (red outlined squares) and from the relocated Emilia 2012 sequence (blue outlined squares). Black and white lines are the traces of the sections reported in Fig. 8. b) Surface projection (colored areas) and depth contour lines (dashed lines) of the FTS seismogenic faults, as reconstructed in this paper, based on the interpolation of depth points (small white diamonds) measured along the down-dip traces of the seismogenic segments drawn in the interpretative sections of Fig. 8. Color key for the seismogenic sources: light blue = Quarantoli, pink = Poggio Rusco, light purple = Casaglia, grey = Pilastri and its eastern along-strike prolongation, green = Sermide. The stars represent the major Emilia 2012 events (MW and/or ML ≥4.9) plus the historical and instrumental earthquakes
from 1000 to 2011 with MW≥4.5, falling within the boundaries of the sources; the different coloured stars highlights
the inferred source attribution, as discussed in the text. EQ1, EQ2, and EQ# as in the caption of Fig. 7. The yellow dots represent the macroseismic epicentres of events missing in the CPT11 catalogue and highlighted by Castelli et al. (2012). The column on the left presents the preferential seismic planes for the major Emilia 2012 events, derived from the focal solution given by Saraò and Peruzza (2012); the number inside the focal sphere and on the map refers to the earthquake number in Table 1; the focal mechanism for event 1987 (Bassa Modenese, MW 4.6) is from Carminati
and Vadacca (2010). The map is projected using a Lambert Conformal Conic projection (13.0, 42.0, 39.0 and 45.0 are central meridian, latitude of origin, and standard parallels, respectively; GCS:WGS84).
The Casaglia segment extends for ~23 km in a N115°E average direction, with an average surface width of ~17 km and with an average inclination of ~30° from near surface to a depth of ~10 km. Again, the preferential seismic plane derived from available focal solutions dip at low-angle southwards with prevailing dip-slip reverse kinematics and a very subordinate right-lateral
component (rake 100°). Three of the major Emilia 2012 events (MW or ML ≥4.9), which occurred
on May 20, may be associated with this source (ns. 3, 10, and 11 in Table 1). The macroseismic
epicentres of a few historical events, with MW between 4.0 and 5.0, are located within the
boundary of this source, as depicted in Fig. 9b, mainly close to the lateral transition with the
Poggio Rusco source, in the localities of Finale Emilia (1574, MW 4.7; 1908, MW 4.3), Bondeno
(1986, MW 4.6) (Fig. 9) and Finale Emilia-Carpi (April 6, 1639, maximum intensity VII-VIII
MCS) (Table 2 and references therein). The macroseimic epicentres of some historical Ferrara
earthquakes, as the 1411 (MW 5.1) and 1570 (MW 5.5) events, fall at the eastern boundary of this
source, but, evidently, they do not necessarily belong to this source.
The Sermide segment extends for ~32 km in a N110°E average direction, with an average surface width of ~18 km and an average inclination of ~25° from near surface to an average depth of ~8.5 km. This source was not deeply involved in the Emilia 2012 sequence, but was
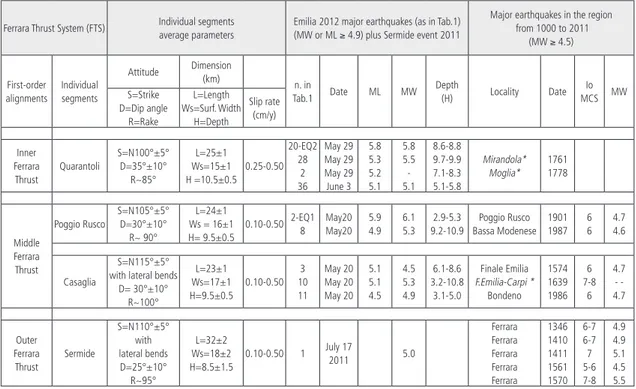
Table 2 - Geometric and kinematic parameters of the individual fault segments involved in the Emilia 2012 thrust sequence as interpreted in Figs. 7b and 8 and reconstructed in Fig. 9. Both along-strike and along-dip, the identified fault segments are non-planar, irregular, surfaces; therefore, the fault parameters given in this table represent average schematic values, obtained from more detailed values measured at different depths and location. The depth value, H, refers to the bottom fault boundary, located at the intersection line (e.g., branch line) of the considered segment with an innermost segment or with the basal detachment. The rake angle is evaluated assuming an average direction of regional transport at the front of the Padan Arc oriented about N15°±5°, as indicated by strain-rate axes from geodetic data, sh-max from borehole breakouts. and slip vectors on preferential seismic planes from focal mechanisms (Devoti et al., 2011; Montone et al., 2012). Slip rate values are from Vannoli et al. (2014). The major Emilia 2012 events and, tentatively, the historical earthquakes (from Rovida et al., 2011, and from Castelli et al., 2012, for the events with asterisks) are assigned to the various fault segments.
Ferrara Thrust System (FTS) Individual segments average parameters Emilia 2012 major earthquakes (as in Tab.1)(MW or ML ≥ 4.9) plus Sermide event 2011
Major earthquakes in the region from 1000 to 2011 (MW ≥ 4.5) First-order alignments Individual segments Attitude Dimension(km) n. in Tab.1 Date ML MW Depth (H) Locality Date Io MCS MW S=Strike D=Dip angle R=Rake L=Length Ws=Surf. Width H=Depth Slip rate (cm/y) Inner Ferrara Thrust Quarantoli S=N100°±5° D=35°±10° R~85° L=25±1 Ws=15±1 H =10.5±0.5 0.25-0.50 20-EQ2 28 2 36 May 29 May 29 May 29 June 3 5.8 5.3 5.2 5.1 5.8 5.5 -5.1 8.6-8.8 9.7-9.9 7.1-8.3 5.1-5.8 Mirandola* Moglia* 1761 1778 Middle Ferrara Thrust Poggio Rusco S=N105°±5° D=30°±10° R~ 90° L=24±1 Ws = 16±1 H= 9.5±0.5 0.10-0.50 2-EQ1 8 May20 May20 5.9 4.9 6.1 5.3 2.9-5.3 9.2-10.9 Poggio Rusco Bassa Modenese 1901 1987 6 6 4.7 4.6 Casaglia S=N115°±5° with lateral bends
D= 30°±10° R~100° L=23±1 Ws=17±1 H=9.5±0.5 0.10-0.50 3 10 11 May 20 May 20 May 20 5.1 5.1 4.5 4.5 5.3 4.9 6.1-8.6 3.2-10.8 3.1-5.0 Finale Emilia F.Emilia-Carpi * Bondeno 1574 1639 1986 6 7-8 6 4.7 - - 4.7 Outer Ferrara Thrust Sermide S=N110°±5° with lateral bends D=25°±10° R~95° L=32±2 Ws=18±2 H=8.5±1.5 0.10-0.50 1 July 17 2011 5.0 Ferrara Ferrara Ferrara Ferrara Ferrara 1346 1410 1411 1561 1570 6-7 6-7 7 5-6 7-8 4.9 4.9 5.1 4.5 5.5
activated by the Sermide 2011 earthquake (MW 5, event n. 1 in Table 1). This event is sited 15
km NNE-ward of EQ1 at a depth of 3-4 km (Fig. 7b). It presents a thrust focal mechanism with a south-dipping preferential seismic plane and a N-S trending P-axis (Fig. 1c), similar to those of the Emilia 2012 events (Fig. 1c). In light of the map-view location of the box-shaped 1570 individual source, as given in the literature (Pettenati et al., 2013; Vannoli et al., 2014), the hypothesis of an association of the 1570 earthquake with the Sermide source may be advanced (see section 6 of Fig. 8).
Summarizing, the reconstructed FTS fault segments are all substantially similar in size (about 25 km long and 15-18 km wide), apart from the slightly larger Sermide segment, and in the average dip-angle (25° to 35°). A variation in strike from nearly E-W to nearly WNW-ENE is evident going from the Quarantoli source towards the Casaglia one. This pattern is well supported by the attitude of the major events’ preferential seismic planes (Pondrelli et al., 2012; Scognamiglio et al., 2012), as well as by the elongation axes of the co-seismic en echelon ground doming revealed by InSAR data (Tizzani et al., 2013).
5.3. Some further hints
1 - The Emilia 2012 seismogenic fault patches, highlighted by the hypocentral distribution, ruptured along-strike throughout almost the entire Quarantoli and Poggio Rusco segments (for a total length of about 35 km), plus a large portion of the Casaglia segment (for an additional length of about 15 km). As in other such cases around the world, the segmentation pattern appears to control the nucleation and the extent of earthquake ruptures (Manighetti et al., 2015). Therefore, the identified segmentation pattern may help to explain the unusual large size of the Emilia 2012 epicentral area, which as a whole extends for about 50 km along strike (Fig. 1c), with a length far beyond the rupture length derived from scale laws. In fact, if we exclude the seismic activity associated with the independent Casaglia segment, the along-strike length of the Quarantoli and Poggio Rusco segments is closer, although still great, to the subsurface rupture
length yielded for EQ1 (MW 6.1) and EQ2 (MW 5.8) by the Wells and Coppersmith (1994)
relationships.
2 - Based on the long-term kinematic/geometric evolution of the Ferrara Arc, as reconstructed on the basis of stratigraphic-structural constraints (Ghielmi et al., 2010) and on the present deformation field, as derived from geodetic and earthquake data, we consider that in Middle Pleistocene times (at about 0.6 My), the Ferrara Arc had almost achieved its present geometric configuration. Since then, the active NNE-directed compression was mainly localized along the frontal sectors of the arc, e.g., the WNW-ESE striking FTS, and the WSW-ENE lateral ramp of the MTS. Conversely, the WNW-ESE striking frontal portion of the Mirandola Thrust was abandoned and not active anymore. In such a context, the observed uplift of the Cavone anticline that occurred in the Late Pleistocene and Holocene (0.16 mm/yr, Scrocca et al., 2007) would not represent active Mirandola thrusting, but might be related to the displacement occurred on the innermost FTS segment (e.g., Quarantoli segment), passively carrying the pre-existing Mirandola compressional structure.
3 - The time-space distribution of the historical and instrumental events associated with the NNE-directed thrust process at the front of the Ferrara Arc shows how the seismogenic deformation progressively migrated westward along-strike, activating different en echelon segments. The 1570 earthquakes may have ruptured the easternmost FTS segment (e.g.,
Sermide in our reconstruction) (Fig. 8), whereas the Emilia 2012 sequence ruptured the two westernmost ones (Poggio Rusco and Quarantoli). A further westward migration of the rupture process might find a physical barrier played by the sharp change in direction of the front of the Ferrara Arc, which assumes an ENE-WSW strike along the lateral Mirandola ramp. We cannot exclude that in the future the earthquake rupture process might effectively jump from the S-dipping Quarantoli Thrust, activated by the May 29 event, to a lateral SSE-dipping structure (Fabbrico segment in Fig. 9a), thus continuing its westward propagation pattern.
6. Discussion on the likelihood of triggering effects
6.1. Models and results in the literature
The likelihood of triggered seismic activity in the Emilia 2012 thrust earthquakes due to hydrocarbon exploitation and related activities within the Cavone field was deeply explored by two international committees, Astiz et al. (2014) and ICHESE (2014). These two committees used geological, seismological, and geophysical data with statistical analyses and/or mechanical modelling. They reached different conclusions, both regarding the geometry and structural style of the activated fault system and the likelihood of triggered effects.
ICHESE (2014) interpreted the Ferrara Arc as a low-angle fault-bend-fold system developed in the hanging-wall of a first-order flat-and-ramp basal thrust. Specifically, the Mirandola thrust was interpreted as the portion of the basal thrust underlying the Cavone reservoir, and the Ferrara Thrust as one of the hanging-wall second-order breaches, splaying from the basal Thrust. The May 20 event was interpreted as being located at depths of ~5 km on the Ferrara Thrust and the May 29 at depths of ~9 km on a blind high-angle thrust, located beneath the Cavone reservoir within the Mirandola Thrust footwall volume. A completely different geometric interpretation was the one proposed by Astiz et al. (2014). These authors reconstructed a fault-propagation fold system organized in two independent first-order thrust structures, Mirandola and Ferrara, each articulated in high-angle fault segments (average dip angle of 45°-50° for Mirandola and 55°-60° for Ferrara) propagated to depths of 18-20 km. They located the May 29 event on the northern Mirandola segment at depths of about 5 km, and the May 20 event on the Middle Ferrara segment, at a depth of about 10 km.
ICHESE (2014) highlighted that the extraction/injection activities during the life of the Cavone reservoir determined a net depletion of the reservoir (negative volume difference of 21%) with a consequent negative static stress change that would have inhibited earthquake activity rather than enhancing it. On the other hand, they observed a statistical correlation of the last pre-May 20 seismic activity and the May 20 main event with pressure increase within the C14 wastewater injection well, a deep well (3350 m) of the Cavone field, active in the time period 2011-2012. Therefore, they advanced the hypothesis that fluid circulation from the reservoir might have reached the Ferrara Thrust, which in their interpretation was in physical and hydraulic connection with the Mirandola Thrust, perhaps triggering the May 20 earthquake. Conversely, they excluded triggering effects for the May 29 event, mainly because, in their interpretation, its source thrust was separated from the overlying Mirandola Thrust and Cavone reservoir by a thick layer of marly deposits, which would have constituted a real barrier for fluid circulation.
Astiz et al. (2014) rejected the hypothesis of fluid-injection-driven triggering in the May 20 case not only because they did not recognize any statistical correlation and calculated negligible values of stress changes, but also because in their geometric interpretation, the Mirandola and Ferrara thrusts were independent structures, not in contact. Based on physical-mathematical models and associated simulations, Astiz et al. (2014) calculated at the May 20 hypocentre a Coulomb stress variation close to zero due to fluid injection, extremely small stress increases (0.09 mbar) due to mass removal, and slightly negative variations (less than a mbar) due to pore-elastic stress changes. At the May 29 hypocentre, they calculated a negligible (<0.01 bar) Coulomb stress variation due to fluid injection, an extremely small increase (0.09 mbar) due to mass removal, and slightly negative variations (less than 1 mbar) due to pore-elastic stress changes. More significant Coulomb stress variations (up to 2-3 bar) were calculated by Astiz et al. (2014) as a result of fluid injection within the C14 wastewater well (Fig. 2), but the modeled perturbation ring only extended a few hundred metres around the well and, therefore, it would not have been capable of reaching the May 20 and 29 hypocentral areas. Summarizing, according to Astiz et al. (2014), the evaluated stress changes are too small (<0.1 bar) and localized to be able to produce any effect (retarding or anticipating) on both the May 20 and 29 fracturing processes, also considering that a value of 6 bar was calculated for the static Coulomb stress triggered by the May 20 main event on the May 29 source (Pezzo et al., 2013).
6.2. Spatial interplay between seismogenic faults and extraction/injection wells in the Cavone oil field
From the above discussion it seems evident that an unloading-related triggered seismicity is unlikely in the Emilia 2012 sequence case, substantially due to the modest Cavone field size, the modest long-term extraction volumes (average yearly production during the last seven years was 30,000 tons) and, most of all, the lack of a net reservoir depletion. Conversely, fluid injection processes, such as those associated with the C14 wastewater disposal, might be responsible for significant Coulomb stress variations (up to 2-3 bar), but, according to the Astiz et al. (2014), the latter would have remained too localized around the well itself to be responsible for triggering effects on the two major events of the Emilia 2012 sequence.
In the more general literature on induced/triggered activity (Grasso, 1992; Grasso and Sornette, 1998; Mulargia and Bizzarri, 2014 among many others), it has been demonstrated that: 1) even very small overpressure (<1 bar) due to injection fluids may be capable of triggering destructive earthquakes (M >5.5) on a nearby active fault; 2) fluid may propagate as a slow stress wave for large distances (tens of kilometres); 3) destructive earthquakes (M >5.5) may also occur with large time delays (even 10 years) far from the injection site. Therefore, the knowledge of the deep fault pattern is crucial to identify the likelihood of fluid paths that might favour the connection between the reservoir and the hypocentral area. In order to identify the presence or not of suitable fluid paths in the Emilia 2012 specific case, as well as in the case of future earthquakes in the same area, we summarize the here reconstructed spatial relationships among the Emilia 2012 earthquakes, the Cavone oil field, and the identified seismogenic segments.
1 - The May 20 main event (EQ1, MW 6.1) nucleated far from the Cavone oil field, at an
epicentral distance of about 20 km ENE-wards of the injection well Cavone 14 (C14), at a depth of about 4 km (Figs. 2 and 7). The rupture did not propagate towards the oil field, but further
east (Convertito et al., 2013). The EQ1 aftershock sequence extended in a nearly WNW-ESE direction, entirely eastwards of the Cavone oil field (from about 10 to about 35 km eastwards of C14) (Fig. 7a). The EQ1 seismogenic thrust (e.g., Poggio Rusco segment) was not in any physical contact with the Cavone reservoir or with the underlying Mirandola Thrust. It was separated from both of them by the fold-and-thrust rock pile of its own hanging-wall and by that of the Quarantoli segment hanging-wall (see section B in Fig. 7b).
2 - The May 29 main event (EQ2, MW 5.8) nucleated at a closer epicentral distance from
the Cavone field (~10 km westwards of C14)¸ at a depth of about 9 km. Its sequence extended in a nearly E-W direction, from about 8 km eastwards to about 15 km westwards of C14 (Fig. 7a). Although the EQ2 epicentral area largely overlapped with the Cavone oil field, there was no direct and/or indirect contact between the EQ2 seismogenic patch and the reservoir at the hypocentral depths. In fact, the EQ2 seismogenic patch is not a portion of the Mirandola thrust, underlying the Cavone anticline, but rather of the deeper Quarantoli segment (Fig. 7). According to our geometric interpretation (Fig. 7b), this segment does not show any physical contact with the Mirandola Thrust and is separated from it, and from the Cavone reservoir, by the its own hanging-wall rock volume.
3 - Four of the relevant EQ2 aftershocks (ML or MW ≥4.9 in Table 1) had their epicentres
located just above the Cavone oil field, at horizontal distances less than ~3 km with respect to the C14 well (Fig. 2). In section view (Figs. 7b and 8), three of them (two dated May 29 and one June 3, ns. 28, 29 and 36 in Table 1) appear unrelated to the Mirandola Thrust and rather associated with the Quarantoli segment. Conversely, the fourth one (May 29 at 11.00.01
UTC, MW 4.4, depth 7.5, n. 30 in Table 1), hereafter referred to as EQ#, is located close to the
Mirandola Thrust, at a horizontal distance of ~2 km and a vertical distance of ~4 km from the C14 bottom (Fig. 7b). Close to the Mirandola Thrust, and beneath the Cavone reservoir, are
also located two smaller events of our data set, one that occurred on May 25 (MW 4.2, depth
5-6 km, n. 16 in Table 1) and the other on May 29 at 07.07.18 UTC (ML 4.0, depth about 4 km,
n. 21 in Table 1) (Fig. 8). We consider that these three events (e.g., ns. 16, 21, and 30 in Table 1), which are located far from the two main EQ1 and EQ2 seismogenic patches (Poggio Rusco
and Quarantoli segments) and close to the Mirandola thrust and the C14 well, might indeed
represent triggered events of the Emilia 2012 sequence due to fluid pressure increase at the C14 well.
4 - In correspondence with the Cavone epicentral area, the Emilia 2012 earthquake catalogue relocated by Govoni et al. (2014) shows: a) a relevant clustering of macroseismic activity
(events up to ML 3.5 plus a few ones with ML 3.5-4.0) located at depths between 3.0 and 4.5
km; b) another distinct group of events (ML up to 5.0, including our three previously discussed
events ns. 16, 21, and 30) located at depths between 4.5-6.0 km; c) a third group of deeper events, including EQ2, located in the 7-9 km depth range. We observe that the shallow low-seismicity layer (3.0-4.5 km) is just concentrated at the Cavone hydrocarbon reservoir depths and that the intermediate-depth seismic layer (4.5-6.0 km) well coincides, in our interpretation (Fig. 8), with the portion of the Mirandola Thrust that underlies the oil field and that is not far from the region close to C14. Therefore, we advance the hypothesis that an increase of pore pressure immediately below the reservoir, stimulated by fluid injection and waste storage, might have favored such seismicity (triggered or even induced), moving the Mohr circle towards the origin and thus reactivating the now tectonically inactive frontal sector of the Mirandola Thrust.
Conversely, the deeper third group of events (7-9 km depth) beneath the Cavone oil field well coincides with the seismogenic patch of the Quarantoli segment, as interpreted in this paper (Figs. 7b and 8). Therefore, in our opinion, for this third group of events, a human-activity triggered component can be excluded.
5 - The C14 wastewater injection well, as several other wells of the Cavone field shown in the maps of Figs. 7 and 9, falls within the western half of the Quarantoli source, close to the northern end of the WSW-ENE striking left-lateral lateral segment of the MTS. Whereas the southern portion of this segment is associated with historical and instrumental activity (e.g.,
1831 and 1832 MW 5.5; 1806 and 1810 MW 5.0-5.5; Reggio Emilia 1996 MW 5.4), its northern
portion, which extends for nearly 15 km from Fabbrico towards Moglia (Fabbrico segment in Fig. 9a), is not connected with any historical or present seismic activity. Therefore, the question arises whether a net injection pressure increase, such as that observed at C14 and localized close to the northern end of the Fabbrico segment, might favor the rupturing process, thus anticipating
the occurrence of future strong earthquakes (MW ≥5.5).
7. Conclusions
In this paper, based on our earthquake relocation (MW prevalently ≥4, Table 1) and geologic
interpretation, we identify the fault segments involved in the Emilia 2012 sequence and define their geometry, structural style, and deep interplay. Our goals were: a) to propose an updated individual source model for the FTS and, b) to verify if the tectonic pattern was favorable to a possible propagation of injection-related fluids and pressure variations from the Cavone oil field to the seismogenic patches, with consequent implications in terms of triggered effects. The main results and/or points that warrant further discussion can be summarized as follows.
1 - The dominant structural style within the Emilia 2012 seismic area is that of a basement involved low-angle fault-propagation fold system, with two distinct major thrust systems, the Mirandola and Ferrara ones (MTS and FTS), splaying up from the common SSW-dipping Ferrara Arc basal thrust, and each one being organized in second-order individual segments. Starting with Late Pliocene times, the Ferrara Arc basal thrust and its splays progressively nucleated and propagated upwards, controlling the development and growth of the foreland-convex Ferrara Arc, and specifically of the MTS first, and of the FTS later on (Figs. 1b and 7b). With the end of the Early Pleistocene, the outer front of the Ferrara Arc reached its present location, and the ongoing NNE-directed compression was mainly accomplished by almost pure shortening along the E-W to WNW-ESE structures of the FTS and by oblique-deformation along the WSW-ENE left-lateral ramp of the MTS.
2 - The internal organization of the FTS is more complex than previously known (Pezzo et
al., 2013; Tizzani et al., 2013; Govoni et al., 2014; among many others). In fact, four major
individual thrust segments, almost equivalent in size (nearly 25 km long and 15 km wide), can be recognized: Quarantoli, Poggio Rusco, Casaglia, and Sermide (Figs. 7 and 9 and Table 2). Quarantoli and Sermide are nothing else than the Inner and Outer Ferrara thrusts Auctorum; Poggio Rusco and Casaglia are up to now undervalued along-strike complexities of the Middle Ferrara Thrust.