DOTTORATO DI RICERCA IN Economia e metodi quantitativi
CICLO XXVIII
COORDINATORE: Prof. Luca Salvatici
Thesis
Large Scale Land Acquisition
Candidate: Giovanna D'Agostino
Tutor: Prof. Salvatore Monni
Co-tutor: Caterina Conigliano
Co-Tutor: Nadia Cuffaro
1. Investments in Agriculture Land: Drivers, Dimension and Geography.
2. What are the pull factors of land demand in Africa?
3. A meta analytic assessment of the effects of Land Inequality on Growth.
4. Conversion Forest Land to Crop Land: Environmental Impact!
Natural resources are likely to become, over the 21st century, the focus of an intensified competition among different uses, competition triggered by the rapidly increasing demand for water, energy, food and minerals related to population growth and urbanisation, and by changing lifestyles and diets. The availability of any kind of resource has a strict dependence on land. This dependence is very high for agriculture and water, and very significant for energy and minerals. Land ownership and use adds layers of complexity in the nexus relating water, energy and food, which are the key pillars of human well-being and societal development globally. In global this context, it seems to be important to increase understanding of the converging global dynamics that have spurred a global rush for agricultural land in Africa, Latin America and parts of South-east Asia, which has intensified after the food price crises in 2007-2008, after many years of little investments in the agricultural sector. This trend is generally referred to as land grabbing and is characterised by purchases or long-term leases (which typically run for 50 to 99 years) of farming land by either private or public investors.
In the first part of the thesis, I have reviewed the literature, explaining the drivers and the trends of Large-Scale Land Acquisitions (LSLAs). It is easy to see that the majority of such investments are targeting Africa continent. This because at the first sight the continent presents the most available land in the world ready to be cultivated. “Available”, “degraded” and “underutilized”, have became epithets in common usage among proponents of large-scale land acquisitions, rendering landscapes as commodities ready for the taking. Foreign and local investments offer crucial opportunities to recipients in terms of access to capital, technology and innovation, foreign market access and infrastructure development. However there are development risk associated with insecure property rights and land concentration. Hence, concern for the recent capital flows is linked to the likelihood that it may shift the path of agricultural development away from smallholder strategies, with the possible negative implications extensively discussed in the development and agricultural economics literature.
for large-scale agriculture. Results confirm the central role of agro-ecological potential as a pull factor, and also that such investments in Africa are targeting forested areas. During the 1980 – 2000 period, more than half of the new agricultural land across the tropics came at the expense of intact forests, and another 28% came from non intact forests, raising concerns about environmental services and biodiversity globally. Intensive farming, which continues to increase, has resulted in loss of natural habitats and species living in them. Forest and mixed-use woodlands are often targeted by government for agriculture expansion in order to avoid the displacement of crop land.
In the third part of my thesis, I have analysed the link between inequality access to land and growth, given that the large size of foreign and domestic capital flows in conjunction with state landlordism in Africa may result in a development path that is geared towards large farms and land concentration. The average size of a farm in Africa is 2.2 ha, namely a very small size if compared to investments in land that are at least 200 ha large. In order to analyse the above link I have used a meta regression technique to review the land inequality literature. A large literature on inequality and growth has firmly established a strong role of land inequality as determinant of income inequality, and the negative impact of land inequality on long term growth; long term analysis also clearly shows that inequality in asset ownership once established is very difficult to reverse. The policy implications are that smallholder or outgrower strategies should be encouraged also in a context of large-scale deals, the degree of legal protection of land rights is crucial, elements of land related corporate social responsibility could usefully integrate public regulation in the domain of protection of user's rights. In the last part, I have done a preliminary assessment of loss of carbon following the conversation of land use from forest to crop land. Converting a forest to crop-land, for example, for biofuels production can result in much more global warming pollution than the amount that can be reduced by the biofuels grown on that land. Thus, I have assumed that 30 per cent of such investments are happening on forest land, unfortunately the inaccuracy of localization data do not allow an assessment more precise.
Investments in Agriculture Land: Drivers, Dimension and Geography 1
1.1 Introduction 1
1.2 General Picture of the phenomenon 2
1.3 Background. Natural Resources 8
1.3.1 Land 8
1.3.2 Land use and suitability 9
1.3.3 Forest 9
1.3.4 The access to land and the small farmers 10
1.3.5 Land tenure 13
1.3.6 Small-scale versus large-scale farms 13
1.4 Land Rush: Drivers 14
1.5 Who is making international deals? 19
1.6 Where international deal are happening? 25
1.7 Conclusion 33
References 36
What are the pull factors of land demand in Africa? 50
2.1 Introduction 50
2.2 Literature Review on Foreign Direct Investment 57
2.3 Data and Methodology 59
2.3.1 Data 59
2.3.2 Methodology 65
2.4 Conclusion 80
References 82
Appendix 1. Results from Unilateral Beta Regression of the Single Actual Contract Size 90
A meta analytic assessment of the effects of Land Inequality on Growth. 91
3.1 Introduction 91
3.2 Land Inequality and Growth: brief literature review 93
3.2.1 Empirically oriented analysis 94
3.2.2 Political economy models 95
3.2.3 Econometric analysis of colonialism 97
3.3.3 Pooled Fixed and Random effects estimates of the effect size 102 3.3.4 Testing for heterogeneity of effect size 105 3.4 Testing for the presence of publication bias 105
3.4.1 Bias in the publication of the results 105
3.4.2 Bias in the magnitude of the results 107
4. Meta-Regression 107
5. Conclusions 112
References 114
Appendix 1. List of case studies included in meta sample 119
Conversion Forest Land to Crop Land: Environmental Impact! 121
4.1 Introduction 121
4.2 Why Forests are important? 125
4.2.1 A brief description of the forest ecosystem c cycle 126 4.3 Carbon stock change in biomass due to the conversion of land from Forest condition to
Crop Land condition in Africa
128 4.3.1 Estimation to calculate carbon stock change 130
4.4 Conclusion 137
References 139
Appendix 1. List of Contracts and Tree Cover Loss 143 Annex 2. Worksheet to calculate Annual Change in carbon stocks in biomass due to Land
Converted to Crop land. 149
Index of Figures
Investments in Agriculture Land: Drivers, Dimension and Geography
Figure 1 - Total size of intended and concluded LSLAs over time. 6
Imagine 1. Land Investments in Ethiopia. 7
Figure 2 – FAO Food Price Index. 8
Figure 3. Gini Index for Land Distribution. 11
Figure 4. Patterns and trends in farm sizes in some African countries. 12 Figure 5. Global Distribution of Agricultural land. 12
Figure 8. French Investments in Africa (million ha). 20 Figure 9. Deals divided by intention of investment. 22
Figure 10a. Investors in Africa. 27
Figure 10b. Average Deal Size for Investors in Africa. 28
Map 1. Large Scale Land Acquisitions in Africa. 29
Figure 11. Contract Size for Each African Target Country (million ha). 30 Figure 12a. India Land Investments in Africa. Number of Deals. 32 Figure 12b. Gulf Countries Land Investments in Africa. 32
What are the pull factors of land demand in Africa?
Figure 1. Large Scale Land Acquisitions. 52
Figure 2. Histogram of Explanatory Variable 72
A meta analytic assessment of the effects of Land Inequality on Growth.
Figure 1. Funnel Plot 106
Conversion Forest Land to Crop Land: Environmental Impact!
Figure 1. The world's tree: 15 billion trees are cut down yearly, a loss more than two trees for every person
122 Figure 2. Countries with Fastest Acceleration of Tree Cover Loss 2001 – 2014 124 Figure 3. Annual net forest gain/loss (ha) by country (1990-2015) 127
Figure 4. Map of Investments 130
Index of Tables
Investments in Agriculture Land: Drivers, Dimension and Geography
Table 1. Estimated inventories of areas involved in large - scale land investments. 5 Table 2. Change in Crop Harvested Area by Region, due to EU and US Biofuel Mandates. 16 Table 3. Land with Potential for Rainfed Crop Production (Million Ha). 17
What are the pull factors of land demand in Africa?
Table 1. Foreign Direct Land Investments in African Countries and Land Tenure
Insecurity 60
Table 2. Covariates, Definitions and Sources 62
Table 3. Results from Unilateral Poisson Regression of the Number of Projects 73 Table 4. Results from Unilateral Beta Regression of the Total Actual Contract Size for
Country
76 Table 5. Results from Unilateral Beta Regression of the Single Actual Contract Size 77
A meta analytic assessment of the effects of Land Inequality on Growth
Table 1 - List of the studies included in the meta sample and estimates of the effect size
reported in the primary studies 100
Table 2. Results of the meta-regression 109
Conversion Forest Land to Crop Land: Environmental Impact!
Table 1. Land Converted to Cropland: Estimates of annual net CO 2 emissions and removals from forest (woody biomass C stock changes only)
Investments in Agriculture Land: Drivers, Dimension and Geography.
1.1 Introduction.
The second half of the first decade of this century has witnessed an increased attraction for lands for agricultural use, especially in developing countries caused by the impression of vast available land, cheap labour and land, favourable climate for agricultural production, and availability of water resources to be used to irrigate at relatively low costs (De Schutter, 2009). Large-scale land acquisitions (LSLAs) in developing and, to a lesser extent, in former transition countries, represents a new and growing issue at global level. It has been reported and emphasized by several papers and press articles, documenting a large number of deals (Friis et al., 2010; Grain, 2008; Cotula et al. 2009; FAO, 2009; GTZ, 2009). This flood of investments, the majority of which has been done for agriculture use, has been critically labelled as “land grabbing”, this because the deals involve crucial assets, such as land and water, usually in a context of complex and often insecure property rights (Cuffaro et al., 2013). However, discussion about the phenomenon reflect different positions. Some authors have highlighted the negative impact of these investments on natural resources, livelihood and sovereignty (Davis et al, 2014; Rulli et al., 2013; Deininger, 2011; De Schutter, 2011). Others see these investments as a path for economic and social development that may come from capital inflows in the target economies (World Bank, 2011; German Federal Ministry for Economic Cooperation and Development (BMZ), 2009).
International investors come from all over the world: Europe, Asia, Middle East and North Africa and North and South America but also Sub Saharan Africa had started investing in land for different purposes: agriculture, tourist resorts, biofuels cultivation and so on. Indeed, starting from 2007, the demand for land rose at an unprecedented pace and at the same time a range of new peculiar aspects appeared (Deininger et al., 2011). Water demand, also, for the agriculture sector is supposed to
increase by at least 20% by 2050, even in the presence of productivity improvements through technological development (De Fraiture et al., 2007). In order to meet the production of food and animal feed an additional 47 million ha of land will be needed by 2030, and also 42-48 million ha will be needed for large-scale afforestation and 18-44 million ha for producing biofuels feedstock (ERD, 2012). However the amount of land to put under cultivation is unequal located, with large tracts of land in Sub-Saharan Africa and Latin America and, to a lesser extent, East Asia (FAO, 2011).
1.2 General Picture of the phenomenon.
During the 2011 Tirana Conference the International Land Coalition defined land grabbing as land acquisitions that are in violation of human rights, without prior consent of the pre-existing land users, and with no consideration of the social and environmental impacts. In many cases, land grabbing is not the result of a transparent and democratic decision process (International Land Coalition, 2011; Rulli, 2012). The legitimacy of foreign land deals is one of the most controversial issues debated by the scientific community worldwide (IFAD, 2011). It has been discussed that, in countries characterised by weak land governance and high corruption, politicians often allow concessions to investors in return of bribes and allow eviction from land of local farmers, often without adequate compensation (Vermeulen et al., 2010). Many American and European companies have set up arrangements in food - deficit countries, such as Ethiopia, Mozambique and Tanzania, and switched land-use from growing crops for food to biofuels (FAO, 2009). Furthermore it has been calculated that the share of biofuels production is almost three times larger than the share of food production (Anseeuw et al., 2012b).
Farmland acquisition is not certainly a new phenomenon, however some facets of the current trend are new, including its range and the complex set of drivers, namely a combination of food, energy, climate and financial crises (Quagliarotti, 2013). In fact, looking back through centuries of human
history, it is possible to find similar events in the North, South, East and West, including pre-colonial confiscated land associated with territorial wars, European possessions in the North, and dispossession of native people in North America. “In many regions of the global South, land was first grabbed by pre-colonial rulers in chronic territorial wars with each other, then by colonial governments and increasingly by foreign or domestic corporations” (White et al., 2012). But the history of land grabbing reveals much more than just the fact that the phenomenon is not new. There is a general consensus that a number of aspects distinguish the most recent flood of land grabbing from the past.
First, the trend is happening at a relatively fast pace, caused by changing dynamics in the global food regime, in energy security responses, in environmental protection in the context of climate change, and in the international flow of finance capital searching for safe investments after the failure of sub-prime mortgage markets in the North.
Second, the trend is large-scale acquisitions of land. Examples are 50,000 hectares acquired in Kenya by UK company Jatropha Africa in 2011 for jatropha production; 250,000 hectares acquired in Ethiopia by MIDROC Group of Saudi Arabia in 2008 for jatropha and oil palm production; and 50,000 hectares acquired in Senegal by the Italian company Nuove Iniziative Industriali srl in 2010. Third, the trend is also long-term leases, purchase or other economic arrangements. The basic land transactions typically vary from 30 to 50 or even 99 years at a time, often with the option to be renewed too.
Fourth, the trend has become global in scope and allocation. The phenomenon it is happening everywhere, throughout South and Central America, throughout South and South-east Asia, and in many parts of the global North, even in the former Soviet Eurasia, but Africa is certainly a hotspot. To sum up, distinctive elements are:
the major role played by both public and private foreign investors mainly targeting arable land and forests in the developing world, and
the increasing pressure on land as a resource, which follows the multiplication of competing uses for land (Anseeuw et al., 2012a; Cotula, et al, 2009; Cuffaro et al., 2013).
This combination of factors pushed civil society groups and transnational networks to alert the world about the global land grab under-going and its possible negative impacts on communities and fragile ecosystems (Fairhead et al., 2012). In the most of the cases, these large land deals are not properly acquisitions. The land, usually, has been leased to be exploited by domestic or international actors. This because arable land tend to be a scarce resource in several rich and emerging countries, e.g. Gulf Countries, while it seems to be available in most developing countries, especially in Sub Saharan Africa, where it is still underutilized by the local populations or enterprises (FAO, 2011). Deininger & Byerlee (2011, p. XIV) provide a good picture of the LSLAs phenomenology: “The demand for land has been enormous. Compared to an average annual expansion of global agricultural land of less than 4 million hectares before 2008, approximately 56 million hectares of large-scale farmland deals were announced even before the end of 2009. More than 70 percent of such demand has been in Africa; countries such as Ethiopia, Mozambique, and Sudan have transferred millions of hectares to investors in recent years.”
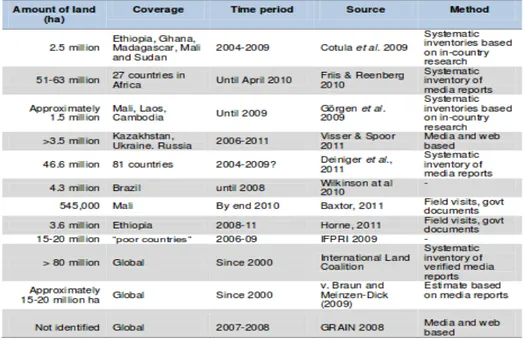
It is important stressing that the overall size of LSLAs is not precisely known, and the existing estimates vary according to the selected sources and the criteria on which each list is being built, i.e. time frame, geographic coverage and information collection method (Table 1).
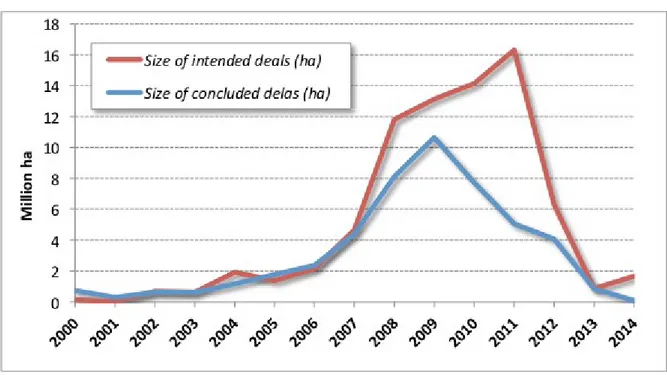
Similarly, the trend of the amount of land demanded over time is not clear. It seems that after the fast growth experienced from 2008 in the last years the demand for LSLAs has slowed down, according to Land Matrix data (Figure 1).
monitoring initiative that promotes transparency and accountability in decisions over land and investment1. The Beta version of Land Matrix, that has been launched in April 2012 and upgraded
in June 2014, provides the best source of data to account for land acquisitions worldwide.
Table 1. Estimated inventories of areas involved in large - scale land investments. Source HLPE , 2011
The land transactions, included in the Land Matrix database, are those which:
entail a transfer of rights to use, control or own land through sale, lease or concession; imply a conversion from land used by small-holders, or for important environmental
functions, to large-scale commercial use; are 200 ha or larger;
and were not concluded before the year 2000.
The Land Matrix database records cases of intended and concluded land deals involving foreign and domestic investors, at any level of implementation (under negotiation, start-up phase, in operation, 1 The Land Matrix Global Observatory is coordinated by the following organisations: International Land Coalition (ILC), Centre de Coopération Internationale en Recherche Agronomique pour le Développement (CIRAD), Centre for Development and Environment (CDE), German Institute of Global and Area Studies (GIGA) and Deutsche Gesellschaft für Internationale Zusammenarbeit (GIZ).
failed), obtained by a variety of cross-referenced sources ranging from research papers, personal information, field-based research projects, government records, company websites and media reports. The reported deals refer to six main sectors: food, fuel, timber, carbon sequestration, mineral extraction and tourism. However, a lack of transparency in the involved countries seem to suggest that the scale of the land acquisitions could be underestimated (Anseeuw et al., 2012b). Databases on land transactions are generally affected by both over- and under- estimates (Pearce, 2013). In any case, it has been shown that many of the reported land transactions have never materialised or are not in operation (Verhoeven et al., 2012).
Figure 1 - Total size of intended and concluded LSLAs over time. Source, De Maria, 2015.
The recent decline may simply reflects the delays of the data collection method based on media report, there is a time gap between the information about a new deal and the media publication. Nevertheless, even if the hypothesis that LSLAs were just a bubble that will not repeat in the future, the amount of land that has been traded and the following change in the land uses are so extensive that the effects are likely to be deep and long lasting, therefore further research on the topic are needed.
There is no doubt that Africa is the main target of LSLAs and the increasing demand for its land has generated heated debates about if the net effect is positive or negative for the continent and its people. Although foreign investment is desirable in order to encourage agriculture productive sector, Africa does not need policies that transfer land to investors manly motivated by the urge to export food crops to feed their own populations (Imagine 1) while, Africans wallow in hunger, or to supply biofuels markets across the globe, and meantime small farmers are dispossessed of their main asset and livelihoods.
Imagine 1. Land Investments in Ethiopia. Source: GRAIN, Land Matrix.
In fact, natural resources investments emerged between 2004 and 2005, intensified after 2007 – 2008, when the global food price rose and the economic slowdown revived the interest in investing in agricultural land, peaking in 2009 and slowing down in 2010 (GRAIN, 2008; Anseeuw et al., 2012a). During 2007-2008, the downward trend of food prices of the previous 25 years came to an end (Figure 2), in combination with high and volatile oil and fertilizer prices (FAO, 2009).
Figure 2 – FAO Food Price Index. Source: Author's elaboration.
The raise of food crop demand, both in the EU and in the US, caused by the reduction of food crop stocks (Mitchell, 2008), by the switch of land-use due to the expansion of cultivated land under biofuels feedstock, which reduced, in turn, the production of other crops, and by speculative activities (Mittal, 2009; UNDESA, 2013), affected harshly food prices (about 70% of the increase in maize prices and 40% increase in soy-bean prices). The domestic price of these food commodities increased by 48% in real terms in developing countries (Dawe et al., 2009). Rising food prices, of course, impacted most severely the world’s low-income and food-deficit countries (Maros et al., 2008), not only by putting at risk the main source of livelihood of local populations (especially in the case of cash - crop farmers), but also by reducing their purchasing power (Benson et al., 2008; Minot, 2012). Food represents, in fact, about 60 - 80% of consumer spending in the less developed world, compared with only 10 - 20% in rich countries (UNCTAD, 2008).
1.3 Background. Natural Resources.
1.3.1 Land.
The world’s agricultural production has grown between 2.5 and 3 times in the last 50 years, while the cultivated area has grown only by 12 percent. Actually agriculture uses 11 percent of the world’s land surface for crop production, and uses about 70 percent of all water withdrawn from aquifers, streams and lakes, a figure that approaches 90 percent in countries such as India and China, which
rely on extensive irrigation (FAO, 2011; Fisher et al., 2002). Because of growing population and energy demand, it is necessary to bring more land under cultivation, and the land suitable for cropping is present in those countries where population need to raise production. Large-scale land acquisitions are happening in parts of Africa, Asia and Latin America, where land and water resources appear to be abundant and available. However, contrary to perceptions there is very little empty land as most suitable land is already used or claimed, often by local people. In fact, there is a risk that the rural poor could be evicted or lose access to land, water and other related resources. Many countries do not have sufficient mechanisms to protect local rights and take account of local interests, livelihoods and welfare (Cotula et al., 2009).
1.3.2 Land use and suitability.
The global area of cultivated land has grown approximately by a net 160 Mha since 1961. This increase includes a larger area of land newly brought into cultivation, while over the same period previously cultivated lands have gone out of production. All of the net increase in cultivated area, over the last 50 years, is attributable to a net increase in irrigated cropping. Irrigated area more than doubled over the period, and the number of hectares needed to feed one person has reduced from 0.45 to 0.22 ha per person (FAO, 2010). However, a decline of about 129 Mha in forested area between 1990 and 2015 suggests that the expansion in the cultivated area and the replacement of degraded arable land with new cultivated land have been partly achieved through conversion of previously forested areas (FAO, 2015).
Globally, about 0.23 ha of land is cultivated per head of the world’s population. High-income countries cultivate more than twice the area per capita (0.37 ha) than low-income (0.17 ha) countries, while middle-income countries cultivate 0.23 ha per capita.
1.3.3 Forest (more details in the last part of the thesis).
switch of tropical forests to agricultural land, has recently shown signs of decreasing, but still continues at an alarming rate. However, during the last decade, the net reduction in forest areas has been limited by large-scale planted of trees. Net losses of forested land were concentrated in South America, sub-Saharan Africa, South-east Asia and Oceania, while the US, India, China, Russia and several European countries showed net gains in forested land. Forests play a vital environmental role in the production of timber, wood, fuel, and other products; conservation of biodiversity and wild life habits; mitigation of global change; and control of flood risks. Africa lost some 53 million ha of forest, mainly from expansion of crop cultivation (Fisher et al., 2002).
1.3.4 The access to land and the small farmers.
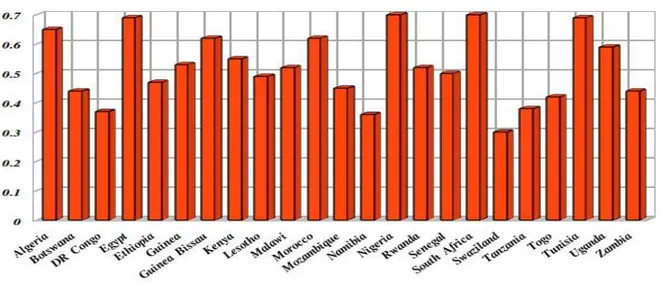
In the rural world, the poorest have no land or have the lowest access to land and water, and low access to land and water is a precondition for poverty. The concentrations of rural poverty can be linked to marginal lands, commonly, poor farmers are locked in a poverty trap of small, remote plots with no secure tenure, poor-quality soils and high vulnerability to land degradation and climatic uncertainty. At the same time, technologies and farming systems are typically low-management, low-input systems that often contribute to resource degradation. However, improved farming systems can modify the relationship between land and water resources and poverty: the likelihood of being poor is much lower when improved farming systems are employed (Hussain et al., 2004). Thus, improving land and water tenure arrangements and management practices in these areas is likely to have a direct positive impact on food insecurity and poverty (Lipton, 2009). In African countries most smallholder farms are gradually shrinking. The average farm sizes has shrunk by 30–40% since the 1970s (Headey et al., 2014). Land inequality is also very high, particularly in Kenya (with a Gini coefficient of 0.55) and Nigeria (with a Gini of 0.70), with evidence of rising Gini Land coefficients over time (Jayne et al., 2014, Figure 3). Between 1994 and 2006, the proportion of Kenya’s farms smaller than one hectare rose from 45 to 74%. (Jayne et al.,
2014). Due to a myriad of forces and factors (such as land concentration, population pressure or lack of access to land) most small farms have been getting smaller over time. Average farm sizes have shrunk in Asia and Africa (Figure 4). In India, the average farm size roughly halved from 1971 to 2006, doubling the number of farms measuring less than two hectares. In China, the average area of land cultivated per household fell by 25% between 1985 and 2000, after which it slowly started to increase due to land concentration and industrialisation. In industrialised countries, where the industrialisation of agriculture is rampant, average farm size is increasing, but not the size of small farms.
Figure 3. Gini Index for Land Distribution* . Author's elaboration
Notes: Figures on agricultural land obtained from FAOSTAT , accessed 2014, * 0 = equity and 1 = inequity
Small farms have less than a quarter of the world's agricultural land (Figure 5) – or less than a fifth if one excludes China and India from the calculation, such farms are getting smaller all the time. However, small farmers still produce most of the food. The UN Environment Programme, the International Fund for Agricultural Development, FAO and the UN Special Rapporteur on the Right to Food all estimate that small farmers produce up to 80% of the food in the non-industrialised
countries (IFAD, 2013).
Figure 4. Patterns and trends in farm sizes in some African countries. Sources: Jayne et al., 2014
In the third part of the thesis, the link between inequality in distribution of land and growth will be examined.
1.3.5 Land tenure.
Land tenure institutions have been modelled on local socio-economic conditions (FAO, 2002). The principal form of traditional tenure was communal, especially in Africa, with well-negotiated rules and norms for individual access. The resulting tenure usually provided security and incentives for farmers to invest in land and water development. Modern systems of legislation have then tended to impose property rights systems on these traditional institutions. As a result, modern laws have rarely defined or protected communal rights. In some situations, this has conducted to progressive dispossession and inequity in land distribution. When population densities were low and farming systems at subsistence level, the tensions implicit in this legal asymmetry were largely hidden. Nowadays, demographic growth have put pressures on both resources and traditional institutions. At the same time, rapid technological and economic changes have taken place but have not been accompanied by adaptation of social institutions.
1.3.6 Small-scale versus large-scale farms.
The debate about the large scale land acquisitions has renewed the issue on which is the best solution for agricultural growth: small-scale farm versus large-scale farm. The success of the Green Revolution, especially in Asia where almost 90 percent of wheat fields were planted with modern procedures and rice yielding had increased from 12 to 67 percent, has stressed the efficiency of small-scale farms. This success of Asian countries compared to the unequal agrarian structure of Latin America countries enforced small-scale model. The Green Revolution, meaning the adoption of high-yielding varieties, was largely made possible by investments in fertilizer and irrigation. The massive use of fertilizers changed agricultural practices forever. Irrigation - thanks to which water can be stored and sent to dry areas, putting more land into agricultural production - also increased
production. The Green Revolution exponentially increased the amount of food production worldwide and sharply reduced the incidence of famine, especially in Asia. What needs to be done in order to achieve higher yields and, thus, agricultural growth in Sub-Saharan Africa? Consensus about the need for a Green Revolution in Africa is universal but the characteristics of the African continent urge for a different solution. In comparison with Asia, Africa is heterogeneous in terms of agro - ecological conditions, farming systems, and types of crops planted. The FAO considers that there are 14 main farming systems in Sub-Saharan Africa (Staatz and Dembele, 2007). They depend rather weakly on rice or wheat, which have been the drivers of the Asian Green Revolution. Moreover, most agriculture in Africa is rain-fed (de Janvry and Sadoulet, 2009), whereas the Green Revolution in Asia was partly driven by intensive irrigation. In fact, only 4 percent of crop area in Africa is irrigated, versus 34 percent in Asia. Another factor that makes the Sub-Saharan African context different is the underdevelopment of infrastructure, which slow down market access and leads to high transportation costs. As a consequence, several geographically separate revolutions will have to take place across Sub-Saharan Africa (Staatz et al., 2007) to obtain the same results as in Asia.
Growth in smallholder agriculture has been shown to have higher impact on poverty reduction respect to growth in other sectors (Loayza et al., 2010). However, the success of Brazil's large-scale farms have pushed to consider the large-scale mechanized farming as the path to improve the agriculture sector. But, this formula had no success in Sub Saharan Africa to improve productivity (Collier et al., 2009). Moreover, the experience of large-scale farming, during the course of history, has been largely negative (Deininger et al., 2011). A monopoly on land has often been associated to policy distortions, for example to drive down wages (Binswanger et al., 1995).
1.4 Land Rush: Drivers.
year (FAOSTAT), this increase was unevenly distributed between industrialised and no industrialised countries, most of expansion happened in Sub Saharan Africa, Latin America and East Asia.
Here some factors pushed this expansion (World Bank, 2011):
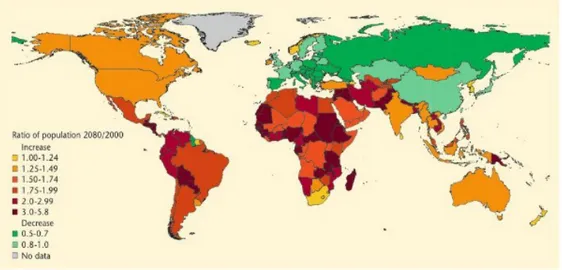
1. Growth of population (Figure 6) and income and consequence surge of demand for food, feed and other raw materials. The need to secure food supplies in the long term, especially for land and water scarce countries, this is the case, for example, of the arid and semi-arid countries as countries in the Middle East (Jagerskog et al., 2012).
Figure 6. Global population growth and decline by country (2000 – 2080). Source: WWAP (2009)
2. Current studies indicate that world population will growth from 6.9 billion people today to 9.1 billion in 2050 (De Castro, 2012; Bruinsma 2009). In developing countries, the increase will reach up to 100% by 2050, relative to 2009 levels (FAO, 2011). In these areas, population growth will be very intense and often combined with malnutrition (Figure 7). As consequence by 2050, food production is supposed to increase by about 70 percent globally and nearly 100 percent in developing countries (FAO, 2011). The pressures on land and water resources are also likely to be exacerbated by the increasing demands for high - value
animal protein, which are positively correlated to the level of income of a country. About 26% of the world’s land area is used for grazing livestock and 21% of arable land is used for producing cereals for feeding animals (Steinfeld et al. 1997). According to the World Health Organisation (2013), annual meat production will increase from 218 million tonnes in 1997 -1999 to 376 million tonnes by 2030; annual meat consumption is projected to increase from 36.4 kg per capita per year in 1997 - 1999 to 45.3 kg per capita per year in 2030.
3. Demand for Biofuels will grow, as reaction to public policies, especially in Europe and the USA (EU Directive, 2009; EISA, 2007). In 2008, biofuels crop production covered about 2.3% or about 36 Mha of global crop-land, as compared to 26.6 Mha or 1.7% of global crop land in 2007, and 13.8 Mha or about 0.9% of global crop-land in 2004. With growing demand for biofuels, the extension of crop-land for biofuels production is continuing, in particular in tropical countries where natural conditions favour high yields (UNEP, 2009). According some studies, biofuels production is the main purpose of the investments targeting Sub-Saharan Africa (Giovannetti et al., 2013; Anseeuw et al., 2012a). Demand for biofuels feedstock is a major factor for world agriculture land conversion for biofuels, by 2030 some 44–53 million hectares of cultivated land could be used for bio - energy feed-stock production (Fischer et al., 2009). Biofuels mandates also drive expansion of sugar cane for ethanol. Brazil processes half its cane into ethanol, and the cane area is expected to double by 2017 (BNDES, 2008).
4. Land in some regions may be cheaper and productivity higher than in traditional regions, where the productivity already reached its maximum level. A higher potential for yield improvements is commonly seen for developing countries, and often especially for Africa. 5. Finally, another driver for an increased competition for land and water resources is climate
temperature, while increasing the number and severity of extreme events (Bates et al., 2008; UNFCCC, 2007). Climate change will have profound impacts on agricultural production in several ways. While higher temperatures will maybe allow crop cultivation to expand into areas that have traditionally been too cold for crop cultivation, it is likely to reduce yields in hotter climates. However impacts need to be considered on a country-by-country basis, aggregate impacts could be significant. One study estimates that climate change will reduce irrigated wheat yields in developing countries by a 34 percent by 2050 (Nelson, 2009).
Figure 7. Map of world malnutrition. Source: FAOSTAT, 2015.
Summarizing population growth, rising income, and urbanization will continue to drive demand growth for some food, especially vegetable oils and livestock. To cope with an increase in world population, agriculture production need to raise by 70 percent (Bruinsma, 2009).
From 1990 to 2007, growth of harvested areas for different crops was concentrated in a few commodities: soy-bean, rapeseed, sunflower and oil palm accounted for more than half of total growth. Demand for this oil crops raised as consequence of higher consumption of cooking oil in developing countries, as Asia, higher use of soy bean as feed, and demand for biofuels in European Union (World Bank, 2011). In 2008, the total area under biofuels crops was estimated at 36 million
of ha, with 8.3 million ha in European Union (mainly rapeseed), 7.5 million ha in the United States (mainly maize), and 6.4 million ha in Latin America and the Caribbean (mainly sugar cane) (UNEP, 2009).
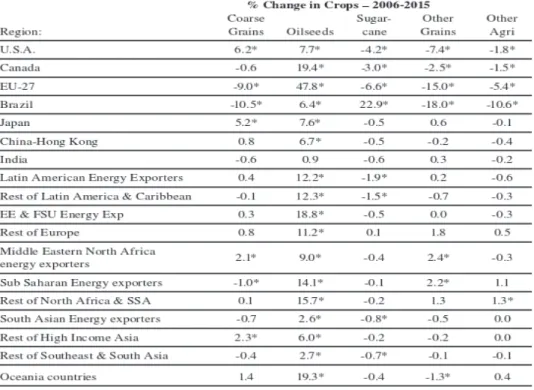
From Table 2, it is possible to observe that US oilseeds amount of land is up by 7.7% mainly due to the influence of EU policies on the global oilseeds market. This increase is accompanied by the increased acreage devoted to oilseeds in other regions, where the percentage increases range from 6 – 12% in Latin America, and 14% in Africa, to nearly 20% in Canada and 48% in the EU. Sugar-cane area rises by nearly 23% in Brazil, but declines elsewhere, and at the same time acreage dedicated to other grains and crops rises in some regions and declines elsewhere (Hertel et al., 2010).
Table 2. Change in Crop Harvested Area by Region, due to EU and US Biofuel Mandates. Source: Hertel, 2010.
The biofuels policies have a much greater effect than just on the US or just on the EU agricultural policies, in fact crop cover rising sharply in Latin America, Africa and Oceania as a result of the these policies. These increases in crop cover come at the expense of pasture lands as well as forests. Global irrigated area could expand by 23 million ha by 2030 (Bruinsma, 2009).
In sum, a conservative estimate is that 6 million ha/year of additional land will be brought into production through 2030, implying a total land expansion of 120 million ha.
Other projections, instead, foresees a total increment up to 240 million ha over the same period. The fact that land use is in decline in developed and transition economies implies that more area expansion will shift to developing countries.
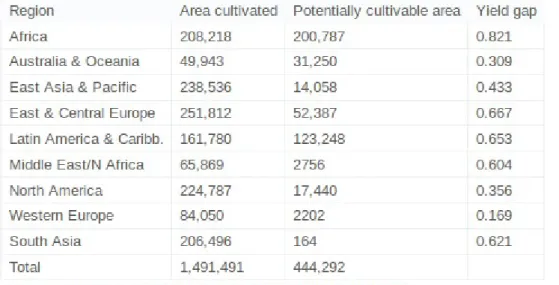
Table 3. Land with Potential for Rainfed Crop Production (Million Ha).
As land that may be used for expansion is not equally distributed, some two-thirds of land expansion in developing countries is likely to be in Latin America and the Caribbean and in Sub-Saharan Africa (Table 3).
1.5 Who is making international deals?
and on 136 countries of which 110 are investor countries, 83 are destination countries, and 57 are both target and investor (De Maria, 2015). According to Anseeuw et al. (2012a) investor countries are more heterogeneous then target countries and can be organized in three main groups (Table 4): I. Emerging countries (i.e. China, Argentina, Brazil and South Africa). These countries are characterized by a huge availability of capital and by a fast growing and highly competitive agro-food sector. Both public and private subjects are involved.
II. Gulf countries (Saudi Arabia, United Arab Emirate and Qatar), whose domestic availability of land suitable for agricultural activities is typically scarce. Both public and private subjects are involved.
III. OECD countries (USA and EU member states). These countries often take advantage of historical relations with targeted countries, especially with former colonies (Figure 8). Private investors and agribusiness firms are the main subject involved in land FDI.
Figure 8. French Investments in Africa (million ha). Source: Land Matrix 2015.
Author's elaboration
Reported land agreements involve four different types of investors – namely, private companies,
state - owned companies, investment funds and
public - private partnerships.
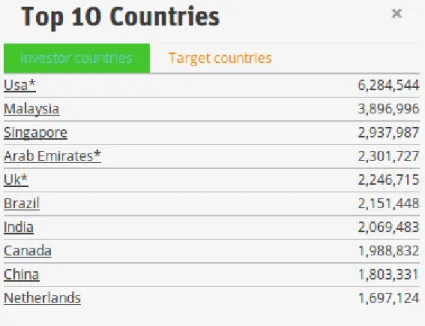
Table 4. The Top 10 Investors for concluded deals. Country names marked with * have been shortened to improve legibility. Source: Land Matrix, 2015.
Agribusiness accounts for the largest share of investors in land acquisitions but governments and sovereign wealth funds are also involved in providing finance and other support to private investors or in some cases directly. Several countries fully depending on food imports, such as the Gulf countries, have substantially increased their investments and in these countries the number of private-public partnerships (with government mainly providing guarantees or tax discounts) has also been increasing in the last few years (Anseeuw et al., 2012a). More generally, as suggested, amongst others, by Sassen (2013), the financializing of commodities has brought new potentials for profit-making to the primary sectors, from food to minerals and metals, thus stimulating speculative investments in land.
European countries have emerged as both investors and target countries. It has been reported that the EU is using about one third of its own arable area outside its own territory as a result of virtual land ‘imports’ , which totalled almost 35 million hectares in 2007/2008 (Von Witzke et al., 2010). In general, most of the deals are agriculture-oriented, but forestry activities and multi-purpose projects also assume an important role (Figure 9).
Large scale land acquisitions exist since colonial times, being driven by a long request for land and other strategic resources. Food production is not the only reason behind land deals. Land is also being bought with the aim to produce biofuels, forestry products and minerals, expanding the range of old and new actors in the global fight for resources (Weis 2010; White et al., 2010).
Thus a better way to start to understand land grabbing is through the lens of political economy. It is important to talk about control of land, and look at who is benefiting. From this perspective, land grabbing becomes essentially a control grabbing (Franco et al., 2013). It refers to the acquisition of power to control land and other associated resources like water, minerals or forests, in order to control the benefits of its use.
Figure 9. Deals divided by intention of investment. Source Land Matrix, 2015.
Note: Data include both domestic and foreign deals. Information on 1,748 deals.
The scope is “to fix or consolidate forms of access to land-based wealth” (McCarthy et al., 2012). It is emerging the necessity of including land grabbing within broader analysis of contemporary global capitalist development (Harvey, 2003), as it is occurring in a fast way during the convergence of multiple crisis: food, energy, climate change and finance capital (White et al.; 2012; Borras et al.;
2012; Quagliarotti, 2013). Land grabbing needs to be seen in the context of the power of national and transnational resources. The global land grab is therefore a manifestation of an ongoing and accelerating change in the meaning and use of the land and its associated resources (like water) from small scale, labour - intensive uses like peasant farming for household consumption and local markets, toward large-scale, capital-intensive, resource-depleting uses such as industrial mono-cultures, raw material extraction, and large-scale hydro-power generation – integrated into a growing infrastructure that link peripheral extractive frontiers to metropolitan areas and foreign markets (White et al.; 2012).
Land deals occur at multiple levels, within and between regions. For example, the South African commercial farmers‘ association (AgriSA) is reported to have acquired 200,000 ha in the Republic of Congo, and to be involved in further negotiations with 22 African governments (Hall, 2011). Large - scale land investments involve a complex global system of interests. Investments may be direct or indirect, international and domestic, productive and speculative, as well as corporate, public and farmer investments. Direct players include companies seeking land to grow food, feed and biofuels (Gillon, 2010, Franco et al., 2010; McMichael et al., 2010), instead indirect players, such as pension fund managers, real estate groups, and finance capital, may seek land as an additional asset in a investment portfolio. Since the financial crisis of 2007 - 08, caused in large part by speculation in a range of financial instruments, there has been concern that international investment in land has become just another element in the portfolios of financial institutions. Evidence suggests that many land deals are not functioning, with only 20% of investments becoming operational (Deininger et al., 2011). Speculation might be one of the reasons for that. It is, however, difficult to say how much international investment in land can be classified as speculative or not. In any case, some deals that were announced have been delayed or abandoned (Smaller and Mann, 2009).
Governments often require that investors demonstrate a business plan, and evidence of developing intent in order to have the land granted, otherwise the government is able to take the land back. However, there is often little capacity by host governments to monitor conformity to the agreed business plan. At the same time, several governments (such as Tanzania, Ethiopia, Mozambique, Cambodia) have made proactive efforts to identify available land that can be allocated to investors. In fact, most governments have set up investment promotion agencies to provide the doorway for those seeking to acquire land. In the case of Cambodia, for example, the government has established Economic Land Concessions for investors, in all totalling close to 2 million hectares between 1998-2010. Many of these concessions are for plantations of eucalyptus, sugar cane, palm oil and rubber, the majority held by domestic investors often linked to foreign capital. In some countries, domestic investors may be even more significant than foreign ones. There is an increasing concern regarding domestic land acquisitions, for instance O‘Brien (2011) documents the problems of land acquisitions by Kenyan elites and the lack of political will to solve them. These domestic elites have direct and indirect linkages to foreign capital, as in the case of Kampong Speu and Pursat large land deals in Cambodia (with Thai and Chinese capital, respectively), and the San Miguel Corporation land deal in the Philippines (with Malaysian capital). Equally, where there are legal constraints on land acquisition by foreigners, domestic players may be sought as partners in order to overcome these constraints. Such domestic land acquisitions, together with foreign investments on land, are deepening an historical problem related to land distribution. The Gini Land Coefficient of countries like Brazil, 0.86 (Sauer et al., 2011), and Ecuador, 0.80 (Valle, 2010), among so many others, clearly shows such historical process of land concentration, that conducted to displacement. Additional dispossession and displacement can be caused by large - scale land investments, that will worsen already problematic land distribution conditions in many countries, and are likely to provoke further conflict and violence.
1.6 Where international deals are happening?
Data reveals a tendency in investment concentration in low-income countries, with a high incidence of hunger and weak land institutions (FAO, 2012).
According to World Bank Report (2011), globally the non-cultivated area suitable for rain-fed cultivation of at least one of the crops between wheat, sugar cane, oil palm, maize and soy bean amounts to about 445 million ha (Fischer et al., 2010). The largest total area available for rain-fed cultivation is in Africa, followed by Latin America. The concentration of currently uncultivated but potentially suitable land for rain-fed cultivation illustrates that availability of such land in the rest of the world (namely, Eastern Europe, East and South Asia, Middle East and North Africa, and all other countries together) is less than what is available in Latin America and the Caribbean alone. Even within regions, land not currently cultivated but potentially suitable for rain-fed cultivation is concentrated in a few countries.
Using the 25 persons/km2 cut-off, the seven countries with the largest amount of land available
(Sudan, Brazil, Australia, the Russian Federation, Argentina, Mozambique, and Democratic Republic of Congo, in that order) account approximately for 200 million ha. The 32 countries, with more than 3 million ha of land each, account for more than 90 percent of available land. Of these, 16 are in Sub-Saharan Africa (SSA), 8 in Latin America and the Caribbean, 3 in Eastern Europe and Central Asia, and 5 in the rest of the world. Many of the countries with ample land available have only limited amounts of land under cultivation.
Thus, the set of destination countries appears homogeneous, at least in terms of GDP per capita and land endowment. Indeed, most of the reported deals occurred in Sub-Saharan Africa (SSA), namely in low-income and land-abundant countries (Deininger, 2011; Schoneveld, 2011; Anseeuw et al., 2012b; Cotula, 2012; Antonelli et al., 2015). However, Latin America, South-Eastern Asia and to a
lesser extent Eastern Europe are also attracting both international and domestic investors (Visser et al., 2010; Kenney-Lazar, 2012; Visser et al., 2012; Baka, 2013; Borras et al., 2013). In sum, SSA is the main target area of large land investments and represent more than forty-five per cent of the total number of deals (Map 1). The focus of my analysis is, therefore, about land acquisitions in Africa, Foreign and Domestic Investments in these areas are likely to have important consequences in terms of food security and agricultural policies (Aabø et al., 2012). Other areas as South America and South and South East Asian countries -as India, Cambodia and Laos - record together more than fifty per cent of the total number of deals worldwide while Eastern Europe- mainly Ukraine and Russian Federation- and Oceania represent marginal areas in this global phenomenon (Land Matrix, accessed February 2015). Table 5 shows how the phenomenon of large land acquisitions can be considered a key issue for large part of the Developing World.
Table 5. Top 10 Target Countries, Land Matrix, 2015.
Country names marked with * have been shortened to improve legibility.
Indonesia 5,824,398 ha Sudan 4,858,100 ha South Sudan 4,4362,573 ha Philippines 4,315,650 ha Papua New* 3,723,375 ha Madagascar 3,318,058 ha Mozambique 3,155,259 ha DRC* 2,894,221 ha Congo 2,218,000 ha Brazil 1,980,190 ha
Figures 10 a and b show investors by target country in Africa and the average size of contracts by investor country. Acquisitions, especially foreign investments from some countries, often appear as bulk land acquisitions. Only a small minority of the total area acquired has a local operator, this
findings highlights the critical role of international capital in driving large-scale farmland investments, and the traditional investors from industrialized countries are still the dominant farmland investors. Food crops feature predominantly in the investments by Saudi Arabia, oil palm has an important role for investors from Singapore and Malaysia. Food crops and wood and fibre account respectively for 25 and 56 per cent of the land acquired by USA, the latter as a result of very few large investments in forestry. Similarly carbon sequestration ranks very high for investments by Singapore as a result of a single investment and tourism is 83 per cent of area acquired by UAE investors as a result of a single investment (Schoneveld, 2014). In sum, investments in Africa are influenced by EU policy for biofuels, the essential commercial orientation of Asian investors (e.g., oil palm), the state led model of FDI flows from Gulf countries, which leads to very large size investments, the emerging role of South Africa as a dynamic agricultural investors in the continent.
Figure 10a. Investors in Africa2. Author's elaboration based on 466 contract (million ha) listed in Land Matrix database (accessed February 2015).
Figure 10b. Average Deal Size for Investors in Africa. Author's elaboration based on 466 contract (million ha) listed in Land Matrix database (accessed February 2015).
The investors’ choices are partly influenced by the behaviour of hosting countries, which attempt to attract investments through a series of pro-active policies from the leasing for free of natural resources to the opening of local or regional markets in order to make their land profitability more convenient for international and domestic investors. This is, for instance, the case of Ethiopia, where, even if the control of the land property remains under the central and political authorities despite the continuous pressure of international organizations to privatize, local authorities start to lease large portions of land to international investors becoming, in this way, one of the favourite target of the land acquisition process worldwide (Rahmato, 2014). The Ethiopian case, even if with many differences, can easily be translated to other African countries and developing countries. Another important issue to be considered especially for the rural areas is the increasing prices for agricultural products and their consequences in the number of poor people in several countries causing the re-emergence of the phenomenon of hunger (Figure 7) and wide poverty in certain
regions. Compared to other areas, SSA is the poorest sub-continent. Moreover, many African countries faced two important social phenomena: demographic transaction and urbanization. Large part of the sub-continent recorded a rising population, in fact they show typical data of transaction in population growth- reducing fertility and mortality rates (UNICEF, 2014).
Map 1. Large Scale Land Acquisitions in Africa. Author's elaboration.
in some areas as the education, health and social policies. Some of the millennium development goals (MDGs) -have been reached while some other important as poverty indices is not completely achieved in several countries and at continental level. According to the international datasets, African countries increased their GDP till the explosion of the international crisis in 2007-2008. The bulk of African countries are still characterized by large part of the population under the poverty line, in fact these countries remain under the category of least developed countries in the international classifications.
Economic and social conditions in the African target countries are different in terms of general profile compared to other target countries. Sub Saharan African countries are the poorest while Asians and Latin American countries interested in this process are growing, even if relevant exceptions exist.
Cotula et al. (2009) report that the maximum size of approved project in the period 2004-2009 in terms of largest land allocation happened in seven African countries: Ethiopia, Congo, DR Congo, Liberia, Mozambique, Sierra Leone, South Sudan (Figure 11).
Figure 11. Contract Size for Each African Target Country (million ha). Author's elaboration based on Land Matrix (accessed February 2015).
South America is considered an attractive target for investors because of its productive climate and soils, but the value of land has started rising, and the number of deals is less than half those of Africa. In targeted countries, in general, there are many buyers, but each specific area/country seems to be a dedicated target for an investor (e.g. India tends to invest in land in Ethiopia; Saudi Arabia and the Gulf countries in Muslim countries, in particular in Sudan and South Sudan (Figure 12 a and b). Land deals occurred within and between regions, with a strong tendency to intra regional flows in Asia and South America (FAO, 2012) and South-South deals becoming common. China for instance, is a key investor in South Asia and South America (Cotula et al., 2012) and a large one in some countries in SSA. Case studies of projects in 7 countries suggest that widespread concern about large-scale farming being associated with potentially large risks is justified. Key risks include:
weak land governance and an associated failure to recognize and protect local communities' land rights (Alden-Wily, 2010),
lack of capacity to process and manage large-scale investments, including inclusive and participatory consultations that result in clear and enforceable agreements (Deininger et al., 2011),
investor proposals that were non-viable technically, or inconsistent with local visions and national plans for development, in some cases leading investors to usurp local lands and resources, as consequence there will be possible conflict with negative distributional and gender effects (Tamrat, 2010; World Bank, 2010).
Figure 12a. India Land Investments in Africa. Number of Deals. Author's elaboration 14 2 4 2 5 India Land Investments
Ethiopia - Food crops -Non-food agricultural commodities- Biofuels
Ghana - Biofuels, Food crops, Non-food agricultural commod-ities, Renewable Energy Mozambique - Food crops Sierra Leone – Agriunspecified United Republic of Tanzania -
Agriunspecified – Food crops - Non-food agricultural commod-ities – Biofuels
Figure 12b. Gulf Countries Land Investments in Africa. Number of Deals. Author's elaboration
4 3 1 1 3 1 1 1 2 5 Gulf Countries Land Investments
Egypt - Food crops- Non-food
agricultural commodities Ethiopia - Food crops – Non-food agricultural commodities – Livestock
Mali - Food crops Mauritania - Food crops Morocco - Food crops –
Livestock Ghana - For wood and fibre Sierra Leone - For wood and
fibre South Africa - Food crops
South Sudan - Conservation,
Tourism Sudan - Conservation, Tourism
At the same time, by comparing over time, case studies document that well-executed investments can provide benefits. These occur through four main channels:
social infrastructure, often supported by community development funds using land compensation,
employment and jobs,
access to markets and technology for local producers, local or national revenue.
However, even if overall effects are positive, distributional issues may arise and will need to be addressed upfront to inform negotiation and contract design. For example, skilled people could gain from jobs creation through an investment while vulnerable groups or women lost access to livelihood without being compensated (Deininger et al., 2011). In any case, it is quite difficult to perform a good assessment, because reliable data and transparent information about the scope and status of land acquisitions remain elusive.
1.7 Conclusion.
Juergen Voegele, director of the Agricultural and Rural Development Department of the World Bank argues this saying: “When done right, larger-scale farming can provide opportunities for poor countries with large agricultural sectors and ample endowments of land. To make the most of these opportunities, however, countries will need to better secure local land rights and improve land governance. Adopting an open and proactive approach to dealing with investors is also needed to ensure that investment contributes to broader development objectives” (World Bank, 2011). Developing countries have generally welcomed foreign or local investments in agriculture as a path to macro-economic development through employment generation, increased exports and economic and technological spillovers to rural areas (Honing, 2012; Schoneveld, 2011). The assumption is that the ongoing rural crisis of persistent chronic poverty and wide-spread hunger is at base a crisis of lack of investment. Therefore the current upswing of big-investor interest in land is portrayed as
a must-seize opportunity. Moreover, many supporters have said that the investment will need to be large-scale and corporate controlled in order to be capable of achieving higher international competitive abilities in the increasingly integrated value chains of global agricultural production (White et. al., 2012). While attracting investment is an important priority for land-abundant countries, caution is warranted to prevent speculative investments or arrangements in which local land rights are lost or landholders are excluded from the benefits of the investment. Large scale land acquisitions during commodities boom were detrimental to social and economic development, as evidenced in Central America during the coffee boom of the late 19th century when privatization of
previously customary conducted to rapid land concentration. In countries such as Guatemala and El Salvador, the coffee boom led to the expropriation of land on a massive scale, followed by decades of conflict and civil war that undermined economic, human, and social development. By contrast, in Costa Rica and Colombia, increasing coffee prices fostered the emergence of vibrant smallholder coffee economies. Although the four countries started in very similar conditions, the latter now enjoy a per capita income double that of the former, rank much higher on the human development index, and have been democracies for more than 50 years rather than little more than a decade (Songwe et al., 2009). The reality of world food provision and agricultural investment, however is that the bulk of investment in agriculture is undertaken by farmers themselves, with smallholder farmers producing most of the food consumed locally in many developing regions (Committee on World Food Security, 2011). In Zimbabwe for example, small-scale farmers are using their own savings to invest in farm buildings, farm equipment, cattle and transport. In Latin America, the agro - ecology movement is sharing the benefits of this low-external input agriculture through a farmer-to-farmer process of knowledge exchange and innovation. In the EU and US, food re-localisation strategies connect producers, retailers, and consumers in the exchange of healthy, nutritious, locally sourced food, outside the reach of transnational supermarket chains. These are just a few examples
of positive investment alternatives to the large-scale, capital intensive, corporate controlled agricultural model, which presents itself as the only solution to world hunger and rural poverty. The agriculture sector continues to play a crucial role for development, especially in low-income countries where the sector is large both in terms of aggregate income and total labour force (Dethier et al., 2012). Strategic plans for poverty reduction have been prepared since 1998 by at the least 15 African governments with support from World Bank. However, most of them provide only scant attention to the role of land access and land distribution in rural poverty (Jayne et al., 2003). Growth alone is not sufficient for poverty reduction; the distribution of assets makes a difference. The egalitarian land distribution patterns have tended to generate higher rates of economic growth than highly concentrated ones (Mellor, 1976; Quan et al., 1985; Deininger et al., 1998). The basic reason for this is that broad-based agricultural growth tends to generate second-round expenditures in support of local non - tradable goods and services in rural areas and towns. These multiplier effects tend to be much weaker when the source of agricultural growth is concentrated in relatively few hands. Therefore this concentration of investments in low-income countries, with a high levels of hunger and weak land institutions (FAO, 2012), could lead to the risk of weak governance of investments and consequent negative environmental and socio – economic effects. Water and land have thus become global resources, contented at global level (Antonelli et al., 2015).
References.
Benson T., Minot N., Pender J., Robles M., and von Braun J. (2008), Global Food Crises: Monitoring and Assessing Impact to Inform Policy Responses, International Food Policy Research Institute (IFPRI), Washington, DC. Available online at: www.ifpri.org/publication/global-food-crises-0
Dawe D., Morales-Opazo M., (2009). How much did developing country domestic staple food prices increase during the world food crisis? How much have they declined? ESA Working Paper No. 09-09. FAO, Working Paper 2009.
Dethier, J.-J., Effenberger, A., Agriculture and development: A brief review of the literature. Econ. Syst. (2012), doi: 10.1016/j.ecosys.2011.09.003
Maros I. and Martin W. (2008), “Implications of Higher Global Food Prices for Poverty in Low-Income Countries”, Policy Research Working Paper, Report No. WPS 4594, The World Bank, Washington, DC.
Aabø E., Kring T., (2012) “The Political Economy of Large-Scale Agricultural Land Acquisitions: Implications for Food Security and Livelihoods/Employment Creation in Rural Mozambique”, UNDP, WP 2012-004, Maputo, Mozambique.
Alden-Wily L., (2010). Whose land are you giving away, Mr. President?. Washington DC: Paper presented at the Annual Bank Conference on Land Policy and Administration, April 26 and 27, 2010.
Anseeuw, W., Alden Wily L., Cotula L., and Taylor M., (2012a): Land Rights and the Rush for Land: Findings of the Global Commercial Pressures on Land Research Project. ILC, Rome: Italy.
Anseeuw, W., Boche, M., Breu, T., Giger, M., Lay, J., Messerli, P., & K., Nolte (2012b): Transnational Land Deals for Agriculture in the Global South. Analytical Report based on
the Land Matrix Database. CDE/CIRAD/GIGA, Bern/Montpellier/Hamburg.
Antonelli M., Siciliano G., Turvani M. E., Rulli C. M., (2015). Global investments in agricultural land and the role of the EU: Drivers, scope and potential impacts. Land Use Policy. Elsevier Ltd.
Baka, J. (2013): The political construction of wasteland: governmentality, land acquisition and social inequality in South India. Development and Change, 44(2), pp. 409-428.
Bates B.C., Kundzewicz Z.W., Wu S., and Palutikof J.P. [eds] (2008), “Climate Change and Water”, Technical Paper of the Intergovernmental Panel on Climate Change, IPCC Secretariat, Geneva.
Binswanger, H. P., Deininger, K., & Feder, G., (1995). Power, distortions, revolt and reform in agricultural land relations. Handbook of Development Economics, 3B, 2659–2772.
BNDES - Banco Nacional de Desevolvimento Economico e Social, (2008). Sugarcane-based Bioethanol Energy for Sustainable Development. Rio de Janeiro: BNDES.
Borras M. Saturnino Jr, Kay Cristobal, Gomez Sergio, Wilkinson John (2012), Land Grabbing and global Capitalist accumulation: key features in Latin America. Canadian Journal of Development Studies, 33:4, 402-416.
Borras, S., Kay, C., Gómez, S., & Wilkinson, J., (2013): Land grabbing and global capitalist accumulation: key features in Latin America. Canadian Journal of Development Studies/Revue canadienne d'études du développement, 33(4), pp. 402-416.
Bruinsma J. (2009), The Resource Outlook to 2050: By How Much do Land, Water and Crop Yields Need to Increase by 2050? Prepared for the FAO Expert Meeting on “How to Feed the World in 2050”, 24 – 26 June 2009, Rome.