UNIVERSITY OF SASSARI Ph.D. School in Agricultural Science DEPARTMENT OF AGRICULTURE
UNIVERSITY OF SASSARI
PRODUCTIVITY OF CULTIVATED CROPS
XXXI cycle
DIFFERENT VINEYARD MANAGEMENT PRACTICES: AGRONOMIC
RESPONSES AND CONSEQUENCES ON MUST QUALITY
Dr. Massimiliano Cocco
Ph.D. School Coordinator Prof. Ignazio Floris Curriculum Coordinator Prof. Rosella Motzo Main Professor Dr. Luca Mercenaro
UNIVERSITY OF SASSARI Ph.D. School in Agricultural Science DEPARTMENT OF AGRICULTURE
UNIVERSITY OF SASSARI
PRODUCTIVITY OF CULTIVATED CROPS
XXXI cycle
DIFFERENT VINEYARD MANAGEMENT PRACTICES: AGRONOMIC
RESPONSES AND CONSEQUENCES ON MUST QUALITYDr. Massimiliano Cocco
Ph.D. School Coordinator Prof. Ignazio Floris Curriculum Coordinator Prof. Rosella Motzo Main Professor Dr. Luca Mercenaro
This thesis is presented as a compilation of two chapters. Each chapter is introduced separately.
Chapter 1 Vine water status and exogenous abscisic acid affect physiological characteristics and must composition in cultivars Grenache, Merlot and Sangiovese grown in a Mediterranean environment climate.
Abstract 3
1. Introduction 5
2. Materials and methods 8
2.1. Experimental design 8
2.2. Leaf area and pruning weight 10
2.3. Yield, yield components and grape composition 10
2.4. Skin thickness 11
2.5. Physiological measurements 11
2.6. Statistical analysis 12
3. Results 13
3.1. Meteorological conditions 13
3.2. Vine water status, vegetative growth and yield 15
3.3. Grape berry composition in response to water deficit and abscisic acid application
28
3.3.1.Cultivar Merlot 28
3.3.2.Cultivar Sangiovese. 32
3.3.3.Cultivar Grenache 36
3.4.Skin thickness in response to water deficit and ABA application 40
4. Discussion 43
5. Conclusions 51
6.References 53
Chapter 2 Post-veraison leaf removal to delay ripening: effect on vine physiology, yield components and berry and wine composition of Shiraz and Semillon in South Australia
Abstract 62
1. Introduction 64
2. Materials and methods 67
2.1. Experimental design 67
2.2.Canopy architecture 69
2.3. Yield, yield components and grape composition 70
2.4. Physiological measurements 70
2.5. Winemaking 71
2.6. Wine chemical analysis 72
2.7. Statistical analysis 72
3. Results 73
3.1.Growing season temperature 73
3.2.Cultivar Shiraz 76
3.2.1. Yield, yield components and wine composition 76
3.2.2. Canopy architecture and physiological measures 79
3.3. Cultivar Semillon 80
3.3.1. Yield, yield components and wine composition 80
3.3.2. Canopy architecture and physiological measures 84
4. Discussion 85
5. Conclusions 91
CHAPTER 1
Vine water status and exogenous abscisic acid affects physiological
characteristics and must composition in cultivars Grenache, Merlot
and Sangiovese grown in a Mediterranean environment climate.
ABSTRACT
Background and Aims
Beyond climatic conditions, qualitative performance is led by the intrinsic characteristics of the genotype. Water deficit is known to influence berry development and up-regulation genes as a common strategy to improve fruit composition. It was also observed that exogenous abscisic acid (ABA) can improve must composition promoting the anthocyanin synthesis, and offering a way for colour improvement. The aim of this study was to investigate, on cultivars Grenache, Merlot and Sangiovese, the relation of vine water status and exogenous ABA application on must composition in Mediterranean environmental conditions.
Materials and Methods
The experiment consisted in comparing two levels of irrigation treatments, Full Irrigation (FI), keeping the vines in well-watered conditions versus a No Irrigation treatment (NI). The full irrigation treatment was applied early at the pea-sized berry stage (BBCH 74) and kept during two growing seasons, 2016 and 2017. For each irrigation treatment, two sub-treatments were set up: i) 4 ml L-1 of exogenous ABA applied at veraison (50% berry change) to clusters only and subsequently repeated after six days; ii) a control (untreated vines).
Results
The application of a different regime of water confirmed that the response to water stress is closely cultivar-dependent. Berry composition was differently influenced by water stress among cultivars. In terms of metabolites, positive influences were observed in cv. Grenache, whereas in terms of yield, negative effects were observed in cvs. Merlot and Sangiovese. No significant effect was observed by spraying exogenous ABA directly on grapes. Moreover, no significant interactions have been found between the application of water stress and exogenous ABA in any tested cultivar.
Significance of study
This study confirms that the propensity of water stress to improve must quality is influenced by the genotype. Furthermore, exogenous ABA application does not appear to be a viticultural practice able to influence must composition in environments characterized by severe environmental conditions such as heat and drought.
1. INTRODUCTION
Grape quality might be described as the result of the balanced accumulation of primary and secondary compounds (Chaves, 2015) influenced by complex interactions between different factors (Jackson and Lombard, 1993). In this context, water-plant interaction has been an area of specific attention in recent years (Chaves et al., 2010; Medrano et al., 2015).
It is generally accepted that moderate water stress positively influences wine composition mainly due to the increasing skin/pulp ratio (Roby et al., 2004), and the biosynthesis of secondary metabolites (Savoi et al., 2016). Although the berry size varies between cultivars, it is well known that, within a cultivar, water deficit favours smaller berries (Hardie and Considine, 1976). A reduction of berry size determines a so-called “concentration” effect particularly clear for total soluble solids (Herrera et al., 2017) and other compounds in grape berries (Castellarin et al., 2007; Acevedo-Opazo et al., 2010).
Although primary and secondary metabolites are positively affected in each genotype by water stress (Chaves, 2015), berry composition is determined by the interplay between soil water availability, atmospheric condition (Herrera et al., 2017), and genetics factors (Merli et al., 2016). In fact, in Mediterranean environments where it is not traditionally practiced, the irrigation is increasingly being used to allow the berries to ripen properly. However, in order to correctly apply the irrigation management practice to obtain a good grape quality, it is necessary to understand the vine phenological stage in which water stress is applied (Castellarin et al., 2007; Intrigliolo et al., 2010), the level of stress severity to be applied (Ojeda et al., 2002; Girona et al., 2006), the crop yield (Intrigliolo et al., 2010), as well as the vine genetic
background (Niculcea et al., 2014; Rossdeutsch et al., 2016), because, as stated by Chaves et al. (2015) Vitis genotypes are the main factor influencing the berry composition.
Grapevine cultivars have been described as isohydric or anisohydric depending on their response to soil water stress (Schultz, 2003). Isohydric cultivars are characterized by keeping their leaf water potential above a certain threshold regardless of the soil water availability and/or the atmospheric water demand. In contrast, cultivars behave as anisohydric when their leaf water potential drops in response to decreasing soil water availability or increasing atmospheric water demand (Lovisolo et al., 2010).
It is important to underline that the same varieties have showed, in some cases, contrasting behaviours, probably due to different field experiment conditions (Chaves et al., 2010). Although Tombesi et al. (2016) suggested to represent the grapevine varieties
as a continuum of genotypes with different levels of anisohydry, Dal Santo et al. (2016) found original evidence of a molecular basis for the proposed classification of isohydric and anisohydric cultivars.
It is well known that, when the plant perceives water shortage in the soil, both hydraulic and chemical signals are thought to be involved in the plant response (Lovisolo et al., 2010). However, although several studies have investigated the prominent role played by the abscisic acid (ABA) in the modulation of stomatal closure (Zhang et al., 1989), additional hormones and secondary metabolites appeared to be involved in this physiological process (Soar et al., 2006). Furthermore, stomatal closure could be induced by hydraulic signals and maintained by ABA in drought-stressed grapevines although both hydraulic and chemical signals coexist (Tombesi et al., 2015).
The study of such mechanisms is hindered by difficulties since growth regulators like ABA are involved in different processes (Soar et al., 2006). In fact, ABA is implicated in the control of grape berry ripening with an increase in ABA levels at veraison (Wheeler et al., 2009; Niculcea et al., 2014). Evidence that exogenous ABA application can enhance sugar (Hale and Coombe, 1974; Wheeler et al., 2009) and anthocyanins in grape berry is strong (Jeong et al., 2004; Mori et al., 2005; Peppi et al., 2006; Wheeler, 2009; Koyama et al., 2010). In berries of Vitis vinifera L., the onset of ripening (veraison) was found to be related to sugar accumulation and was complemented by a marked increase in ABA concentration (Gambetta et al., 2010). However, recent studies showed that an increase in ABA represents, in terms of time, the earliest event during the onset of ripening, followed by further increases in abscisic acid, and the accumulation of sugar, which are all integral for colour development (Castellarin et al., 2016). Even though ABA concentration increases at veraison and then subsequently declines to a low level (Wheeler et al., 2009), both pre-and post-veraison water deficit alter the ABA accumulation patterns, influencing the level of sugar and phenolic substances (Niculcea et al., 2014).
Water deficit and exogenous ABA significantly affect grape and wine phenolic compounds. Grape berry composition changes on the basis of the irrigation scheduling and exogenous ABA applications (Deis et al., 2011; Quiroga et al., 2012; Fernandes de Oliveira and Nieddu, 2013). Moreover, ABA supply increases catechin and malvidin synthesis in both well-irrigated and moderately water-stressed vines, whereas resveratrol was enhanced only in water-stress conditions (Deis et al., 2011). Even though grapevine is well-adapted to semi-arid climate environments (Chaves et al., 2010), post-veraison water deficit is in general a common strategy utilized to improve
fruit composition in many wine-growing regions. Nowadays, water stress could be particularly severe in some areas of the planet due to climate change, and especially when associated with dry winter and spring (Costa et al., 2016), with the consequence that negative repercussions could occur affecting grape and wine quality.
In order to target the desired berry traits, the understanding of the interactions between different cultivars and environmental aspects related to water deficit represents an important issue for managing irrigation scheduling in a proper way. For these reasons, the aim of the present study was to evaluate the effect of water stress and the application of abscisic acid on the accumulation of primary and secondary metabolites in berries growing in a Mediterranean area, periodically subjected to severe water deficit during the post veraison period.
2. MATERIALS AND METHODS 2.1. Experimental design
A field experiment was carried out in 2016 and 2017 in an experimental vineyard sited in Santa Maria la Palma – Alghero, Sardinia, Italy (40°39’20.31’’N; 8°16’0.26’’E; 28 meters above sea level). The site has a relatively uniform calcareous alluvial soil, with an average depth of 60– 70 cm, and the following physico-chemical characteristics: sand 51.0%, clay 24.9%, silt 24.1%; pH = 7.44; organic matter content = 16 g kg-1. The area is characterized by a typical central Mediterranean climate, with mild winters and hot, dry summers, with precipitations concentrated between October and May. Daily temperature, relative humidity and rainfall were recorded during the survey by a weather station near the vineyard. Measurements were carried out on cvs. Grenache, Sangiovese and Merlot, planted in 2007 and grafted onto 1103 Paulsen rootstock, drip-irrigated (2.0 L h-1), and trained on a lateral spur pruned cordon with the shoots
vertically positioned and a canopy height of about 1.70 m. The vines were manually pruned during the winter. The soil was managed by mowing natural herbage during the winter-spring period and through mechanical weed control in summer time. All the cultivars investigated were chosen according to the current classification: Merlot and Sangiovese with anisohydric behaviour (Chaves at al., 2010; Dal Santo et al., 2016), and Grenache with isohydric behaviour (Soar et al., 2006). The plant distance was 0.8 m within rows and 2.5 m between rows, which were oriented north-south.
Two irrigation levels were applied during the season:
1) irrigated vines (defined as FI, Full Irrigation): vines were weekly irrigated in order to keep their stem water potential above -0.6 MPa, established as a threshold for no-water stress conditions (van Leeuwen et al., 2009). Irrigation treatment started at the pea-sized berry stage (BBCH 74) (Lorenz et al., 1995);
2) stressed vines (defined as NI, No Irrigation): vines were not irrigated unless they displayed the values of stem water potential of -1.4 MPa, in order to avoid excessive stress (van Leeuwen et al., 2009).
Furthermore, two sub-treatments were set up, depending on the application of exogenous ABA during the season:
1) exogenous ABA (defined as A, Abscisic acid) supplied at veraison (50% color berry change, BBCH83);
2) no exogenous ABA supplied (defined as C, Control).
The experiment was thus conducted with a fully randomized block design with three replicates of nine vines for a total of four treatments:
a) FIA: full irrigation (FI) with ABA supply (A); b) FIC: full irrigation (FI) without ABA supply (C);
c) NIA: no irrigation (NI) with ABA supply (A);
d) NIC: no irrigation (NI) without ABA supply (C).
Commercial ABA (ProTone SL) containing S-abscisic acid at 10% concentration, and supplied by Valent BioScience Corporation®, was sprayed at the recommended label rate of 4 mL L-1 on clusters at BBCH 83. The application was repeat six days later (Ferrara et al., 2014) using a simple shoulder pump. ProTone SL was applied in the early evening.
Vine water status was evaluated with the pressure chamber technique (Scholander et al., 1965). Physiological measurements (stem water potential and stomatal conductance) were derived from the average of data recorded in the vines subjected to both irrigation and ABA treatments, so that FI = FIA + FIC and NI = NIA + NIC. Irrigation was supplied in the early evening by a drip system with drippers positioned at 40 cm over the soil, spaced 40 cm apart, each able to provide a flow rate of 2.0 L h-1. 2.2. Leaf area and pruning weight
Leaf surface was determined at BBCH 88 using a planimeter (LI-3100C Area Meter). Two randomly-selected shoots were excised from two vines in both irrigation treatments (FI and NI) and the number of main leaves, secondary shoots and leaves of secondary shoots was measured and recorded. Total Leaf Area (TLA) was determined as the sum of Main Leaf Area (MLA) and Secondary Leaf Area (SLA). During winter, Pruning Weight (PW) was determined on six vines per each treatment.
2.3. Yield, yield components and grape composition
Starting from veraison (BBCH 81), every 20 days and for a total of four sampling dates, 300 berries were randomly taken for each treatment and replicate in order to measure Total Soluble Solids (TSS, °Brix), Titratable Acidity (TA, g tartaric acid L-1),
pH, total phenolics (mg L-1) and total anthocyanins (mg L-1). Due a to faster ripening process occurring in season 2017, the last two samplings were performed every 15 days. Total soluble solids were determined by handheld refractometer, pH by pHmeter, and TA by titration. Total phenols and anthocyanins were determined, after peeling the frozen berries, using the methodology proposed by Di Stefano and Cravero (1991).
At harvest, the number of clusters and their weights were recorded from six representative vines for each treatment.
2.4. Skin thickness
Skin thickness was determined using a Texture Analyzer (TA.XT plus, Manson UK). Among the berry samples collected to determine grape yield components, ten berries per treatment were randomly selected for skin thickness analysis. Five mm2 of skin were cut from each berry by scalpel, cleaned from the pulp and then analyzed. 2.5. Physiological measurements
For each cultivar and sampling date, two fully mature and sun-exposed leaves were selected from two vines for each replicate in both FI (FIA + FIC) and NI (NIA + NIC) treatments in order to measure the Stem Water Potential (Ψstem). These leaves were usually selected in the median part of the shoot. Stem water potential was monitored every 10 days during the season starting from Day Of the Year (DOY) 180 and 170 in 2016 and 2017, respectively, using a Pump Up pressure chamber (PMS Instruments CO., USA). Leaves were covered with aluminium foil and coated with a plastic bag for one hour before each measurement taken at solar noon.
Starting from BBCH 79 only during the season 2017, stomatal conductance (gs) on both FI and NI treatments was monitored using a portable photosynthesis system (Ciras-2, PP system, UK). Six mature and fully expanded primary leaves were chosen
for each treatment (FI and NI) and replicate. Before recording the measurements, leaves were kept in the leaf chamber for at least three minutes in order to obtain a stable photosynthetic state. The measurement, taken at midday, was recorded every 20 days in four different sampling dates. All the measurements were carried out within one hour. 2.6. Statistical analysis
Statistical data analysis was performed using SPSS software v. 16 for analysis of variance (ANOVA). Least significant difference (LSD) test was applied for mean separation. Different letters in tables and figures represent significant differences for P-value < 0.05, whereas the symbol ns indicates no significant difference among treatments.
3. RESULTS
3.1. Meteorological conditions
The meteorological trend was different over the two experimental years (Table 1). The former year was characterized by high rainfall and humidity from January to late spring, while 2017 was one of the hottest and driest years of the last 30 years in the Mediterranean area. During the season, T max reached 42.2 °C (Figure 2) between late July and early August. The mean daily temperature was about 1°C (Table 1) higher in 2017 than in 2016 (Figure 1). A higher value of evapotranspiration (ET0) was observed considering the July-August period as well as the entire year. The lower rainfall observed in 2017, associated with a higher evapotranspiration demand due to higher temperatures, highlight the severe conditions reached during the entire growing season. Meteorological data of temperature and rainfall 2016-2017 from the closest weather station (Olmedo, Sassari) gathered by “Arpas- Dipartimento Meteoclimatico Sardegna” while average data of 1980-2015 from weather station (Ottava, Sassari) of University of Sassari-Department of Agriculture.
Table 1. Main climatic factors recorded during 2016, 2017 and thirty-year period 1980-2010 in Sassari (Sardinia, Italy). Parameter Year 2016 2017 1980-2010 Total rainfall (mm) 497.6 369.4 485.5 Rainfall January-March (mm) 201.4 111.6 141.0 Rainfall April-June (mm) 41.0 48.3 117.7 Rainfall July-August (mm) 37.0 0.4 16.9
Mean of daily min. temp. Jan-Feb (°C) 7.4 6.9 5.0
Mean of daily max. temp. Apr-May (°C) 20.5 21.9 20,9
Mean of daily med. temp. July-Aug (°C) 23.1 26.2 24.3
Mean of daily max. temp. July-Aug (°C) 28.8 32.9 30.7
ETO year (mm) 1000.9 1196.2 Not available
ETO June-Aug (mm)
Figure1. Daily dynamic of maximum and minimum air temperature and rainfall during the growing
season 2016
Figure2. Daily dynamic of maximum and minimum air temperature and rainfall during the growing
season 2017 0 10 20 30 40 50 60 70 80 90 100 0 5 10 15 20 25 30 35 40 45 01/04/2016 01/05/2016 01/06/2016 01/07/2016 01/08/2016 01/09/2016 mm T em pe ra tu re (° C) Maximun Temperature Minimun Temperature Rainfall 0 10 20 30 40 50 60 70 80 90 100 0 5 10 15 20 25 30 35 40 45 01/04/2017 01/05/2017 01/06/2017 01/07/2017 01/08/2017 01/09/2017 mm T em pe ra tu re (° C) Maximun Temperature Minimun Temperature Rainfall
3.2. Vine water status, vegetative growth and yield
In the first and second year of the trial (2016 and 2017), stem water potential was measured 11 and 12 times respectively (Figure 3). In correspondence with the natural reduction of water resources in the soil, stem water potential values decreased in response to soil water depletion. Statistical differences between FI (FIA+FIC) and NI (NIA+NIC) treatments were observed in all cultivars.
The stem water potentials of -0.6 and -1.4 MPa, used as thresholds for irrigation scheduling, revealed an important difference in cultivar behaviour. In fact, in cvs. Merlot (Figure 3A, D) and Sangiovese (Figure 3B, E), stem water potential in FI vines was often detected below-0.6 MPa. Whereas the average value of stem water potential in cv. Merlot was -0.8 MPa throughout both seasons, the recorded values in cv. Sangiovese were equal to -0.8 and -0.9 MPa in 2016 and 2017, respectively. On the other hand, vines subjected to FI treatment were supplied with 1840 and 1940 m3 ha-1of water in the first and second year, respectively, which turned out to be not sufficient to maintain the stem water potential above the threshold value of -0.6 MPa. In NI vines, stem water potential became progressively negative throughout the season, although cvs. Merlot and Sangiovese reached the threshold of -1.4 MPa in different times.
In 2016 in cv. Merlot, 70 and 20 L vine-1 were supplied on 4 August and 1 September, respectively. On the other hand, the irrigation threshold in cv. Sangiovese was reached later than in cv. Merlot (18 August). However, the amount of water supplied (equal to 16 L vine-1) was not able to restore any value above -1.4 MPa, thus another irrigation (40 L vine-1 dispensed) was necessary.
In season 2017, although the stem water potential trend was similar to the previous season, higher negative values were recorded. Furthermore, cvs. Merlot
(Figure 3D) and Sangiovese (Figure 3E) reached simultaneously the irrigation threshold value of -1.4 MPa. Both cultivars were irrigated on 27 July with 65 L vine-1. Subsequently, on 16 August, Merlot was mistakenly irrigated (42 L vine-1) although the value was higher than -1.4 MPa. In cv. Sangiovese, after the first irrigation in NI treatment, stem water potential showed a slight but constant decrease, reaching once again a value of -1.4 MPa on 1 September. A second irrigation treatment in NI vines was then applied in cv. Sangiovese (30 L vine-1).
The cv. Grenache (Figure 3 C, F) showed less sensitivity to water stress. The stem water potential was less negative compared to that in both cvs. Merlot and Sangiovese, and in neither of the two seasons was it above -1.4 MPa, the threshold that indicates excessive stress in NI treatment. In fact, in the driest year (2017), stem water potential showed an average of -0.7 MPa in FI treatment.
a a a a a a a a a ns ns b b b b b b b b 0 10 20 30 40 50 60 70 80 90 100 -1.6 -1.4 -1.2 -1 -0.8 -0.6 -0.4 -0.2 0 B Sangiovese a a a a a a a ns ns b ns b b b b b b b 0 10 20 30 40 50 60 70 80 90 100 -1.6 -1.4 -1.2 -1 -0.8 -0.6 -0.4 -0.2 0 C a Grenache ns ns a a aa a ns a a b b b b b b b b 0 10 20 30 40 50 60 70 80 90 100 -1.6 -1.4 -1.2 -1 -0.8 -0.6 -0.4 -0.2 0 W S (m m ) Ψ s (M Pa ) WS FI NI a A Merlot ns a a a a a a a a b b b b b b b b 0 10 20 30 40 50 60 70 80 90 100 -1.6 -1.4 -1.2 -1 -0.8 -0.6 -0.4 -0.2 0 E Sangiovese a a a a a a a a a b b b b b b b bb 010 20 30 40 50 60 70 80 90 100 -1.6 -1.4 -1.2 -1 -0.8 -0.6 -0.4 -0.2 0 D Merlot a a a a a a a ns b b b b b b b ns 0 10 20 30 40 50 60 70 80 90 100 -1.6 -1.4 -1.2 -1 -0.8 -0.6 -0.4 -0.2 0 F F F F F F Grenache
Figure3.Seasonal patterns in midday Stem Water Potential (ΨS) in cvs. Merlot, Sangiovese and Grenache in 2016 (A-B-C) and 2017 (D-E-F) in vines
subjected to Full Irrigation (FI) and No Irrigation (NI) treatments. WS (Histogram) = water supply with irrigation treatment. = Irrigation treatment vines subjected to FI. = Irrigation treatment vines NI when plant reached -1.4 MPa stem water potential
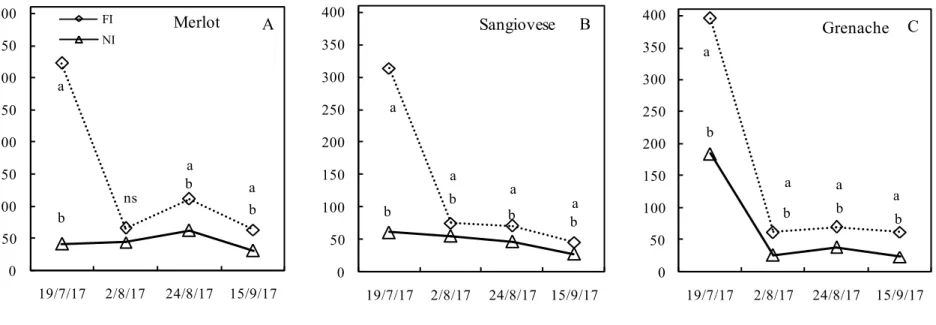
Gas exchange was measured in 2017, which was notably hotter than 2016. Stomatal conductance (Figure 4) was affected by water shortage, with significant differences among treatments and cultivars. With regards to the imposed treatment, higher stomatal conductance values were observed in FI treatment during the first field measurements. Subsequently, in the second, third and fourth measurement dates, stomatal conductance dropped in all cultivars, although the differences between NI and FI remained statistically significant. As for water restriction, cv. Grenache showed the lowest stomatal conductance.
In the first sampling date, cv. Merlot (Figure 4A) revealed a stomatal conductance of 323.33 mmol H20 m2 s-1 in FI vines, being the highest value recorded during the growing season. Subsequently, from the second date of measurements onwards, stomatal conductance dropped drastically to values between 63.12 and 111.6 mmol H20 m2 s-1in the rest of the season. The lowest values of stomatal conductance were observed in NI treatment. In the first date of measurements performed on 19 July, stomatal conductance was 41.66 mmol H20 m2 s-1. Subsequently, a slight increase in stomatal conductance was observed in the second and third measurement dates, 44 and 62 mmol H20 m2 s-1, respectively. At the end of the season, stomatal conductance in NI reached the lowest recorded value of 31.25 mmol H20 m2 s-1.
Also, in cv. Sangiovese (Figure 4B), higher values of stomatal conductance were observed in FI compared to NI treatment in the first date of measurements (314 mmol H20 m2 s-1 versus 61 mmol H20 m2 s-1, respectively). Subsequently, in both treatments, stomatal conductance showed a constant decrease, yet remaining statistically higher in FI than in NI until harvest, in which the values of 46 and 27 mmol H20 m2 s-1, respectively, were recorded.
The cv. Grenache (Figure 4C) showed a similar trend to Sangiovese and Merlot, in which the FI treatment was always significantly higher than NI treatment throughout the season. However, it is necessary to underline that, at the beginning of the measurements, stomatal conductance in both
conductance in the FI treatment remained quite constant throughout the season, whereas it recorded in the NI treatment the lowest value (season-long average of 29 mmol H20 m2 s-1) than that in cvs. Merlot and Sangiovese (45 and 43 mmol H20 m2 s-1, respectively).
a ns a a b b b 0 50 100 150 200 250 300 350 400 19/7/17 2/8/17 24/8/17 15/9/17 gs[ m m ol H2 O m -2s -1)] FI NI A Merlot a a a b b b b a 0 50 100 150 200 250 300 350 400 19/7/17 2/8/17 24/8/17 15/9/17 B Sangiovese a a a a b b b b 0 50 100 150 200 250 300 350 400 19/7/17 2/8/17 24/8/17 15/9/17 C Grenache
The different letters (a-b) indicate statistical significance at P ≤0.05 using T-test
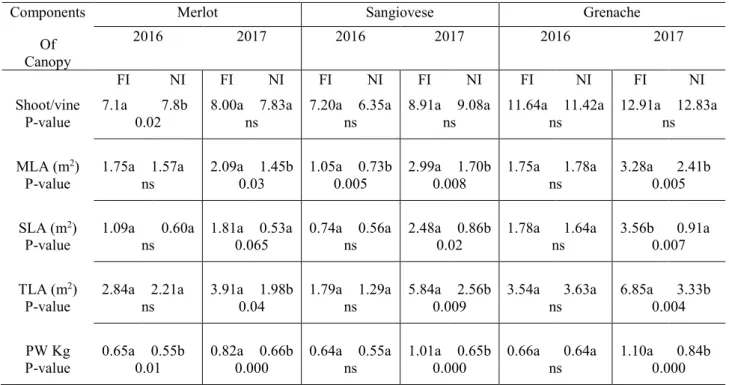
The main components of the canopy of cvs. Merlot, Sangiovese and Grenache are reported in Table 2. Significant differences in the number of shoots per vine were observed only in Merlot in 2016. In this cultivar, the shoot number per vine was higher in NI (7.8 shoots vine-1) with respect to FI treatment (7.1 shoots vine-1), while in the following season the statistical difference between the number of shoots per vine in FI and NI (8.0 and 7.83, respectively) was not significant. In cv. Sangiovese, the number of shoots per vine ranged from 6.35 to 7.2 in 2016 in NI and FI and from 8.91 to 9.08 in 2017 in FI and NI respectively. In cv. Grenache, FI and NI treatments induced about 11 and 13 shoots per vine in both 2016 and 2017, respectively.
Total leaf area differed between seasons. Both cvs. Merlot and Sangiovese showed a higher value of TLA in FI (2.84 m2 and 1.79 m2, respectively) compared to that in NI treatment (2.21 m2 and 1.29 m2, respectively) in 2016. In contrast, in cv. Grenache, TLA was slightly higher in NI irrigation treatment, with a value of 3.63 m2, compared to FI treatment (3.54 m2). It is important to underline that this difference was not significant when subjected to statistical analysis.
In 2017, FI treatment showed significantly higher values in all cultivars than NI treatment. For cvs. Merlot, Sangiovese and Grenache the values of TLA observed in FI and NI treatments were equal to 3.91 and 1.98, 5.84 and 2.56, 6.85 and 3.33 m2, respectively. Significant differences in TLA were observed in 2017 within each cultivar. In cv. Merlot and Sangiovese, MLA was higher than that of SLA both in FI and NI treatments in both experimental seasons. In Merlot, MLA in FI treatment was 1.75 and 2.09 m2 in 2016 and 2017, respectively, whereas in NI treatment the values of MLA were, respectively, equal to 1.57 and 1.45 m2. In Sangiovese, MLA in FI treatment was 1.05 and 2.99 m2, whereas in NI treatment the values were of 0.73 and 1.70 m2 in 2016
and 2017 respectively. A different canopy development was observed in cv. Grenache, as SLA was higher than MLA in FI treatment, reaching values of 1.78 and 3.56 m2 in 2016 and 2017, respectively. In contrast, in NI treatment, MLA was higher than SLA in both 2016 and 2017, as the MLA reached a value of 1.78 and 2.41 m2, respectively.
In the first season, in cv. Merlot, the pruning weight recorded in FI treatment appeared significantly higher than in NI treatment (Table 2). On the other hand, no statistical differences were detected in cvs. Sangiovese and Grenache. In the second season, FI treatment exhibited in all cultivars a significantly greater pruning weight than NI treatment. Comparing the two seasons and both treatments, cv. Grenache showed higher pruning weight values than cvs. Sangiovese and Merlot.
Table 2. Main components of canopy in cultivars Merlot, Sangiovese and Grenache in vines subjected to
Full irrigation (FI) and No irrigation (NI). MLA = Main leaf area; SLA= Secondary leaf area; TLA = total leaf area PW= Pruning weight
Components Of Canopy
Merlot Sangiovese Grenache
2016 2017 2016 2017 2016 2017
FI NI FI NI FI NI FI NI FI NI FI NI
Shoot/vine 7.1a 7.8b 8.00a 7.83a 7.20a 6.35a 8.91a 9.08a 11.64a 11.42a 12.91a 12.83a
P-value 0.02 ns ns ns ns ns
MLA (m2) 1.75a 1.57a 2.09a 1.45b 1.05a 0.73b 2.99a 1.70b 1.75a 1.78a 3.28a 2.41b
P-value ns 0.03 0.005 0.008 ns 0.005
SLA (m2) 1.09a 0.60a 1.81a 0.53a 0.74a 0.56a 2.48a 0.86b 1.78a 1.64a 3.56b 0.91a
P-value ns 0.065 ns 0.02 ns 0.007
TLA (m2) 2.84a 2.21a 3.91a 1.98b 1.79a 1.29a 5.84a 2.56b 3.54a 3.63a 6.85a 3.33b
P-value ns 0.04 ns 0.009 ns 0.004
PW Kg 0.65a 0.55b 0.82a 0.66b 0.64a 0.55a 1.01a 0.65b 0.66a 0.64a 1.10a 0.84b
P-value 0.01 0.000 ns 0.000 ns 0.000
Means within column/component followed by different letters were significantly different at P ≤ 0.05 using T-test. ns = not significant
Table 3 shows the yield and the yield components of the three cultivars under observation. Significant differences in yield, reported as kg vine-1, were observed in all cultivars and seasons except for cv. Grenache in 2016.
In cv. Merlot, in the first experimental year, FIA treatment (FI + ABA) with 2.42 kg vine-1 reached the highest yield, whereas FIC (FI - ABA), NIA (NI + ABA) and NIC (NI - ABA) yielded 1.96, 1.85 and 1.57 kg vine-1, respectively. In 2017, the yield recorded at harvest in irrigation treatments FIA and FIC, with 2.0 and 2.23 kg vine-1, respectively, was significantly different when compared with NIA and NIC, with productions per vine, respectively, equal to 1.20 and 1.10 kg.
Significant differences in yield were also observed in cv. Sangiovese. In 2016, the highest yield was reached by FIA treatment with 4.11 kg vine-1, which was not significantly different than FIC and NIA (2.84 and 3.16 kg vine-1, respectively). The lowest yield (2.16 kg vine-1) was measured in NIC treatment. In the following season, as observed in cv. Merlot, both irrigation treatments FIA and FIC (3.21 and 2.74 kg vine-1 of yield, respectively) were significantly higher than both no irrigation treatments NIA and NIC (1.92 and 1.96 kg vine-1, respectively).
Finally, in cv. Grenache, no significant differences were observed in 2016 among the different imposed treatments, whereas the observations in 2017 were in agreement with those in cvs. Merlot and Sangiovese. FIA and FIC treatments, with a weight of grapes equal to 2.59 and 2.97 kg vine-1, showed higher values compared with NIA and NIC, which yields were 1.53 and 1.88 kg vine-1, respectively.
Significant differences, were observed in the number of clusters in cv. Grenache. In 2016, FIA and FIC treatments (10.5 and 9.38 clustersvine-1, respectively) showed a lower cluster number per vine than NIA (12.92) and NIC (12.19) treatments. In contrast,
in 2017, FIA and FIC showed a higher number of clusters per vine (16.10 and 18.71, respectively) when compared to NIA and NIC treatments, which produced 10.80 and 12.64 clusters per vine, respectively. With regards to cluster weight, significant differences were observed among treatments, cultivars and years, except for cv. Sangiovese in the second season. Overall, both full irrigation treatments (FIA and FIC) showed higher values in cluster and berry weight compared to treatments without water supply (NIA and NIC).
Table 3. Effect of irrigation and exogenous ABA treatments on yield and yield components in cvs.
Merlot, Sangiovese and Grenache. FIA= Full irrigation (+) ABA; FIC= Full irrigation (–) ABA; NIA= No irrigation (+); ABA; NIC= No irrigation (–) ABA
Cultivar Season Treatment Yield (kg
vine-1) vinesCluster -1 (n°) Cluster weight (g) Berry weight (g)
Merlot 2016 FIA 2.42 a 14.50 167.56 a 1.88 a FIC 1.96 b 14.38 137.45 b 1.78 a NIA 1.85 b 16.00 116.12 bc 1.48 b NIC 1.57 b 15.38 99.34 c 1.20 b P-value (T) 0.002 ns 0.0001 0.012 2017 FIA 2.00 a 13.6 151.9 a 1.57 a FIC 2.23 a 14.00 157.74 a 1.50 a NIA 1.20 b 12.5 105.13 b 1.00 b NIC 1.10 b 11.5 105.92 b 0.90 b P-value (T) 0.000 ns 0.000 0.03
Sangiovese 2016 FIA 4.11a 9.5 328.33 a 2.44
FIC 2.84ab 9.65 234.23 ab 2.22 NIA 3.16 a 8.66 281.68 a 2.26 NIC 2.16 b 8.85 216.10 b 1.85 P-value (T) 0.016 ns 0.002 ns 2017 FIA 3.21 a 13.93 239.67 2.32 a FIC 2.74 a 12.33 231.00 2.12 a NIA 1.92 b 10.26 211.20 1.46 b NIC 1.96 b 11.13 189 1.27 b P-value (T) 0.003 ns ns 0.006 Grenache 2016 FIA 1.41 10.5 bc 136.40 a 2.81 a FIC 1.45 9.38 c 166.91 a 2.82 a NIA 1.59 12.92 a 133.85 b 2.49 ab NIC 1.61 12.19 ab 129.87 b 2.27 b P-value (T) ns 0.015 0.028 0.025 2017 FIA 2.59 a 16.10 ab 218.78 a 2.65 a FIC 2.97 a 18.71 a 162.70 ab 2.61 a NIA 1.53 b 10.80 c 160.31 ab 2.0 b NIC 1.88 b 12.64 bc 148.86 b 1.80 b P-value (T) 0.002 0.02 0.01 0.02
Means within column/(cultivar-season) followed by different letters were significantly different at P ≤ 0.05 using LSD test. ns = not significant
3.3. Grape berry composition in response to water deficit and abscisic acid application 3.3.1. Cultivar Merlot
In the first season, total soluble solids (TSS) and total acidity (TA) ripening dynamics were quite similar among treatments (Figure 5A, B). No significant differences were observed in either TSS and TA at harvest, with values included in a range from 22 to 23 °Brix for FIC and NIA respectively, and ranged from 4.17 to 3.6 g L-1 for FIA and FIC respectively.
In 2017, significant differences in TSS (Figure 5C) were observed 20 days after veraison and until harvest. The evolution in the TSS accumulation was characterized by two well-defined trends. Both treatments not subjected to irrigation (NIA and NIC) showed a significantly higher accumulation rate than treatments with water supply (FIA and FIC). At harvest, sugar concentration in NIC and NIA ranged from 24.99 to 23.73 °Brix respectively, whereas, in FIA and FIC, TSS ranged from 21.93 to 21.66 °Brix respectively. No significant differences in TA were observed among treatments at harvest (Figure 5D), with values ranged from 2.71 to 3.06 in FIC and FIA respectively. Comparing the seasons, higher sugar concentration and lower acidic contents were observed in 2017 than in 2016.
In 2016, no significant differences were observed for total anthocyanins and phenolics (Figure 6A, B). Twenty days after veraison (25 August 2016), all treatments reached the maximum concentration of the total anthocyanins accumulated in the grape (Figure 6A). The highest value was observed in FIA treatment (297 mg L-1), followed by NIA, FIC and NIC treatments, which showed values of 271, 257 and 224 mg L-1 respectively. Anthocyanins decreased abruptly after reaching the seasonal peak on 25 August 2016. No significant differences were observed at harvest time.
Starting from veraison, on 5 August 2016, total phenolics in FIA and FIC showed a constant increase over time reaching the maximum values on 19 September 2016 (Figure 6B). The highest value was reached by FIA treatment (1454 mg L-1), followed by FIC treatment (1381 mg L-1). Subsequently, total phenolics in FIA and FIC decreased until harvest. NIA and NIC treatments were characterized by the lowest accumulation rates but showed also a limited decrease in total phenolics after the peak (19 September 16). At harvest, no significant differences were observed among treatments in the first season.
During the following season, all treatments reached the highest anthocyanin content on 31 August 2017 (Figure 6C). On that date, anthocyanin values were equal to 667, 666, 639 and 568 mg L-1 on FIC, NIA, FIA and NIC respectively. After reaching the peak, total anthocyanins started to decrease in all treatments, except for NIA. No significant differences were observed at harvest with value of 672, 591, 544 and 520 for NIA FIC NIC and FIA respectively.
The evolution of the total phenol concentration over time turned out to be quite similar to total anthocyanin dynamics (Figure 6D). The peak of polyphenols was observed on 31 August 2017, simultaneously with anthocyanins. On that date, total polyphenols were equal to 1575, 1508, 1485 and 1348 mg L-1, for FIC, NIA, FIA and NIC treatments respectively. Subsequently, total phenols progressively decreased, except for NIA treatment. Treatments subjected to full irrigation (FIC and FIA) showing a higher decrease. No significant differences were observed at harvest, in which total polyphenols ranged from 1315 to 1530 mg L-1, respectively measured in NIA and NIC treatments.
Figure 5. Seasonal variations of grape Total Soluble Solids and Titratable Acidity in cv. Merlot for each
experimental season and treatment. FIA= Full irrigation (+) ABA; FIC= Full irrigation (–) ABA; NIA= No irrigation (+) ABA; NIC = No irrigation (–) ABA
The different letters indicate statistical significance at P ≤ 0.05 using LSD test. ns= not significant
ns ns ns ns 10 12 14 16 18 20 22 24 26 5/8/16 25/8/16 19/9/16 3/10/16 T ot al s ol ub le s ol id s (° Bri x) FIC NIC FIA NIA A Merlot ab ns a ns ns a b 2 3 4 5 6 7 8 9 10 11 12 5/8/16 25/8/16 19/9/16 3/10/16 T itra ta bl e a ci di ty (g /L ta rt ari c ac id ) B Merlot ns b b b a a a b b b a a a 10 12 14 16 18 20 22 24 26 26/7/17 17/8/17 31/8/17 14/9/17 T ot al s ol ub le s ol id s (° Bri x) C Merlot ns ns ns ns 2 3 4 5 6 7 8 9 10 11 12 26/7/17 17/8/17 31/8/17 14/9/17 T itra ta bl e ac id ity (g /L ta rt ari c ac id ) D Merlot
Figure 6. Seasonal variations of grape total Anthocyanins and Phenolics in cv. Merlot for each
experimental season and treatment. FIA= Full irrigation (+) ABA; FIC= Full irrigation (–) ABA; NIA= No irrigation (+) ABA NIC = No irrigation (–) ABA
The different letters indicate statistical significance at P ≤ 0.05 using LSD test. ns= not significant
ns ns ns ns 20 70 120 170 220 270 320 5/8/16 25/8/16 19/9/16 3/10/16 A nt ho cy an in s (m g /L ) FIC NIC FIA NIA A Merlot ns ns ns ns 700 800 900 1000 1100 1200 1300 1400 1500 1600 5/8/16 25/8/16 19/9/16 3/10/16 Ph en ol ic s (m g /L ) B Merlot ns ns ns ns 300 350 400 450 500 550 600 650 700 26/7/17 17/8/17 31/8/17 14/9/17 A nt ho cy an in s (m g /L ) C Merlot ns ns ns ns 700 800 900 1000 1100 1200 1300 1400 1500 1600 26/7/17 17/8/17 31/8/17 14/9/17 Ph en ol ic s (m g /L ) D Merlot
3.3.2. Cultivar Sangiovese
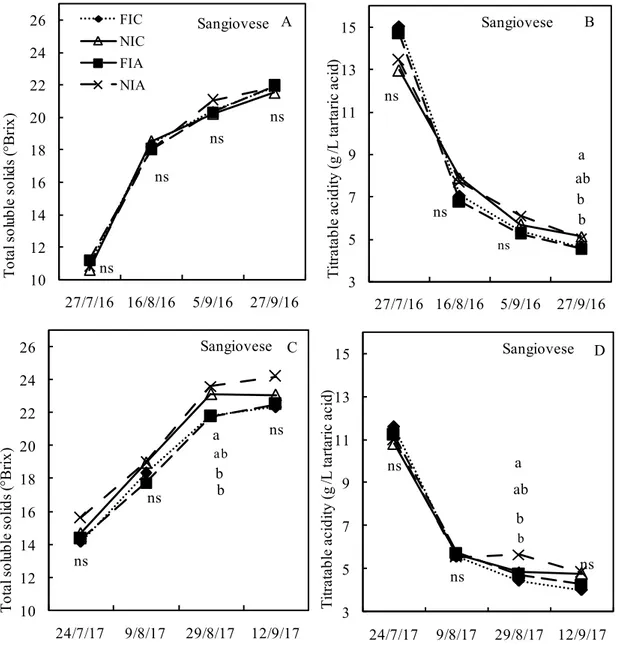
In 2016, no significant differences among treatments were observed with respect to TSS (Figure 7A). The average values were included in a range between 21.93 and 21.53 °Brix, respectively measured in NIC and FIA treatments. TSS dynamics showed a steep accumulation rate in the first twenty days after veraison, afterwards the accumulation rate decreased. Total acidity showed significant differences among treatments at harvest (Figure 7B). A higher value of TA was observed in NIC and NIA treatments, with values equal to 5.12 and 5.05 g L-1, whereas lower values, equal to 4.62 and 4.55 g L-1, were observed in FIA and FIC.
In 2017, both treatments not subjected to irrigation (NIA and NIC) showed higher TSS values compared to FIA and FIC treatments (Figure 7C). Significant differences were observed on the third date of sampling, on 29 August. On that date, the highest value was observed in NIA treatment, followed by NIC, FIA and FIC, with TSS values being equal to 24.2, 23.0, 22.55 and 22.33 °Brix respectively. At harvest, treatments showed the same ranking, although no significant differences were detected. In relation to TA (Figure 7D), significant differences among treatments were observed on the third sampling date on 29 August, in which NIA reached a higher value than NIC, FIA and FIC. Once again, no significant differences were observed at harvest.
In 2016, no significant differences were observed for both total anthocyanins and polyphenols (Figure 8A, B). Total anthocyanins showed the maximum values twenty days after veraison. A higher value was observed in NIC, followed by FIC, FIA and NIA respectively, with 216, 187, 173 and 156 mg L-1. At harvest, all treatments ranged from 119 to 90 mg L-1 (NIA and FIA treatments, respectively). Total polyphenols accumulation constantly increased throughout the season, reaching the highest value at
harvest time. Even though differences among treatments were not significant on the last sampling, the highest value was recorded in FIC treatment, followed by NIA NIC and FIA treatments.
In the second year of the study, the highest amount of total anthocyanins (Figure 8C) was measured on 29 August, except for NIC treatment, in which the highest value was reached on the last sampling date. The FIC and FIA treatments showed a quite similar trend, whereas NIA was characterized by a higher anthocyanin accumulation in the first month after veraison, followed by a decrease in the last part of the season. In contrast, NIC treatment exhibited a lower accumulation rate in the first month after veraison, followed by an increase in anthocyanins in the last part of the season. At harvest, significant differences were observed among treatments. A higher value was observed in NIA and NIC treatments, with average values equal to 543 and 536 mg L-1, respectively, whereas lower values were observed for FIC and FIA treatments, with levels of anthocyanins equal to 436 and 401 mg L-1 respectively.
Total phenolics in 2017 (Figure 8D) showed an uncommon trend that is complex to explain. No significant differences were observed in total phenols at harvest. However, the evolution of total phenols over time highlighted higher values in both treatments with no irrigation (NIA and NIC) than in irrigation treatments (FIC and FIA).
Figure 7. Seasonal variations of grape Total Soluble Solids and Titratable Acidity in cv. Sangiovese for each experimental season and treatment. FIA= Full irrigation (+) ABA; FIC= Full irrigation (–) ABA; NIA= No irrigation (+) ABA; NIC = No irrigation (–) ABA
The different letters indicate statistical significance at P ≤ 0.05 using LSD test. ns= not significant
ns ns ns ns 10 12 14 16 18 20 22 24 26 27/7/16 16/8/16 5/9/16 27/9/16 T ot al s ol ub le s ol id s (° Bri x) FIC NIC FIA NIA A Sangiovese ab ns ns ns b a b 3 5 7 9 11 13 15 27/7/16 16/8/16 5/9/16 27/9/16 T itra ta bl e ac id ity (g /L ta rt ari c ac id ) B Sangiovese b ns ns ab ns b a 10 12 14 16 18 20 22 24 26 24/7/17 9/8/17 29/8/17 12/9/17 T ot al s ol ub le s ol id s (° Bri x) C Sangiovese b ns ns b ns ab a 3 5 7 9 11 13 15 24/7/17 9/8/17 29/8/17 12/9/17 T itra ta bl e ac id ity (g /L ta rt ari c ac id ) D Sangiovese
Figure 8. Seasonal variations of grape total Anthocyanins and Phenolics in cv. Sangiovese for each
experimental season and treatment. FIA= Full irrigation (+) ABA; FIC= Full irrigation (–) ABA; NIA= No irrigation (+) ABA NIC = No irrigation (–) ABA
The different letters indicate statistical significance at P ≤ 0.05 using LSD test. ns= not significant
ns ns ns ns 20 70 120 170 220 270 27/7/16 16/8/16 5/9/16 27/9/16 A nt ho cy an in s (m g /L ) FIC NIC FIA NIA A Sangiovese ns ns ns ns 800 1000 1200 1400 1600 1800 2000 27/7/16 16/8/16 5/9/16 27/9/16 Ph en ol ic s (m g /L ) B Sangiovese ab ns ns ns b ab a 20 120 220 320 420 520 620 720 24/7/17 9/8/17 29/8/17 12/9/17 A nt ho cy an in s (m g / L ) C Sangiovese ns ns ns ns 800 1000 1200 1400 1600 1800 2000 2200 24/7/17 9/8/17 29/8/17 12/9/17 Ph en ol ic s (m g /L ) D Sangiovese
3.3.3. Cultivar Grenache
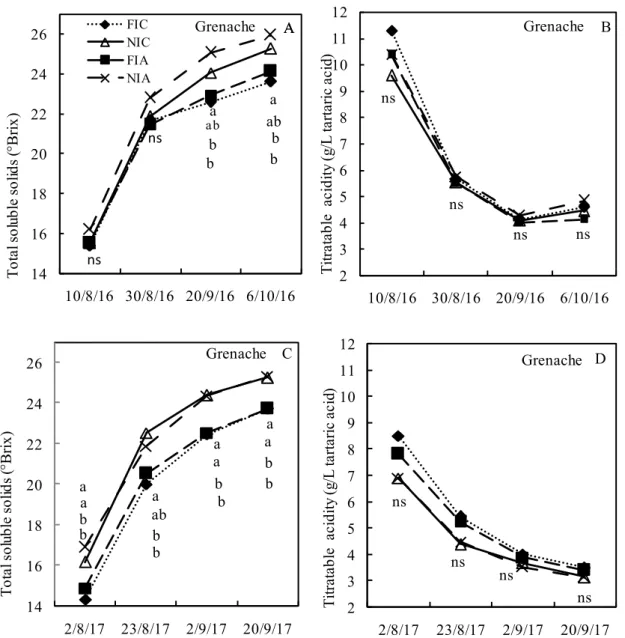
Unlike for cvs. Sangiovese and Merlot, significant differences were observed in TSS in 2016 for cv. Grenache (Figure 9A). The highest values were found in no irrigation treatments, either with or without ABA applications, reaching 25.9 °Brix (NIA) and 25.3 (NIC) °Brix, whereas lower values were found in the irrigation treatments (24.1 °Brix in FIA and 23.6 °Brix in FIC). No significant differences were observed in TA at harvest (Figure 9B), in which the recorded values were 4.82, 4.60, 4.40 and 4.12 g L-1 in NIA, FIC, NIC and FIA treatments, respectively.
In 2017, the ripening dynamics of TSS (Figure 9C) seemed to be quite similar with respect to 2016, although the effect of irrigation was more pronounced than in 2016, and no influence of ABA supply was observed. At harvest, TSS in berries reached 25.3 and 25.2 °Brix in NIA and NIC, respectively, whereas TSS were equal to 23.7 °Brix in both FIA and FIC treatments. With regards to TA, as in 2016, no significant differences were observed in 2017 (Figure 9D), although higher values were recorded in irrigation treatments. The average titratable acidity ranged from 3.47 to 3.11 g L-1, for FIC and NIA treatments respectively.
Significant differences were observed in total anthocyanins in both seasons (Figure 10A, C). In 2016, both irrigation treatments showed the highest peak values twenty days after veraison, with concentrations of 73 and 68 mg L-1 measured in FIA and FIC treatments. In contrast, NIA and NIC reached the highest anthocyanin accumulation on the third sample, on 20 September, exhibiting values of 100 and 90 mg L-1 respectively, which then decreased on the last sampling. At harvest, significant differences were observed among treatments, since NIC and NIA, with values of 58 and
51 mg L-1, respectively, showed a higher anthocyanin accumulation than FIA and FIC (38 and 29 mg L-1, respectively).
No significant differences were observed in total phenols in 2016 (Figure 10B). The highest peak of total phenols was observed on 20 September. The highest values were detected in NIC and NIA treatments (2788 and 2712 mg L-1, respectively) compared to FIC and FIA (2490 and 2417 mg L-1, respectively). At harvest, the highest value, equal to 2639 mg L-1, was observed in NIA treatment, followed by NIC, FIA and FIC treatments with 2397, 2244 and 2184 mg L-1 respectively.
In 2017, significant differences in total anthocyanins were observed at harvest (Figure 10C), in which NIA and NIC treatments showed the highest anthocyanin accumulation (411 and 367 mg L-1, respectively), whereas FIA and FIC treatments showed significantly lower values of 279 and 276 mg L-1 respectively. The higher anthocyanins degradation observed in the first season is probably due to an over-ripening process. Furthermore, in both years we observed a less marked degradation of anthocyanin in the treatment kept in water restriction condition.
The highest phenol peak was observed at harvest in 2017 (Figure 10D). Even though no significant differences were observed, NIC and NIA treatments showed a higher total phenol accumulation (1259 and 1249 mg L-1) than FIC and FIA treatments (1035 and 961 mg L-1).
Figure 9. Seasonal variations of grape Total Soluble Solids and Titratable Acidity in cv. Grenache for
each experimental season and treatment. FIA= Full irrigation (+) ABA; FIC= Full irrigation (–) ABA; NIA= No irrigation (+) ABA; NIC = No irrigation (–) ABA
The different letters indicate statistical significance at P< 0.05 using LSD test. ns= not significant
ns ns ns ns 2 3 4 5 6 7 8 9 10 11 12 10/8/16 30/8/16 20/9/16 6/10/16 T itra ta bl e a ci di ty (g /L ta rt ari c ac id ) B Grenache b b ab ab b b a a 14 16 18 20 22 24 26 10/8/16 30/8/16 20/9/16 6/10/16 T ot al s ol ub le s ol id s (° Bri x) FIC NIC FIA NIA A Grenache A ns ns b b b b a a a a b b b b a ab a a 14 16 18 20 22 24 26 2/8/17 23/8/17 2/9/17 20/9/17 T ot al s ol ub le s ol id s (° Bri x) C Grenache ns ns ns ns 2 3 4 5 6 7 8 9 10 11 12 2/8/17 23/8/17 2/9/17 20/9/17 T itra ta bl e a ci di ty (g /L ta rt ari c ac id ) D Grenache
Figure 10. Seasonal variations of grape total Anthocyanins and Phenolics in cv. Grenache for each
experimental season and treatment. FIA= Full irrigation (+) ABA; FIC= Full irrigation (–) ABA; NIA= No irrigation (+) ABA NIC = No irrigation (–) ABA
The different letters indicate statistical significance at P ≤ 0.05 using LSD test. ns= not significant
b b ns ns a a b b a a 20 30 40 50 60 70 80 90 100 10/8/16 30/8/16 20/9/16 6/10/16 A nt hoc ya ni ns (m g/ L ) FIC NIC FIA NIA A Grenache ns ns ns ns 1500 1700 1900 2100 2300 2500 2700 2900 10/8/16 30/8/16 20/9/16 6/10/16 Ph en ol ic s (m g/ L ) B Grenache ns ns ns b a b a 120 170 220 270 320 370 420 2/8/17 23/8/17 2/9/17 20/9/17 A nt hoc ya ni ns (m g/ L ) C Grenache ns ns ns 1 201 401 601 801 1001 1201 23/8/17 2/9/17 20/9/17 P he nol ic s (m g/ L ) D Grenache
3.4. Skin thickness in response to water deficit and ABA application
The Merlot skin thickness (Figure 11A, B) observed during the study showed a different trend between years. In 2016, significant differences were observed on the first and second sampling dates. Higher values of skin thickness were observed at veraison and then decreased during ripening, reaching at harvest values of 0.132, 0.132, 0.129 and 0.127 mm, respectively for NIC, FIA, NIA and FIC. In 2017, skin thickness showed more fluctuations throughout the season. Significant differences were observed during the second and third samplings. At harvest, the highest value was observed in FIC, followed by NIA FIC and NIC treatments with values of 0.174, 0.168, 0.166 and 0.160 mm, respectively. Comparing both seasons, although no significant differences were observed at harvest, higher values were reached in 2017 with respect to 2016.
In cv. Sangiovese in 2016, skin thickness (Figure 11C) increased after veraison (27 July 2016) in both no irrigation treatments NIA and NIC, reaching the highest values (0.198 and 0.195 mm respectively) in about twenty days. Subsequently, skin thickness decreased until harvest, exhibiting values of 0.157 and 0.172 mm in NIA and NIC treatments, respectively. Full irrigation treatments (FIC and FIA) showed different patterns, as the skin thickness in FIC treatment showed a fairly constant trend with a value of 0.194 mm at veraison (27 July 2016) and 0.197 mm at harvest (27 September 2016), in which it exhibited the significantly highest value. On the other hand, FIA treatment showed a constant decrease starting from veraison (0.185 mm) until harvest (0.163 mm). In 2017, skin thickness decreased after veraison (24 July 2017) for about twenty days, with a more pronounced decrease in the no irrigation treatments, increasing afterwards in all treatments (Figure 11D). At harvest, no significant differences were observed among treatments, with skin thickness ranging from 0.216 to
0.201 mm, in FIC and FIA respectively. As for cv. Merlot, also in Sangiovese skin thickness at harvest was higher in 2017 than in 2016 in all treatments.
As generally occurred for the other cultivars, skin thickness in 2016 decreased in cv. Grenache too, starting from veraison (10 August) (Figure 11E). However, unlike for Merlot and Sangiovese, an increase in skin thickness was observed in all treatments from the third sampling (20 September 2016) onwards. At harvest, among all treatments, the increase was significantly the lowest in FIA treatment (0.118 mm), whereas values in NIC, FIA and FIC were similar (0.214, 0.207 and 0.204 mm, respectively). In 2017, skin thickness evolution showed a clear opposite trend (Figure 11F). Starting from veraison (2 August 2017), skin thickness increased in all treatments until 1 September, to then decreasing until harvest (20 September 2017). No significant differences among treatments were found at harvest, in which skin thickness ranged between 0.222 and 0.206 mm, for NIA and FIA respectively. Unlike for cvs. Sangiovese and Merlot, treatments in Grenache showed similar values in both 2016 and 2017.
The different letters indicate statistical significance at P ≤ 0.05 using LSD test. ns= not significant a a ns a ab ns b a b b 0.1 0.12 0.14 0.16 0.18 0.2 0.22 0.24 0.26 26/7/17 17/8/17 31/8/17 14/9/17 B Merlot a ns c ns ns b c 0.1 0.12 0.14 0.16 0.18 0.2 0.22 0.24 0.26 24/7/17 9/8/17 29/8/17 12/9/17 D Sangiovese c c ns ns b a ab ab bc 0.1 0.12 0.14 0.16 0.18 0.2 0.22 0.24 0.26 5/8/16 25/8/16 19/9/16 31/10/16 Sk in th ic kn es s (m m ) FIC NIC FIA NIA a A Merlot ab a a c ns b b a b b b ab b 0.1 0.12 0.14 0.16 0.18 0.2 0.22 0.24 0.26 27/7/16 16/8/16 5/9/16 27/9/16 C Sangiovese a ns ns ns a b a 0.1 0.12 0.14 0.16 0.18 0.2 0.22 0.24 0.26 10/8/16 30/8/16 20/9/16 6/10/16 E Grenache ns ns ns ns 0.1 0.12 0.14 0.16 0.18 0.2 0.22 0.24 0.26 2/8/17 23/8/17 2/9/17 20/9/17 F Grenache
Figure 11. Seasonal variations of grape skin thickness for each experimental season and treatment in Merlot, Sangiovese and Grenache 2016 (A-C-E) and 2017 (B-D-F). FIA= Full irrigation (+) ABA; FIC= Full irrigation (-) ABA; NIA= No irrigation (+) ABA NIC = No irrigation (-) ABA
4. DISCUSSION
The physiological and qualitative grape berry comparative study on the three cultivars selected on their anisohydric, Merlot and Sangiovese (Chaves at al., 2010; Dal Santo et al., 2016), or isohydric, Grenache (Soar et al., 2006) behaviour has highlighted several useful indications for growers and researchers. The cv. Merlot, originating in France, is the second cultivar in terms of hectares in the grape-growing regions worldwide (Anderson, 2014). The cv. Sangiovese, which originates in Italy (Calò et al., 2001) and constitutes the basis of 12.5% of internationally known ‘Denomination of origin’ wines (Staraz, 2007), is the most widely grown cultivar of V. Vinifera L. in Italy (Merli et al., 2014), mainly in Tuscany. The cv. Grenache, native to the Mediterranean area (Schultz, 2003), is cultivated in the main world’s wine regions and represents the seventh most cultivated cultivar worldwide (Anderson, 2014). In Italy, cv. Grenache is widely cultivated in Sardinia covering the 29% of the vine-cultivated surfaces (Nieddu, 2011).
Traditionally, it was generally accepted in viticulture that water supply in vineyard was detrimental for the wine quality to the extent that, in some areas, watering became a prohibited agronomic practice (Castellarin et al., 2011). However, the dramatically increasing frequency of summers, during which drought period occurs, has shifted the attention to the actual need for additional irrigation (Poni et al., 2007).
In order to set up appropriately water scheduling in the vineyard, it is important to know the water status of the vines. Among different physiological indicators, stem water potential represents an accurate tool for determining the vine water status (Chone et al., 2001). Values higher than -0.6 and lower than -1.4 MPa, indicate the conditions of no water stress and severe water stress, respectively (Van Leeuwen et al., 2009).
During the experiment, stressed vines of all the three cultivars showed, as expected, a lower stem water potential than irrigated vines. This difference was caused by the increasing evaporative demand observed throughout the growing season, mainly due to higher temperatures (Cordoba et al., 2015). Among the observed cultivars, in both seasons, Grenache exhibited a higher value of stem water potential in irrigated and stressed vines, confirming the difference in stomatal sensitivity between genotypes (Palliotti et al., 2014). The different varietal behaviour, observed by evaluating the relationship between the genotype and the water status, has highlighted how these studies represent an important tool for an adequate irrigation management (Cordoba et al., 2015). In fact, it is important to highlight that in both years, cv. Grenache has never reached the irrigation threshold of-1.4 MPa in water stress treatments, adopted as indicator of severe water deficit (Van Leeuwen et al., 2009).
As observed by Schultz (2003), our experiment confirmed that cv. Grenache showed a typical isohydric behaviour. In contrast, we noted that stem water potential values in stressed vines dropped significantly below the minimum leaf water potential of well-watered vines. The cultivars Sangiovese and Merlot showed a similar anisohydric behaviour, characterized by the lowest negative values in stem water potential. Our findings confirm those by Shellie and Glenn (2008) and Palliotti et al. (2014), who stated that the drought response of Merlot and Sangiovese was a near-anisohydric behaviour.
Midday depression of gas exchange is commonly observed in plants (Zhang et al., 2013), in which stomatal conductance represents a key mechanism in response to water stress (Chaves et al., 2010; Lovisolo et al., 2010), leading to the prevention of a critical decrease in leaf water potential (Sperry et al., 2002). It is acknowledged that the timing
and the intensity of response to soil and atmospheric water deficit, namely stomatal control, depend greatly on the genotype (Chaves et al., 2010). In our experience, a lower stomatal conductance underwater restriction conditions highlights that cv. Grenache has a greater control on stomatal conductance than cvs. Merlot and Sangiovese.
Zhang et al. (2013) indicated that plant species have different strategies in coordinating long-distance water transport and stomatal behaviour. Indeed species with high hydraulic capacitance and conductivity appear to have a relatively risky stomatal strategy. In contrast, species with low capacitance and hydraulic conductivity seem to have a relatively strong stomatal control. Recent researches have highlighted that the capability of genotypes to close stomata, at a given stem water potential threshold, was correlated with its xylem vulnerability to cavitation (Tombesi et al., 2016). In fact, Dal Santo et al. (2016) hypothesized that an increased transpiration due to a higher leaf area could be caused by a smaller loss of hydraulic conductivity due to a lower xylem vulnerability to cavitation. Furthermore, although Soar et al. (2006) stated that ABA physiology is a key process in drought responses between isohydric vs anisohydric behaviours, a recent study conducted in V. Vinifera L. has pointed out that the passive hydraulic control of stomatal closure appears to be dominant over eventual chemical signalling at the early phases of drought stress (Tombesi et al., 2016). Finally, the study conducted by Rossdeutsch et al. (2016) highlighted that Vitis genotypes exhibiting different levels of drought adaptation differed in key steps involved in ABA metabolism and signalling; both under well-watered conditions and in response to water deficit.
The increased ABA content produced to promote stomatal closure in order to reduce cavitation risks, could at the same time affect the metabolism with positive repercussions also on the quality of berries as observed in cv. Grenache.
It is well known that water stress affects the berry chemical composition through two main mechanisms: the “concentration effect” through a berry size reduction that increases the skin to pulp ratio (Roby et al., 2004), and the enhanced biosynthesis through the up-regulation of related genes (Castellarin et al., 2007; Deluc et al., 2009). However, depending on the applied water stress level, a contradictory behaviour among cultivars is reported in literature. This can be due to different environmental conditions and the application of various agronomic techniques. Herrera et al. (2017) found that total soluble solids (°Brix) were reduced by water deficit in cv. Merlot due to the lower photosynthetic rate induced by the water scarcity in the soil. In contrast, Salon et al. (2005) and Girona et al. (2006) stated that a significant difference was observed in cvs. Pinot noir and Bobal when a severe water stress was applied. Moreover, in cv. Merlot, Bucchetti et al. (2011) reported a positive effect of water stress on anthocyanin concentration. In contrast, Merli et al. (2015), in an experiment conducted in cv. Sangiovese, stated that total anthocyanins and phenolics were neither affected in vines under well-watered conditions or subjected to progressive post-veraison water stress. Furthermore, must composition could be influenced by genetic factors. In a recent study conducted by Merli et al. (2016), authors suggested that grafting the same cultivars onto different rootstocks can trigger a differential gene regulation under water stress and higher temperatures leading to a different must composition. It is clear that varietal responses are the result of specific interactions between environmental, agronomic and genetic factors.
In our study, different behaviour shave been observed among cultivars and throughout years. The effect of water stress on sugar accumulation was detected in cvs. Sangiovese and Merlot in 2017, in which higher concentrations of soluble solids were
observed in vines subjected to water restrictions because of ‘concentration effects’. Our result could not confirm previous findings by Herrera et al. (2017) and Merli et al. (2015) in cvs. Merlot and Sangiovese. In fact, Herrera et al. (2017) assumed that the reduced sugar accumulation was related to a lower photosynthetic rate induced by water stress. In contrast, in cv. Grenache, the significant difference in sugar accumulation among treatments was observed in both years. However, while in 2017 the significant difference was attributed only to water stress, there was also a slight effect of exogenous ABA in 2016 (Wheeler et al., 2009).
As observed for primary metabolites, water stress can increase the concentration of secondary metabolites in skin and seeds through the reduction of the berry size (Roby et al., 2004) and up-regulation of genes (Savoi et al., 2016). Hochberg et al. (2013) compared the cvs. Cabernet Sauvignon and Shiraz, which showed to have iso and anisohydric behaviours, respectively, have found that Cabernet Sauvignon was characterized by milder metabolic perturbations. This result was probably due to a tighter regulation of the stomata upon stress induction during water stress. The same authors suggested a link between the vine hydraulics and changes deficit in the berry skin metabolism driven by water, with significant consequences on the metabolic composition of the fruit. In contrast, in our experiment, positive effects of water stress on berry composition were observed in cv. Grenache, characterized by isohydric behaviour, whereas no significant effect was observed on total anthocyanins or total phenols in cvs. Merlot and Sangiovese, categorized as anisohydric cultivars.
It is well known that complex interactions between agronomic, climatic and genetic factors may induce a different metabolic response to water stress. However, in view of our results, cultivars with a contrasting response to water stress could be used in
further detailed studies (Pinasseau et al., 2017). According to Pinasseau et al. (2016), it would be also interesting to characterize the plant physiological status as observed in our experiment, in order to determine whether these contrasting behaviours are related to near iso/anisohydric phenomenon. Further comparisons could also be made through a genome-wide association study.
Dal Santo et al. (2016) observed that isohydric behaviour showed a faster trascriptome response after stress imposition, a faster abscisic acid-related gene modulation, a more rapid expression on heat shock protein (HSP) genes, and a reversion of gene-expression profile after rewatering.
The specific characteristics of the cultivars investigated has influence the synthesis of metabolites in different ways. The greater stomatal control could favour a better management of the soil water reserve reducing the water loss by transpiration. In fact, the timing of stress occurrence and its severity could lead to negative effects on phenolic compound concentrations (Ojeda et al., 2002). In our experiment, except for Sangiovese in 2017, secondary metabolite accumulation in cvs. Merlot and Sangiovese was neither negatively or positively affected by water stress conditions. However, as stated for TSS, the observed significant differences could be attributed to the ‘concentration effect’ in the berries.
In addition to the stomatal regulation, several studies have highlighted the role of ABA in the control of grape berry maturation. This double interaction would amplify the perturbation of secondary metabolites in the cv. Grenache instead of in cvs. Merlot and Sangiovese, since the latter are characterized by a lower stomatal control as also observed in our study. A recent study conducted by Rossdeutsch et al. (2016) has stated