Appetite for Beef: How much meat did early New Yorkers consume?
19
0
0
Testo completo
(2)
(3) EUROPEAN UNIVERSITY INSTITUTE, FLORENCE. MAX WEBER PROGRAMME. Appetite for Beef: How Much Meat Did Early New Yorkers Consume? GERGELY BAICS. EUI Working Paper MWP 2010/15.
(4) This text may be downloaded for personal research purposes only. Any additional reproduction for other purposes, whether in hard copy or electronically, requires the consent of the author(s), editor(s). If cited or quoted, reference should be made to the full name of the author(s), editor(s), the title, the working paper or other series, the year, and the publisher. ISSN 1830-7728. © 2010 Gergely Baics Printed in Italy European University Institute Badia Fiesolana I – 50014 San Domenico di Fiesole (FI) Italy Hwww.eui.eu Hcadmus.eui.eu.
(5) Abstract Drawing on new archival data for the period from 1790 to 1818, this paper documents how much red meat per capita was consumed by an average New Yorker in the early Republican era, a period for which no systematic figures of urban meat consumption are yet available. The analysis shows that per capita meat consumption rates in America’s largest and fastest growing city reached an equilibrium that exceeded not only contemporary standards, both in comparison to the countryside and to other major European cities, but also compared favorably to the highest recorded figures in American history. In addition, city dwellers ate first and foremost fresh meat, beef in particular, which set them apart from their rural counterparts, and defined an important aspect of their urban standard of living. There was, however, a price to be paid for this urban privilege: external shocks, including epidemics or wars, could severely disrupt the city’s supply chains, causing additional hardships for urban households in provisioning themselves with fresh food.. Keywords Urban history, economic history, history of food, history of New York City, American history.
(6)
(7) Introduction This paper has one simple objective: to establish how much meat per capita was consumed by an average New Yorker in the early Republican era, a period for which no systematic data of urban meat consumption levels are yet available. Why is this an important issue? First, New York became America’s largest city between the 1790s and late 1810s, during which time the city’s population quadrupled from about 30,000 to over 120,000 residents. How well New Yorkers were supplied with fresh food over the three decades that made their city the first metropolis of North America is an important issue when considering the material conditions of modern urbanization. Cities—beyond a certain scale—cannot feed themselves. With rapid modern urbanization, urban societies have faced the vital challenge of provisioning their rapidly growing populations. Second, recent research in economic and demographic history provides ample evidence that, despite rising per capita income, the biological standards of living, measured customarily by infant mortality rates and adult male body heights, declined in the mid-19th century in America as well as in a series of West European nations.1 Scholars have identified urbanization, above all the resulting deterioration of disease environments, and falling protein, in particular meat consumption levels for birth cohorts between the 1830s and 1860s as the major causes of what they termed the Antebellumpuzzle. One of the missing pieces of the puzzle in the American context is reliable estimates of meat consumption levels before the decline began around the mid-1830s. Third, meat consumption rates are important for a better understanding of the subjective dimensions of the material conditions of urban life. For instance, European immigrants in mid-19th century New York frequently emphasized in their letters sent back home, how in America even the poor could eat meat each and every day, emphasising this specific aspect of their new American living standard.2 Meat was a serious matter: it not only provided the main sources of protein for residents of a rapidly growing city, but also defined one crucial aspect of their urban way of life and standard of living.. Data What makes the estimation possible is new datasets based on two different series of archival records, both of which were generated by the municipal government. These sources were produced as a result of one specific condition of urban food provisioning in early America, which was codified by the market laws. In New York City, as in most other American cities, minor exceptions notwithstanding, the City Council limited the retail of the four principal categories of fresh meat—beef, veal, lamb and mutton, and pork—to licensed market butchers at the city’s public markets. The underlying intent of this crucial clause—commonly referred to as the “market monopoly of meat”—was to maintain strict municipal oversight of the most important and perishable component of the urban food supply, chiefly for reasons of public health. Market butchers, in return for their trade privilege, as well as to finance. 1. Some of the most important publications on this subject include: Robert A. Margo and Richard H. Steckel, "The Heights of American Slaves: New Evidence on Slave Nutrition and Health" Social Science History 6, no. 4 (1982): 516-538; John Komlos, "The Height and Weight of West Point Cadets: Dietary Change in Antebellum America" The Journal of Economic History 47, no. 4 (1987): 897-927; John Komlos, "Shrinking in a Growing Economy? The Mystery of Physical Stature during the Industrial Revolution" The Journal of Economic History 58, no. 3 (1998): 779-802; Michael R. Haines, Lee A. Craig, and Thomas Weiss, "The Short and the Dead: Nutrition, Mortality, and the “Antebellum Puzzle” in the United States" The Journal of Economic History 63, no. 2 (2003): 382-413; Michael R. Haines, "Growing Incomes, Shrinking People: Can Economic Development Be Hazardous to Your Health?: Historical Evidence for the United States, England, and the Netherlands in the Nineteenth Century" Social Science History 28, no. 2 (2004): 249270; Michael R. Haines, Craig, Lee A., Weiss,Thomas, "Development, Health, Nutrition, and Mortality: The Case of the 'Antebellum Puzzle' in the United States" National Bureau of Economic Research Historical Working Paper Series no. 130: 249-270; Robert William Fogel, The Escape from Hunger and Premature Death, 1700-2100 (Cambridge: Cambridge University Press, 2004).. 2. Richard Briggs Stott, Workers in the Metropolis: Class, Ethnicity, and Youth in Antebellum New York City (Ithaca: Cornell University Press, 1990), 77.. 1.
(8) Gergely Baics. the upkeep and expansion of the collective infrastructure of food provisioning for a rapidly growing city, paid sales taxes after the different varieties of fresh meat were sold. To estimate the quantity of fresh red meat consumed by New Yorkers in the early 19th century, I have drawn on a hitherto unused set of sources: the monthly returns of the Market Clerks, which recorded the number of animals slaughtered for sale at the city’s public markets. Market Clerks were required to register and collect fees on each and every cow, calf, sheep and hog processed at their respective marketplaces. On a monthly basis, they then submitted these returns to the City Comptroller; a substantial amount of these returns has survived for 1816 and 1818 for the city’s three principal markets of Fly, Washington, and Catharine.3 Additionally, the butcher-turned-historian Thomas F. De Voe’s published works—The Market Book (1862) and The Market Assistant (1867)— along with his manuscript records, contain complementary sheets of these returns for the missing periods.4 Combining these two sources, I have been able to make reliable estimates of the total number of cattle, calves, sheep and hogs slaughtered in New York City in 1816 and 1818.5 In addition to this, the Proceedings of the City Council document the amount of market fees collected from the market butchers between 1790 and 1818. Given that fees were collected in the form of sales taxes on the amount of meat sold, and that the tax rates applied to the different kinds of meats, it is possible to estimate the actual volume of meat sales for most of the years during this period. Overall, combining these two sets of data makes it possible for the first time to measure per capita red meat consumption in a major American city of the early Republic—and not only for one year, but for nearly three decades. One should note that the data have two important limitations. The City Council collected revenue only on the sale of butcher’s meats. All other meats, including poultry, fowl and game, which. 3. For Fly Market, I have compiled monthly returns for 1816 from January to October. For Washington, the 1816 monthly returns miss only November, while there are additional data available for March, October, November and December of 1818, and from between January and April in 1819. Moreover, the Washington Market returns also include daily counts. As for Catharine Market, monthly returns are available from January to October in 1816, and for each month of the year in 1818. For sources: Common Council Microfilm Database, New York City Municipal Archives [CCMD (NYC-MA)]: “Returns of all the Beeves, Calves, Sheep & Hogs in the Different Markets of the City”, Market Committee: 1816, Box 59, Folder 1416; “Returns of all the Butchers in the Different Markets of the City”, Market Committee: 1818, Box 66, Folder 1535; “Returns of all the Beeves, Calves, Sheep & Hogs in the Different Markets of the City”, Market Committee: 1818, Box 66, Folder 1535; “Number of Creatures Sold in Catharine Market”, Market Committee: Stalls & Licenses, July-December 1818, Box 66, Folder 1537; “Returns of all the Beeves, Calves, Sheep & Hogs in the Different Markets of the City”, Market Committee: 1819, Box 72, Folder 1595.. 4. Thomas F. De Voe’s original archives contain aggregated totals for Fly, Catharine and Washington Markets for between May and October of 1816, while his book cites aggregated animal counts for between January and September of 1818 for Fly, Washington, Catharine and the newly opened Centre Markets. In the case of Washington Market, the De Voe data only refer to Washington Market, whereas the original returns also include the smaller Spring and Duane Markets. Thomas F. De Voe, The Market Book: A History of the Public Markets of the City of New York (New York: A. M. Kelley, 1970), 234-235; Thomas F. De Voe, The Market Assistant, Containing a Brief Description of Every Article of Human Food Sold in the Public Markets of the Cities of New York, Boston, Philadelphia, and Brooklyn: Including the Various Domestic and Wild Animals, Poultry, Game, Fish, Vegetables, Fruits, &c., &c., with Many Curious Incidents and Anecdotes (Cambridge: Printed at the Riverside press for the author, 1867); New-York Historical Society, Manuscripts Division [NYHS-MD]: Thomas F. De Voe, “New York City Markets Collection, ca. 1817 - ca. 1878”, Box 2.. 5. As a first step, I used all available data to fill the gaps, and to arrive at complete monthly returns for the three principal markets in 1816 and 1818. The more complete returns for 1816 were used as reference data to make estimates for 1818 when necessary. The second step was to estimate the volume of trade at the missing markets. In 1816, the number of occupied butcher stalls was 63 at Fly Market, 55 at Washington Market, and increased from 24 to 48 over the course of the year at Catharine Market. In comparison, the other markets were much smaller: in 1816, there were twelve stalls at Collect, six at Greenwich, five at Spring, three at Governeur, two at Duane, and one at Corlears-hook Markets, whereas in 1818, there were eight in Essex, six at Greenwich, three each at Grand and Governeur, and one at Corlears-hook Markets. Butcher stalls at these smaller markets represented less than 15% of all occupied stalls in the city in 1816, and only 10% in 1818. To estimate the volume of trade at these markets, I assumed a one-to-one relationship between the number of butcher stalls occupied and the volume of meat sales at a given market. The respective trade at Fly, Washington and Catharine Markets does bear out such a relationship.. 2.
(9) Appetite for Beef. were sold by farmers and hucksters at the city’s markets, as well as processed and preserved meats, such as ham, sausage, lard, salted pork and beef, smoked beef, or corned beef, which were retailed by the city’s grocers, fell outside the remit of municipal taxation. Any attempt to quantify per capita meat consumption level is thus necessarily limited to red meat, leaving a substantial portion of the urban meat supply unaccounted for. How substantial? Reconstructions of John Pintard’s 1811, 1814 and 1827 household budgets are suggestive. They show that Mr. Pintard allocated 55% of his family’s meat expenditure to butcher’s meats, while the rest he divided about equally between cured meats and poultry, fowl and game.6 While Pintard’s upper middle-class family is not to be taken as representative, these ratios point to the prominence of red meat in the New York City diet. One should also note that poultry, fowl and game were comparatively expensive, and thus the meat basket of an average New Yorker probably relied more heavily on red and/or preserved meats. The prominent status of red meat was also culturally determined. City officials were concerned foremost with the supply of red meat, while respectable butchers, representatives of a par excellence urban trading craft, would handle only beef, veal, lamb and mutton, and pork, hence the collective name of butcher’s meats. Even if one would wish to have data concerning all components of the urban meat supply, the exclusive focus on red meat is justified both from a statistical and from a cultural viewpoint. The second major limitation concerns the crucial problem of social inequalities in access to food. After all, aggregate consumption figures expressed in per capita terms are pertinent only in so far as the “average New Yorker” is considered, while they do not address the important issue of unequal meat consumption across households of different social status. How widely and equally the city’s meat supplies were shared by all New Yorkers, and how the structure of inequality with regards to such a crucial consumption good changed over the period, are important questions that are beyond the reach of the data, and call for further research based on different documentation.7. Quantity of the Meat Supply, 1790-1818 Based on the Market Clerk’s monthly returns, complemented by De Voe’s records, my per capita red meat consumption estimates are as follows: in the late 1810s, New Yorkers on average ate between 85.9 to 92.1 pounds of beef, 16.9 to 19.6 pounds of veal, 28.6 to 34.1 pounds of lamb and mutton, and 10.7 to 13.5 pounds of pork—for all categories, the year of 1816 representing the upper, while the year of 1818 the lower bound.8 On the whole then, annual per capita fresh red meat consumption reached 159.3 pounds in 1816 and 142 pounds in 1818. 6. In 1811, John Pintard spent 54.8% of his meat budget on red meat, 30.6% on processed and preserved meat, and 14.5% on poultry, fowl and game. The respective ratios in 1814 were 54, 26.4, and 19.6%, while in 1827, they were 56.9, 12.5, and 30.5%. One should be careful not to over-generalize based on a single case, especially when the sample comes from a high-income food budget. Pintard’s relative expenditures on preserved meat and poultry, fowl and game also changed too much year-by-year to establish any pattern even for this household. Moreover, one cannot convert Pintard’s expenses into actual amounts of meat consumed. Still, the fact that Pintard’s purchases of butcher’s meat hovers around 55% highlights that while red meat was of great importance, it constituted only part of the average New Yorker’s meat basket. NYHS-MD: John Pintard Papers, “Marketing Account Book, 1811-1824”; John Pintard Papers, “Marketing Account Book, 1826-1830”; John Pintard Papers, “Record of Household Expenses, 1826-1828,” Box 9, Folders 1-3.. 7. Such an analysis is confined by the lack of historical sources. Individual household accounts, like that of Mr. Pintard’s, are not only rare, but also are heavily biased to well-off residents, making unfeasible any systematic comparison across households of different income.. 8. According to the 1816 and 1818 dataset, for a population of 93,634 in 1816, there were 19,165 cattle, 24,450 calves, 79,852 sheep, and 9,491 hogs slaughtered for sale at the New York City markets. Two years later, for an estimated population of 107,625, the corresponding figures were 20,535 cattle, 24,190 calves, 76,900 sheep, and 8,645 hogs. To translate these figures into per capita consumption of beef, veal, lamb, and pork, I borrowed the conversion rates used by John Komlos: 450 pounds of dressed weight for Northern cattle, 40 pounds for sheep, and 133 pounds for hogs. Komlos’s slaughter weights have been criticized by Robert E. Gallman for yielding smaller outputs per animals than those of other scholars. This is likely to be the case for pork. I still prefer using Komlos’s ratios for two reasons. First, they make my estimates comparable to those of Komlos and Haines for the mid-19th century, which are based on census figures. Second, by slightly underestimating slaughter weights, my estimates address the concern that there was probably a small increase in the average weights of cattle from between the 1810s until the middle of the 19th century. To establish average slaughter. 3.
(10) Gergely Baics. Two caveats are in order. First, these figures are likely to slightly underestimate per capita butcher’s meat consumption, as they refer to animals officially accounted for and prepared and sold by licensed butchers at the city’s public markets. Given the “market monopoly of meat,” this should have been the whole supply. Yet despite a well-functioning and strictly enforced public market system at the time, there was already evidence of some informal trade. It is also unlikely that Market Clerks managed to count all animals sold by the butchers. Butchers paid taxes after each and every animal was slaughtered, and thus had the incentive not to report all sales. The figures, on the other hand, may also slightly overestimate per capita consumption. By 1810, New York surpassed Philadelphia to become North America’s most populous city and greatest emporium of commerce.9 At any given day, there were many thousands more eating butcher’s meat in New York than there were residents. It is impossible to know which factor was more important, and to what extent the two canceled each other out. But before continuing with the analysis: are these figures realistic for the North American context? Roger Horowitz offers precise estimates of urban meat consumption levels for the 20th century. In 1909, per capita meat consumption ranged from an average of 136.1 pounds for lowerincome families, to 163.7 pounds for middle, and to 201.6 pounds for higher-income families. By 1942, the Depression pushed total meat consumption for the respective income groups down to 107.5, 143.6, and 166.1 pounds. Yet by 1965, per capita meat consumption reached record levels with figures as high as 205.2 pounds for lower, 219.4 pounds for middle, and 230.2 pounds for higher income families.10 In addition, the U.S. Department of Commerce estimated that on average Americans ate 81.5 pounds of beef in 1909, dropping to 69.4 pounds by 1942, and reaching a staggering 104.7 pounds by 1965.11 In comparison, the market data indicate very high, but by no means unrealistic levels of meat consumption for the late 1810s. Considering that the 1816 and 1818 market data do not include most of preserved meats and all of poultry, fowl and game, it is safe to suggest that New Yorkers in 1816 and 1818 ate about as much meat as did families in the highest income group in 1906, and only a little less than the average American city dweller in the record year of 1965. Moreover, an average New Yorker in the late 1810s consumed about 10% more beef than an average American in 1909, and only about 15% less than an average American in 1965. The years 1816 and 1818, however, are only two cases in point. They are also too close to each other to suggest any trend, and while unlikely, it is possible that they refer to exceptional years, which might explain the high consumption figures. Further evidence is needed to expand the chronology and thus solidify the consumption estimates. For each year between 1790 and 1800, and for some of the years between 1801 and 1816, the Proceedings of the Common Council report the fees. (Contd.) weights for calves is more problematic, given that the animal’s weight varies greatly with slaughtering age. For lack of better data, I use the tax ratio paid by the butchers: 24 cents per cow, versus 4 cents per calf. The average dressed weight of a calf is thus 75 pounds. Komlos, "The Height and Weight of West Point Cadets: Dietary Change in Antebellum America": 897-927; John Komlos, "Anomalies in Economic History: Toward a Resolution of The "Antebellum Puzzle"" The Journal of Economic History 56, no. 1 (1996): 202-214; Robert E. Gallman, "Dietary Change in Antebellum America" The Journal of Economic History 56, no. 1 (1996): 198. 9. During the two decades between 1790 and 1810, New York City’s population almost tripled, growing from 33,121 to 96,373, whereas Philadelphia’s “only” doubled, from 42,520 to 91,874 residents. Ira Rosenwaike, Population History of New York City (Syracuse: Syracuse University Press, 1972), 16.. 10. The annual family income gradients used by Horowitz are as follows: the lower third represents families making under $1,000 in 1909, under $1,500 in 1942, and under $3,000 in 1965; the middle tier refers to families earning between $1,000-2,000 (1909), $1,500-3,000 (1942), and $3,000-6,000 (1965); while the highest income tier is defined as families with incomes over $2,000 (1909), $3,000 (1942), and between $6,000 -15,000 (1965). The 1965 study also included a fourth, even higher income group, which was not present in the earlier surveys. To avoid skewing comparisons, Horowitz separated out this group from the study. Roger Horowitz, Putting Meat on the American Table: Taste, Technology, Transformation (Baltimore: Johns Hopkins University Press, 2006), 11-17.. 11. As for pork, the figures were 67 pounds in 1909, 63.7 pounds in 1942, and 58.7 pounds in 1965. The gradual decline of pork consumption was compensated by Americans’ growing appetite for poultry of which they ate 14.7 pounds in 1909, 20.7 pounds in 1942, and 40.9 pounds in 1965. Ibid., 6.. 4.
(11) Appetite for Beef. Market Clerks collected on the total amount of meat sold.12 Given that the respective fees for the four kinds of butcher’s meats—beef, veal, lamb and mutton, and pork—remained largely unchanged, and that the market laws limited the sale of fresh meat to the public markets, the market fees reflect relative levels of meat consumption over the period.13 Figure 1 compares the increase of New York City’s population to that of the market fees collected on the sales of fresh butcher’s meats—beef, veal, lamb and mutton, and pork—from between 1790 and 1818.14 Population figures are divided by ten to be on the same scale as the market fees. The figure clearly shows how market fees grew at about the same rate as did the city’s population between 1790 and 1807. For the subsequent decade, the data are more sporadic, and the interpretation is more difficult. Yet it is evident that the war of 1812 caused a temporary collapse in meat sales in 1813—and probably in 1814—, after which market fees rebounded to the same level vis-à-vis the population as before. De Voe himself noted that the prices of provisions became very high at the commencement of the war, and continued so for five or six years, resulting in notable scarcities in. 12. New York (N.Y.). Common Council, Minutes of the Common Council of the City of New York, 1784-1831 (New York: M. B. Brown Printing & Binding Co., 1917); David Maydole Matteson and New York (N.Y.). Common Council, Minutes of the Common Council of the City of New York, 1784-1831: Analytical Index (New York: M. B. Brown Printing & Binding Co., 1930); New York (N. Y.), Annual Report of the Comptroller of the City and County of New York, Exhibiting the Revenues and Expenditures of Said City and County. Also, the Loans, Receipts and Disbursements upon the Various Trust and Special Accounts, for and during the Fiscal Year Ending December 31st, 1858 (New York: 1859), 46-61.. 13. In 1790, the city decided on the following method of collecting fees: the Council charged two shillings for every cow, four pence for every calf and sheep, and six pence for every hog brought to market. Subsequent market laws, such as the one from 1793, upheld the same rules of taxation. The 1812 and 1814 market laws also use the same rates, but in dollarcents: 24 cents for each cattle, 4 cents for each calf and sheep, and six cents for each hog. For converting pennies to cents, I used the same ratio as did the City Council documents: 0.96 penny to a cent. By 1812 and 1814, there were special cases that slightly complicated this method of taxation. For example, the 1814 market law suggests that some of the butchers may have held licenses that exempted them from fees for certain items. Farmers, bringing their own animals to market, paid the exact same rates as did the butchers, and so did the city’s few licensed butchers who retailed from street stalls. However, those who resold items at the market with the Clerk’s permission had to pay three times as high fees, while those who violated the market laws paid high fines. On the whole, these were minor exceptions. The basic rule remained the same over the entire period: market fees were collected based on the animals slaughtered for sale at the city’s markets. For sources: Common Council, Minutes of the Common Council of the City of New York, 1784-1831, Vol 1: 534; New York (N. Y.), Laws and Ordinances Ordained and Established by the Mayor, Aldermen and Commonalty of the City of New-York (New York: Hugh Gaine, 1793), 6-10; New York (N. Y.), Laws and Ordinances Ordained and Established by the Mayor, Aldermen and Commonalty of the City of New-York (New York: Pelsue and Gould, 1812), 154-164; New York (N.Y.), A Law to Regulate the Public Markets (New-York: J. Hardcastle, 1815).. 14. For the period between 1790 and 1800, the Proceedings of the City Council report the total amount of market fees collected for each year. After 1800, the records are more sporadic, and require small corrections in order to arrive at annual fees. For 1801 and 1802, the records combine fees for two years, which I have separated out. For 1804, 1805 and 1806, the records refer to a full year, however, beginning in November 1 of the previous year. In these cases, I have not made adjustments, and thus the figures refer not to the calendar but to the fiscal year. In addition, for 1804, only the amount kept by the treasurer was given, which was 50%, while the other half went to the Mayor’s coffers. For 1807, the recorded fee refers to fourteen months, also including November and December of 1806. In this case, I have relied on the 1816 data to estimate the percentage of fees collected in these extra months, which I have subtracted to calculate the annual total. For 1813, the recorded fee is again the annual total for the calendar year. Another complication is that for some years, the full amounts of fees are given, while at other times, the records provide the net amounts, which do not include expenses on sweeping and the Market Clerk’s salary. Knowing fairly precisely how much money was spent on sweeping, and given that the Market Clerk kept about 10% of the fees, I have estimated the full amount for each year when only the net fee was available. This is because the full amount is a function of the number of animals slaughtered. As for 1816 and 1818, I have used the original Market Clerks’ returns complemented with De Voe’s records to estimate the total amount of fees collected. Incomplete market data from the Council proceedings for these two years confirm that the conversion method based on the Market Clerks’ returns of the animals slaughtered and the respective taxes paid on them produce reliable results.. Finally, I have used all available census records for New York City—1790, 1800, 1805, 1810, 1814, 1816, and 1820—to arrive at yearly population figures for the period, assuming a constant rate of population change between the two closest known observations. Rosenwaike, Population History of New York City, 18.. 5.
(12) Gergely Baics. supplies.15 Yet exorbitant prices were only part of the story, as meat sales swiftly recovered by 1816, despite prices remaining high. The war not only disrupted the city’s connections to its hinterlands, causing shortages in meat supplies, but also interrupted the day-to-day functioning of the city’s vital institutions, including its infrastructure of provisioning. 16 It took some time for the markets to fully recover, and for the city’s butchers to resume business. Although the war of 1812 presented the sharpest setback, food consumption levels were not immune to other external shocks. After five years of steady growth, market fees remained flat from 1794 to 1795, when yellow fever hit New York for the first time, claiming the lives of 1.6% of the city’s population. Three years later, in 1798, market fees dropped by a shocking 14.2% compared to the year before, as the most devastating yellow fever wiped out nearly 4% of the city’s population, and sent thousands into the countryside.17 For the epidemic of 1803, there are no corresponding market data, while in 1805 market fees continued to rise despite a milder yellow fever outbreak.18 The drop from 1806 to 1807, however, is more noteworthy, as it corresponds to the 1807 Embargo Act. New York City’s meat supplies derived from regional sources, and thus the embargo did not directly hurt the meat trade. But for a commercial city, the interruption of foreign trade presented a severe economic setback, which in turn, manifested in a 4.2% decline in the volume of meat sales.19. Despite setbacks caused by epidemics, the embargo of 1807, or the war of 1812, the market fee data provide strong evidence for the steady growth of the city’s meat supplies between 1790 and 15. De Voe, The Market Book: A History of the Public Markets of the City of New York, 410.. 16. For a brief account of the war years in New York: Edwin G. Burrows and Mike Wallace, Gotham: A History of New York City to 1898 (New York: Oxford University Press, 1999), 425-428.. 17. The 1798 yellow fever epidemic severely disrupted New York City’s economic life. The city’s system of provisioning virtually collapsed. Feeding the poor became the major concern of the Common Council’s Health Committee. Three provision centres were established. At the peak of the epidemic, between 1,600 to 2,000 people were fed daily at these centres. In addition, 800 more were provisioned through the Almshouse, and 500 families were permitted to obtain free rations at temporary stores. For a detailed account of this and the other yellow fever epidemics in New York: John Duffy, A History of Public Health in New York City (New York: Russell Sage Foundation, 1968), 105-109, 101-123.. 18. Market fees remained virtually unchanged between 1794 ($4,659.84) and 1795 ($4,669.01), whereas they dropped dramatically from $5,112.92 in 1797 to $4,384.66 in 1798. According to Rosenwaike, in 1795, 732 people died of yellow fever. In comparison, the 1798 fever was much more devastating, resulting in the deaths of 1,524 people in New York City alone. If those who contracted the illness in New York but died outside the city are also included, the figures are well above 2,000. The 1805 fever was much milder, claiming “only” 262 lives. Rosenwaike, Population History of New York City, 16-19.. 19. The embargo caused severe hardships to New York’s economy. For example, between 1807 and 1809, municipal expenditures on relief increased by about 70%. Burrows and Wallace, Gotham: A History of New York City to 1898, 412.. 6.
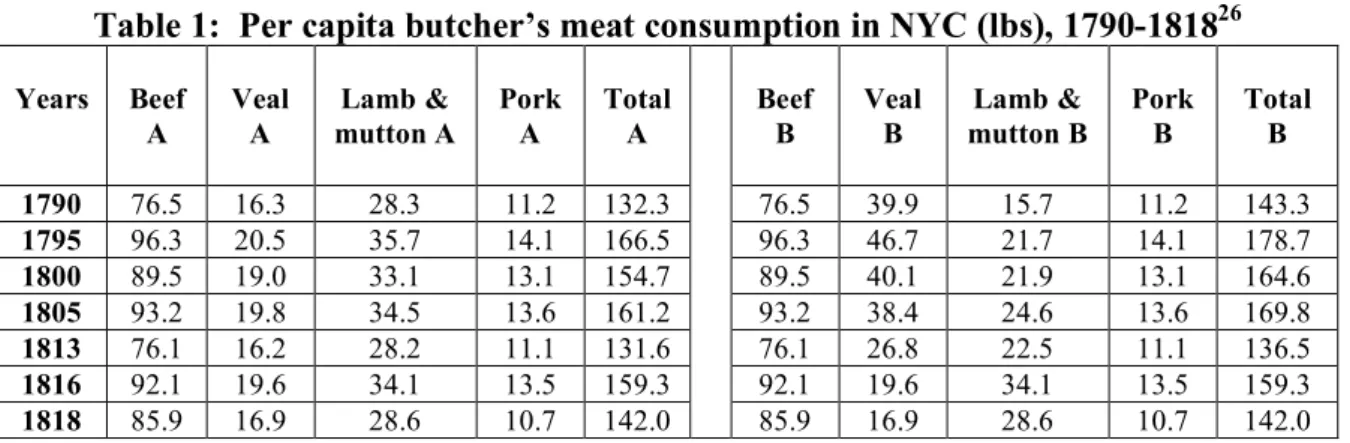
(13) Appetite for Beef. 1818. The consistency of the series is confirmed by its responsiveness to external shocks. Moreover, fees calculated from the original market returns of 1816 and 1818—which were based on animal counts—, fit remarkably well into the dataset. Earlier, I used the original market returns to calculate per capita meat consumption levels for 1816 and 1818. Given the reliability of the market fee data, it makes sense to convert fees into meat consumption figures for the two-and-a-half decades prior to 1816. For such a conversion, one ideally needs to know the relative importance of the four kinds of butcher’s meat throughout the period. Lacking such data, the estimation has to presume that the 1816 ratios between the sales of beef, veal, lamb and mutton, and fresh pork reflected more or less stable consumption patterns. This is a reasonable, but not unproblematic assumption. Billy Smith’s reconstruction of a Philadelphia labourer’s diet in 1772 offers one point of reference.20 When comparing Smith’s 1772 Philadelphia data to my own 1816 and 1818 New York City estimates, virtually no difference is found in the relative weight of fresh beef and pork in the red meat basket. In contrast, the data suggest a declining trend in the consumption of veal, offset by rising consumption rates for lamb.21 Direct household data based on two New York household accounts (those of Evert Bancker Jr.’s from 1787, and John Pintard’s accounts from 1811 and 1827, used earlier in this paper), however, do not confirm these trends. If anything, they point to rising veal and declining lamb consumption between 1787 and 1827.22 Similarly, archaeological studies of animal bones in Manhattan indicate an overall decline in the consumption of lamb from the early 18th to the mid-19th century.23 Of course, these diverging trends may simply reflect class differentials in food consumption patterns, after all compared to a Philadelphia labourer, the Banckers and the Pintards were well-off New York City families. Another possibility could be that the meat supply of these two cities differed in certain aspects. In short, the data are contradictory, which is hardly surprising given their sporadic nature. It is not clear whether to assume constant conversion rates based on the 1816 market returns, or to make certain adjustments for veal and lamb by matching Smith’s 1772 data to my own estimates for 1816. To allow for comparisons, I made calculations based on both methods.24 Table 1 summarizes estimated per capita meat consumption rates for New York City between 1790 and 1818. In series A columns, I present estimates based on the 1816 ratios, while in series B columns, I offer comparable figures assuming variable ratios for veal and lamb. Even if the data are far from perfect, they provide new insights into urban meat consumption levels for an undocumented period. Looking at columns A, the figures suggest that per capita consumption of fresh red meat increased from 132.3 pounds in 1790 to rates as high as 154.7 to 166.5 pounds between 1795 and 1816—excluding the war year of 1813, when it dropped back to 131.6 pounds. The corresponding. 20. Billy G. Smith, "The Material Lives of Laboring Philadelphians, 1750 to 1800" The William and Mary Quarterly 38, no. 2 (1981): 167-171.. 21. In 1772, 57% of an “average” Philadelphia labourer’s supply of butcher’s meat came from beef, 27% from veal, 10% from lamb, and 5% from pork. The same per capita ratios in New York City in 1816 were 58% for beef, 12% for veal, 21% for lamb, and 8% for pork, while in 1818 they were 60, 12, 20, and 8% respectively. The data suggest that whereas the ratios of fresh beef and pork in the red meat basket remained constant between 1772 and 1818, a notable decline occurred in the consumption of veal, which was offset by a comparable rise in the consumption of lamb.. 22. In 1787, about 19% of the Bancker household’s meat budget was spent on veal, and about 25% on lamb and mutton. Pintard in 1811 spent about 31% of his meat expenditure on veal, and 10% on lamb, whereas in 1827, the same figures for his household were 25 and 18% respectively. It is, of course, problematic to compare two different households across four decades. Yet it is still noteworthy that the data do not corroborate a trend of declining veal and increasing lamb consumption over the period. If anything, they seem to point in the opposite direction. NYHS-MD: Evert Bancker, Jr., “Household Account Book of Evert Bancker, Jr., 1772-1776”; Evert Bancker, Jr., “List of Proprietors, Account and Survey Book, 1784-88;” John Pintard Papers, “Marketing Account Book, 1811-1824”; John Pintard Papers, “Marketing Account Book, 1826-1830”; John Pintard Papers, “Record of Household Expenses, 1826-1828,” Box 9, Folders 1-3.. 23. Nan A. Rothschild, New York City Neighborhoods: The 18th Century (Cllinton Corners: Percheron Press, 2008), 146-149.. 24. For estimating the changing ratios of fresh veal and lamb consumption between 1790 and 1816, I assumed a linear progression between Smith’s 1772 ratios and my own 1816 estimates. Lacking more observations, such a simple method of calculation is justifiable.. 7.
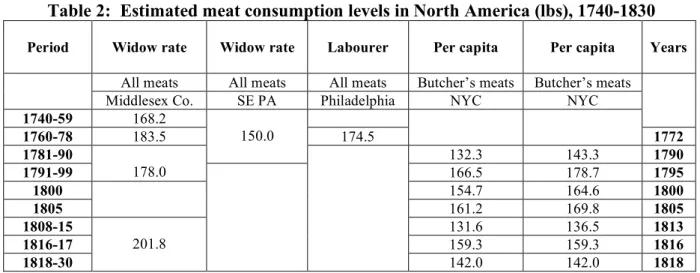
(14) Gergely Baics. rates of beef consumption rose from 76.5 pounds in 1790 to 89.5 to 96.3 pounds between 1795 and 1816. When looking at columns B, the estimated levels of meat consumption are consistently higher, suggesting an increase from 143.3 pounds in 1790 to between 159.3 and 178.7 pounds between 1795 and 1816. Importantly, the 1818 figures indicate a sharp decline in per capita red meat consumption compared to two years earlier from 159.3 pounds to 142 pounds. No external shock explains this drop, but there is good evidence that the 1818 data are likely to underestimate the overall number of animals butchered in New York, in which case the 1818 rates were probably much closer to those of 1816 than the figures would suggest.25. Table 1: Per capita butcher’s meat consumption in NYC (lbs), 1790-181826 Years. Beef A. Veal A. Lamb & mutton A. Pork A. Total A. Beef B. Veal B. Lamb & mutton B. Pork B. Total B. 1790 1795 1800 1805 1813 1816 1818. 76.5 96.3 89.5 93.2 76.1 92.1 85.9. 16.3 20.5 19.0 19.8 16.2 19.6 16.9. 28.3 35.7 33.1 34.5 28.2 34.1 28.6. 11.2 14.1 13.1 13.6 11.1 13.5 10.7. 132.3 166.5 154.7 161.2 131.6 159.3 142.0. 76.5 96.3 89.5 93.2 76.1 92.1 85.9. 39.9 46.7 40.1 38.4 26.8 19.6 16.9. 15.7 21.7 21.9 24.6 22.5 34.1 28.6. 11.2 14.1 13.1 13.6 11.1 13.5 10.7. 143.3 178.7 164.6 169.8 136.5 159.3 142.0. The data confirm the earlier tentative claim based on 20th century comparisons that New Yorkers were well-supplied with fresh meat in general and beef in particular. It also extends the chronology backward, allowing for further comparisons from similar observations across the period. Table 2 presents comparative data concerning average meat consumption levels in the Northeastern region during the latter half of the 18th and early 19th centuries. The best estimates for the Colonial and early Republican periods come from Sarah F. McMahon’s meticulous studies of a large sample of wills from rural Middlesex County in Massachusetts.27 She shows that the yearly meat allowance of widows grew gradually from 120.8 pounds in the early 18th century, to 168.2 pounds by the mid-century, to 183.5 pounds by the Revolutionary era, then it slightly decreased to 178 pounds during the last two decades of the century, to reach an impressive 201.8 pounds by the first quarter of the 19th century.28 James T. Lemon’s calculations based on similar sources from Southeastern. 25. By 1818, the volume of meat sales outside the market system most likely increased. In 1817, the City Council ended its previous practice of licensing case-by-case street stalls and meat shops, and pushed those who retailed outside the market system to the sparsely populated northern districts—north of First Street, east of the Bowery, and north of Thirteenth Street, west of Broadway. Some of these butchers relocated to the northern fringes of the city, where the collection of fees was more difficult. Others probably continued their business at the same location—informally. In either case, in 1818 the Market Clerks must have missed accounting for more animals than two years earlier. At the same time, the Council decided to replace Fly Market, the largest in the city, with the modern Fulton Market. Stall counts suggest that butchers started to abandon Fly Market as early as 1818. Given that Fly conducted the largest volume of trade in the city, its gradual demise must have resulted in additional informal sales, in turn, leaving more animals unaccounted for. This explanation is also supported by the fact that the decrease resulted less from lower sales of beef, than from declining sales of “small meats”—veal, and especially lamb and pork. Violations occurred more frequently in these categories.. 26. For converting animals into pounds of meat, I have again relied on Komlos’s slaughter weights. One problem is that over these two-and-a-half decades, slaughter weights may have slightly increased. Yet such changes must have remained small enough not to have a major impact on my estimates. If such a problem exists, it should produce slightly overestimated figures for the earlier years compared to the 1816 and 1818 market returns. For calculating the city’s population size in 1795, 1813 and 1818, I have relied on the nearest previous and subsequent census figures, and assumed a constant rate of population growth. Rosenwaike, Population History of New York City, 18.. 27. Sarah F. McMahon, "A Comfortable Subsistence: The Changing Composition of Diet in Rural New England, 1620-1840" The William and Mary Quarterly 42, no. 1 (1985): 26-65; Sarah F. McMahon, ""All Things in Their Proper Season": Seasonal Rhythms of Diet in Nineteenth Century New England" Agricultural History 63, no. 2 (1989): 130-151.. 28. McMahon, "A Comfortable Subsistence: The Changing Composition of Diet in Rural New England, 1620-1840": 36-37.. 8.
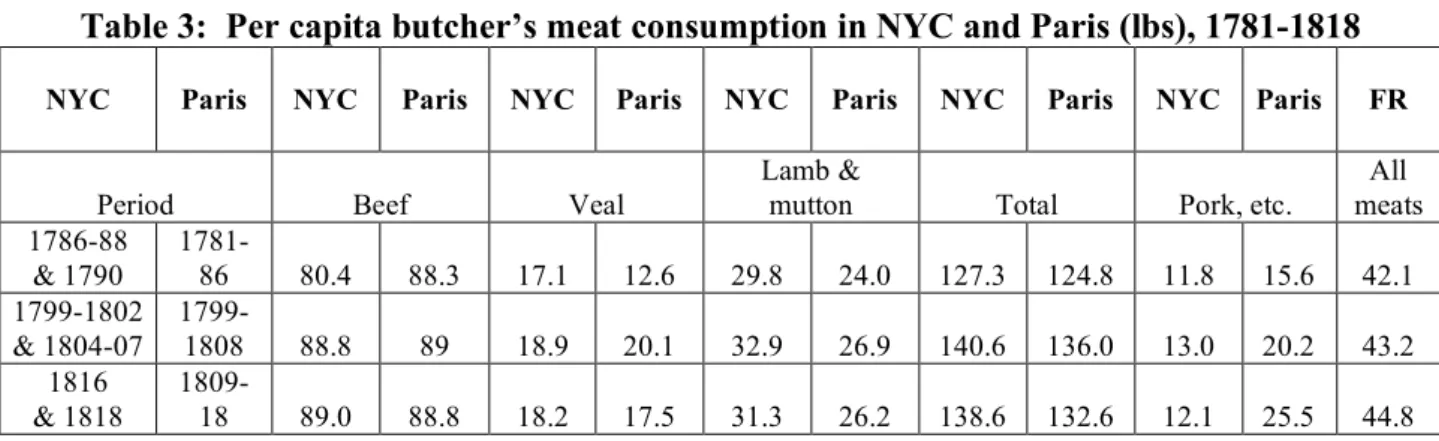
(15) Appetite for Beef. Pennsylvania arrive at a lower figure of 150 pounds of meat for the second half of the 18th century. 29 The difference most probably reflects regional variations in widow rates. In addition, Billy Smith’s attempt to reconstruct a Philadelphia labourer’s diet for 1772 produces an overall meat consumption level of 174.5 pounds.30 This figure appears low compared to McMahon’s 183.5 pounds of widow rate if one considers the much greater calorie needs of an average urban labourer than a rural widow.. Table 2: Estimated meat consumption levels in North America (lbs), 1740-1830 Period. 1740-59 1760-78 1781-90 1791-99 1800 1805 1808-15 1816-17 1818-30. Widow rate. Widow rate. Labourer. Per capita. Per capita. All meats Middlesex Co. 168.2 183.5. All meats SE PA. All meats Philadelphia. Butcher’s meats NYC. Butcher’s meats NYC. 150.0. 174.5 132.3 166.5 154.7 161.2 131.6 159.3 142.0. 143.3 178.7 164.6 169.8 136.5 159.3 142.0. 178.0. 201.8. Years. 1772 1790 1795 1800 1805 1813 1816 1818. Even if widow rates are not the same as average per capita consumption, they provide a good idea of societal expectations of what constituted a reasonable supply of meat at any given time.31 And the New York City average of about 160.4—or 168.1—pounds of fresh butcher’s meat between 1795 and 1816—excluding the war year of 1813, and the probably underestimated figure for 1818— compares well with McMahon’s estimate of between 178 and 201.8 pounds of meat allowance for the late 18th and early 19th centuries. It is in fact surprising that the New York City figures are only slightly lower, given that, as I earlier noted, they exclude preserved meats (ham, sausage, lard, salted pork and beef, smoked beef, or corned beef) as well as poultry, fowl and game. If, on average, New Yorkers ate about 160 pounds of fresh red meat, there had to be plenty more on their dinner table once these categories are also accounted for, adding up to a total per capita meat consumption level well above McMahon’s rural averages.32 Moreover, the data also underline one profound difference between urban and rural diets. Horowitz notes that the consumption of fresh meat, beef in particular, was an urban privilege.33 Indeed, whereas almost all of McMahon’s estimates derive from preserved meats, New Yorkers first and foremost ate fresh red meat. Nearly half of their entire meat supply came from fresh beef. Only in cities was demand sufficient and constant enough to maintain big supplies of slaughtered and retailed beef for immediate consumption. One also wonders how meat consumption in New York compared to those of other rapidly growing cities outside the United States. Thanks to its highly centralized and closely monitored public abattoir system, data concerning the number of animals slaughtered for sale in Paris are exceptionally good. Table 3 compares my per capita estimates for New York to more systematic evidence presented. 29. James T. Lemon, "Household Consumption in Eighteenth-Century America and Its Relationship to Production and Trade: The Situation among Farmers in Southeastern Pennsylvania" Agricultural History 41, no. 1 (1967): 62; David Klingaman, "Food Surpluses and Deficits in the American Colonies, 1768-1772" The Journal of Economic History 31, no. 3 (1971): 559-560, footnote 17.. 30. Smith, "The Material Lives of Laboring Philadelphians, 1750 to 1800": 170.. 31. Horowitz, Putting Meat on the American Table: Taste, Technology, Transformation, 12.. 32. See footnote 6 for an analysis of John Pintard’s meat expenditures in 1811, 1814 and 1817.. 33. Horowitz, Putting Meat on the American Table: Taste, Technology, Transformation, 18-19.. 9.
(16) Gergely Baics. by Armand Husson in his Les consommations de Paris (1875).34 Accordingly, during the late 18th and early 19th centuries, the per capita annual consumption of beef, veal, lamb and mutton were strikingly similar in the two metropolises—pork is treated as a separate category, as in Paris, it also included cured meats (charcuterie). Interestingly enough, not only the total amount of red meats consumed, but also their distribution in the diet was very similar. At first reading then, the data raise doubts about the conventional wisdom that 19th century Americans ate far more meat, in particular beef, than West Europeans.. Table 3: Per capita butcher’s meat consumption in NYC and Paris (lbs), 1781-1818 NYC. Paris. Period 1786-88 1781& 1790 86 1799-1802 1799& 1804-07 1808 1816 1809& 1818 18. NYC. Paris. Beef. NYC. Paris. NYC. Paris. Lamb & mutton. Veal. NYC. Paris. Total. NYC. Paris. Pork, etc.. FR All meats. 80.4. 88.3. 17.1. 12.6. 29.8. 24.0. 127.3. 124.8. 11.8. 15.6. 42.1. 88.8. 89. 18.9. 20.1. 32.9. 26.9. 140.6. 136.0. 13.0. 20.2. 43.2. 89.0. 88.8. 18.2. 17.5. 31.3. 26.2. 138.6. 132.6. 12.1. 25.5. 44.8. A few qualifying remarks are in order. First, even if Parisian meat consumption rates were remarkably close to those of New York, the discrepancy between urban and rural diets was far greater in France than in the United States. Whereas Parisians ate three to four times as much meat as the average French citizen, rural New England widow rates, for example, were not all that different—at least in so far as quantity was concerned—from meat consumption levels in New York. Explaining the comparatively smaller inequality between urban and rural diets in North America presents an intriguing puzzle for further research. Besides, Parisian meat consumption appears unusually high by European standards. Even as systematic data for London are lacking, according to John Ramsay McCulloch’s calculations, in 1837, per capita meat consumption—exclusive of bacon, hams, salted provisions and poultry—reached 107 pounds.35 The London figure thus was about two-thirds that of early 19th century New York, albeit one should add that 1837 was the first year of a long recessionary cycle. Similarly, in the case of Berlin, the 1845 figure—including all red meats—was 104.7 pounds, while between 1854 and 1861, it stood at about 95.9 pounds, that is at much lower levels than in early 19th century New York. 36 Obviously, these comparisons are only for orientation. To situate New York City more firmly within a web of trans-Atlantic comparisons, better and broader data are needed, while differences in urban and rural diets also have to be accounted for. All in all, it is safe to conclude that New Yorkers, from the mid-1790s until the late 1810s, ate remarkably well for their own time, as well as in comparison to later periods. They ate about as much meat as did better off urban Americans in 1909, and only a little less—if at all—than the average urban American in the record year of 1965. More precisely, they consumed about 14% more beef than the average American in 1909, and about 11% less than the average American in 1965. The data also complement McMahon’s claim of progressively rising meat consumption levels from the 18th through to the early 19th century. Compared to McMahon’s estimate of a 10% increase from the Revolutionary 34. For data on Paris: Armand Husson, Les consommations de Paris (Paris: Hachette et cie, 1875), 142, 145, 148, 153-154, 157, 196; Ingeborg-Dorothee Brantz, "Slaughter in the City: The Establishment of Public Abattoirs in Paris and Berlin, 1780-1914" (Ph.D. dissertation, The University of Chicago, 2003), 127-138.. 35. Simon Gabriel Hanson, Argentine Meat and the British Market: Chapters in the History of the Argentine Meat Industry (Stanford: Stanford University Press, 1938), 22-23, footnotes 12, 16. Also: Peter J. Atkins, “A Tale of Two Cities: A Comparison of Food Supply in London and Paris in the 1850s” in Food and the City in Europe since 1800, ed Peter J. Atkins, Peter Lummel, and Derek J. Oddy (Ashgate Publishing Co., 2007), 34-36.. 36. Brantz, "Slaughter in the City: The Establishment of Public Abattoirs in Paris and Berlin, 1780-1914", 295.. 10.
(17) Appetite for Beef. period to the early 19th century, the market fees suggest a more robust 19% increase between 1790 and the period between 1795 and 1818.37 The remarkable stability of the consumption rates between 1795 and 1816 provides strong evidence that after the Revolution, meat consumption gradually reached a very high equilibrium. Moreover, the data show that urban meat consumption levels, at least in the case of New York, were considerably higher than rural averages. In short, New Yorkers not only had the privilege of eating fresh meat, in particular beef, all year around, they also ate more of it than their rural counterparts who fed them.. Conclusions The above case-study of America’s first metropolis presents two important conclusions concerning urban meat consumption during the early Republican era. First, the original Market Clerk returns and the market fee data offer hitherto unavailable and robust evidence that New Yorkers were remarkably well supplied with meat between 1790 and 1818. By the mid-1790s, per capita meat consumption in New York reached an equilibrium that exceeded not only contemporary standards—both in comparison to the countryside and to major European cities—, but also compared favourably to the highest recorded figures in American history in the 20th century. Moreover, city dwellers ate first and foremost fresh meat, beef in particular, which set them apart from their rural counterparts, and defined an important aspect of the urban living standard. Sustaining such a carnivorous diet was no small achievement, considering that between 1790 and 1820 the city’s population increased from slightly below 33,000 to a little over 120,000 residents. Supporting this rapid rate of urban growth, New York turned to ever expanding hinterlands. The city’s growing appetite was satisfied not by administrative means, but by purchasing food on agricultural markets from farmers, who produced surpluses for profit. Still, it would be mistaken to assume that in so far as adequate quantities of livestock were driven to the city, residents were by definition well-supplied with meat. Importantly, the Common Council allocated adequate resources to maintain and expand the public market system, which served as the core infrastructure of urban provisioning.38 In short, both sides of the coin—the hinterlands and the urban distribution of food supplies—were crucial in ensuring that New York could accommodate tens of thousands of newcomers at a sustained high rate of meat consumption. This symbolically central aspect of the urban living standard was not jeopardized by rapid urbanization, even as the process made urbanites increasingly dependent on the countryside for food. Moreover, while the decline in meat consumption between the mid-1830s through to the 1860s may represent an important negative trend, as the literature on the Antebellum-puzzle posits, this shift should be placed in the context of the historically high equilibrium of urban meat consumption that characterized early Republican urbanization. Of course, the balance was not entirely positive. The second conclusion of the analysis concerns the remarkable sensitivity of the urban food supplies to a variety of external shocks. For instance, the 1798 yellow fever epidemic resulted in dramatic collapses in meat consumption levels. Sorting out cause and effect in this and similar cases is a hopeless exercise. Food consumption may have dropped as thousands escaped the city, while an epidemic could also have caused severe interruptions in the city’s supply chains, or disrupted the normal functioning of the urban infrastructure of provisioning. City dwellers also disproportionately suffered at times of political crises. The embargo of 1807, and especially the war of 1812, caused major setbacks in the supply of meat and other provisions. Urban dwellers, who did not grow their own food but relied on provisions 37. This claim is further corroborated by Smith’s estimate of 174.5 pounds of meat consumed by a Philadelphia labourer in 1772. It is, of course, problematic to compare a labourer’s diet to per capita meat consumption rates. After all, a physical labourer needed more than average amounts of protein, which he may not have been able to afford. Yet the fact that only a few decades later, New Yorkers ate nearly as much fresh meat per capita as was the meat allowance of an adult male Philadelphia labourer, suggests that overall meat consumption probably increased during the period. The other possibility is that New Yorkers already ate more meat in 1772 than Philadelphians. Unfortunately no data are available for before 1790 to illuminate these trends.. 38. For a detailed discussion of the political economy, spatial organization, and the expansion of the municipal market system: Gergely Baics “Feeding Gotham: A Social History of Urban Provisioning, 1780-1860” (Ph.D. dissertation, Northwestern University, 2009).. 11.
(18) Gergely Baics. from the hinterlands, faced greater scarcities than rural residents. In so far as the right to eat fresh meat each day, and all year around was an urban privilege, the price to be paid for this comparatively higher standard of living was the precariousness of the urban diet at times of extraordinary hardship.. Gergely Baics Max Weber Fellow, 2009-2010. 12.
(19)
(20)
Figura
Documenti correlati
In other words, in early emblematics readers could take it for granted that the meanings of an emblem were potentially infinite, and that the writer’s acts of
[r]
di avvio anche nel caso di procedimenti vincolati, sulla scorta del fatto che, essendo l'atto amministrativo pur sempre una manifestazione di potere del soggetto pubblico, sara pur
One of the many peculiarities of healthcare is that decision support systems need to be integrated with several heterogeneous systems supporting both collaborative work and
This work (VIOLIN project, supported by AGER foundation) focused on the evaluation of the possibility to consider inorganic content and/or the redox profile as possible markers
All codes have been written in the C language in conjunction with the OpenMPI message passing li- brary (version 1.4.2). The local minimization has been carried out by a code,
Colei che per prima si rende conto di come l’istituzione della schiavitù violi apertamente il diritto naturale è Zoraïde, l’indiscussa protagonista della vicenda, la quale
In order to provide spectral information from SWIFT, we used the values of gamma obtained from fitting the absorbed power-law model in the energy range of 0.3–10 keV, given in the
