Full Terms & Conditions of access and use can be found at
https://www.tandfonline.com/action/journalInformation?journalCode=tjas20
Italian Journal of Animal Science
ISSN: (Print) 1828-051X (Online) Journal homepage: https://www.tandfonline.com/loi/tjas20
Isolation and Characterisation of a Dinucleotide
Microsatellite Set for a Parentage and Biodiversity
Study in Domestic Guinea Pig (Cavia Porcellus)
Diana Aviles, Vincenzo Landi, Juan Vicente Delgado, José Luis Vega-Pla &
Amparo Martinez
To cite this article:
Diana Aviles, Vincenzo Landi, Juan Vicente Delgado, José Luis Vega-Pla
& Amparo Martinez (2015) Isolation and Characterisation of a Dinucleotide Microsatellite Set for
a Parentage and Biodiversity Study in Domestic Guinea Pig (Cavia�Porcellus), Italian Journal of
Animal Science, 14:4, 3960, DOI: 10.4081/ijas.2015.3960
To link to this article: https://doi.org/10.4081/ijas.2015.3960
© Copyright D. Aviles et al.
Published online: 14 Mar 2016.
Submit your article to this journal
Article views: 609
View related articles
Isolation and
characterisa-tion of a dinucleotide
microsatellite set for a
parentage and biodiversity
study in domestic guinea pig
(Cavia porcellus)
Diana Aviles,1,2
Vincenzo Landi,2,3
Juan Vicente Delgado,3José Luis Vega-Pla,4
Amparo Martinez2,3
1Technical University of Ambato,
Ecuador; 2
Departamento de Genética, University of Córdoba, Spain; 3
Animal Breeding Consulting, Córdoba, Spain;
4
Laboratorio de Investigación Aplicada, Ministerio de Defensa, Córdoba, Spain
Abstract
The domestic guinea pig is a valuable genet-ic resource because it is part of local folklore and food tradition in many South American countries. The economic importance of the guinea pig is due to its high feed efficiency and the quality of animal protein produced. For these reasons, our study is aimed to design a complete dinucleotide microsatellite marker set following international recommendation to assess the genetic diversity and genealogy management of guinea pigs. We selected a total of 20 microsatellites, looking for laborato-ry efficiency and good statistical parameters. The set was tested in 100 unrelated individuals of guinea pigs from Ecuador, Peru, Colombia, Bolivia and Spain. Our results show a high degree of polymorphisms with a total of 216 alleles and a mean number of 10.80±3.49 for markers with a combined exclusion probability of 0.99.
Introduction
The guinea pig (Cavia porcellus), also called
cavy, is originally from the Andean regions of
southern Colombia, Ecuador, Peru, and Bolivia, where the species was domesticated between 7000 and 5000 BC (Morales, 1995). Today, a stable population of 35 million ani-mals is reared in this area (DAD-IS, 2014). The guinea pig has several uses and is a valuable economic resource for indigenous populations in the South American marginal areas where
they originate. The guinea pig is a unique source of food due to their ability to convert poor vegetable resources to protein. Additionally, the guinea pig has a strong pres-ence in local folklore and in popular medicine and is an important resource in the cultural patrimony of local nations, especially the Quechuas and Aymaras. The guinea pig has been introduced to other countries since the Spanish colonisation of the American conti-nent, and today, they are used as exotic pets or for scientific experimentation (Guerrini, 2003). Owing to it great capacity of growing and the poor feeding needs, many efforts have also been made to promote guinea pig hus-bandry in developing countries. The guinea pig was introduced in several West African coun-tries. Even if no official statistics are available (Manjeli et al., 1998), there are some stable reared populations in Cameron, Democratic Republic of Congo and Tanzania (Maass et al., 2005, 2010; Matthiesen et al., 2011). To date, no complete genetic study has been carried out on the domestic guinea pig although great advances have been reached with the comple-tion of the genomic sequence (http://www. ensembl.org/Cavia_porcellus/Info/Index; Broad Institute, 2015). Only a few studies have been conducted looking at microsatellites in guinea pigs, and they have centred on wild subspecies of the Cavia genus such as Cavia aperea and
Cavia magna (Kanitz et al., 2009) or have been
limited to a small marker panel (Burgos-Paz et
al., 2011). The large number of guinea pig
ani-mals and breeds reared in South America necessitated the development of molecular tools to perform genetic characterizations and population structure studies as well as a parentage testing strategy for modern breed-ing approaches. To respond to this demand, the aims of our study were to design a polymor-phic set of dinucleotide microsatellites useful both for analysing the genetic diversity of the domestic Cavia and as for parentage control, following the Food and Agriculture Organization (FAO) and International Society for Animal Genetics (ISAG) recommendations on this type of research in domestic animals.
Materials and methods
Samples used and DNA extraction
Hair samples from a total of 100 unrelated animals belonging to several domestic guinea pig populations were used in our study. Some samples were collected from several breeding lines from Ecuador (40) divided in 10 sample for type/line (Andina, Peru, Inti andcommer-cial local type) and others from Colombia (15), Bolivia (13) and Perú (15); also, some samples were collected in Spain from commercial lines (20) reared as pets. DNA was obtained by incu-bating 3 hair roots in the presence of 100 µL of 5% Chelex® (Biorad, Göttingen, Germany) resin suspension at 95°C for 10 minutes and 99°C for 3 min.
In silico identification of
microsatellites and primer design
The cavPor3 (high-coverage 6.79X assem-bly) genome release of the guinea pig (Caviaporcellus) was used to search for
microsatel-lite sequences (http://www.ensembl.org/ Cavia_porcellus/Info/Index) using the NCBI finder tool (Appendix Table 1). Sequence repeat motifs of ≥18 bp including poly AG, AC, AT, TC, CA, and GT were searched. A total of 25 sequences were selected. The primer pairs used for polymerase chain reaction (PCR)
Corresponding author: Dr. Vincenzo Landi, Grupo de Investigación AGR-218, Departamento de Genética, Universidad de Córdoba, Campus de Rabanales, 14014 Córdoba, Spain.
Tel: +34.957.218708. E-mail: [email protected]
Key words: Cavia porcellus; STRs; Biodiversity; Power of exclusion.
Acknowledgements: the authors wish to express thanks to the different breeders and research groups who kindly provided biological samples: Angelika Stemmer (University of San Simon, Cochabamba, Bolivia), Niltón Gómez (Universidad Nacional del Altiplano, Puno, Perú), Luz Angela Franco (Universidad Nacional de Colombia, Palmira, Colombia) and D. Carlos San José Marqués (BioDonostia, Spain). The authors gratefully thank the members of the CONBIAND network for valuable cooperation over the years.
Funding: the authors wish to acknowledge the financial support received by FUNDACION CAR-OLINA and the Programme Centro De Investigaciones CENI (Universidad Técnica de Ambato) for financial support for this project.
Received for publication: 15 March 2015. Accepted for publication: 22 August 2015.
This work is licensed under a Creative Commons Attribution NonCommercial 3.0 License (CC BY-NC 3.0).
©Copyright D. Aviles et al., 2015 Licensee PAGEPress, Italy
Italian Journal of Animal Science 2015; 14:3960 doi:10.4081/ijas.2015.3960
amplification were designed using Primer3 software version 0.4.0 (Rozen and Skaletsky, 2000). Our parameter sets included an opti-mum primer size of 20±5 bp, an optiopti-mum melting temperature of ~60±5°C and a GC content between 20 and 80%. The software was allowed to design primer pairs with expected PCR product sizes of 80 to 350 bp.
Microsatellite locus selection
Our primer pairs were synthesised by Stabvida, Costa de Caparica (Portugal) with-out further modifications. PCR was performed separately for each locus in a reaction volume of 25 µL containing ~10-30 ng of genomic DNA, 0.2 µM each primer pair, 1X NH4SO4PCR buffer, 2.5 mM MgCl2, 200 µM each dNTP, and 1U Taq polymerase (AIDLAB, Beijing, China). The annealing temperature was 56°C for 35 cycles. PCR products were visualised on a 3% agarose gel, stained with ethidium bromide, in TBE buffer at 150 V/cm, using a 100-bp ladder as a reference (Thermo Fisher Scientific Inc., Waltham, MA, USA).Based on the amplification efficiency and the absence of a nonspecific PCR product, the samples were sequenced using the BigDye cycle sequencing kit 2.0 (Life Technologies, Carlsbad, CA, USA), and the sequences were deposited in GenBank (Table 1) after sequenc-ing a control sample from the original clone (Appendix Table 1). Additionally, four microsatellite loci (Kanitz et al., 2009) were included in our study with some modifications
and discarding tetranucleotide repeat motifs loci (Table 1).
Microsatellite typing
A final set of 20 polymorphic microsatellites was selected from the microsatellites we test-ed. The forward primer for each locus was 5’ end labelled with fluorescent dye (Figure 1). PCR was performed separately for each locus in a final reaction volume of 25 µL containing ~10-30 ng of genomic DNA, 0.2 µM each primer pair, 1X NH4SO4/KCl PCR buffer, 3 mM MgCl2, 200 µM each dNTP, and 1U Taq poly-merase (AIDLAB, Beijing, China). Multiplex reactions were performed following the size range and dye availability using ABI dye set D (Figure 1). The optimal annealing tempera-ture was established by a gradient amplifica-tion of 8 samples (annealing temperature from 50 to 62°C) on a Biometra Tgradient Thermal cycler (Biorad).
The sizes of the microsatellite alleles were visualised using an ABI PRISM 3130 Genetic Analyzer (Life Technologies), using a POP7 polymer and the internal size standard GeneScan500-Rox (Life Technologies). Genotypes were read with the ABI PRISM GeneScan 3.1.2 software (Applied Biosystems, Carlsbad, CA, USA) and interpreted with the ABI PRISM Genotyper 3.7 NT software (Applied Biosystems).
Statistical analysis
The mean number of alleles, observed and
unbiased expected estimates of gene diversity, and their standard deviations, together with the polymorphic information content (PIC) were obtained using MICROSATELLITE TOOLKIT software (Park, 2001). We estimated non-exclusion probabilities considering the first (NE-1P), second (NE-2P) or parent pairs (NE-PP) and individual (NE-I) and sib identity (NE-SI) as well as the Hardy Weinberg Equilibrium (HWE), using Cervus software version 3.0.3 (Kalinowski et al., 2007). The combined posterior probability (PEC) was cal-culated with the algorithm of Jamieson (1994). Deviations from HWE and Fisbased on locus by locus AMOVA calculations were assessed using ARLEQUIN 3.5.1.3 (Excoffier and Lischer, 2010).
Results
Fluorescent polymerase chain
reac-tion design and microsatellite
genotyping
Based on amplification efficiency, success rate, and the absence of non-specific amplifi-cation of our primer pairs, a total of 16 microsatellites were selected for the panel design. We named these microsatellites CUY1,CUY2, CUY3, CUY4, CUY5, CUY6, CUY7, CUY8, CUY9, CUY10, CUY12, CUY16, CUY17, CUY18, CUY20, and CUY22. Additionally, 4
Aviles et al.
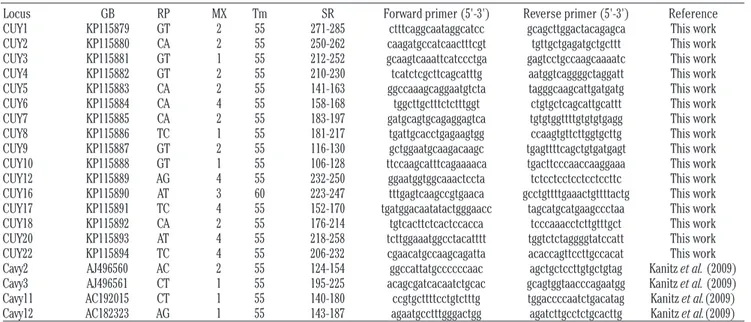
Table 1. Summary of the general characteristics of the twenty selected microsatellite loci.
Locus GB RP MX Tm SR Forward primer (5'-3') Reverse primer (5'-3') Reference CUY1 KP115879 GT 2 55 271-285 ctttcaggcaataggcatcc gcagcttggactacagagca This work CUY2 KP115880 CA 2 55 250-262 caagatgccatcaactttcgt tgttgctgagatgctgcttt This work CUY3 KP115881 GT 1 55 212-252 gcaagtcaaattcatccctga gagtcctgccaagcaaaatc This work CUY4 KP115882 GT 2 55 210-230 tcatctcgcttcagcatttg aatggtcaggggctaggatt This work CUY5 KP115883 CA 2 55 141-163 ggccaaagcaggaatgtcta tagggcaagcattgatgatg This work CUY6 KP115884 CA 4 55 158-168 tggcttgctttctctttggt ctgtgctcagcattgcattt This work CUY7 KP115885 CA 2 55 183-197 gatgcagtgcagaggagtca tgtgtggttttgtgtgtgagg This work CUY8 KP115886 TC 1 55 181-217 tgattgcacctgagaagtgg ccaagtgttcttggtgcttg This work CUY9 KP115887 GT 2 55 116-130 gctggaatgcaagacaagc tgagttttcagctgtgatgagt This work CUY10 KP115888 GT 1 55 106-128 ttccaagcatttcagaaaaca tgacttcccaaccaaggaaa This work CUY12 KP115889 AG 4 55 232-250 ggaatggtggcaaactccta tctcctcctcctcctccttc This work CUY16 KP115890 AT 3 60 223-247 tttgagtcaagccgtgaaca gcctgttttgaaactgttttactg This work CUY17 KP115891 TC 4 55 152-170 tgatggacaatatactgggaacc tagcatgcatgaagccctaa This work CUY18 KP115892 CA 2 55 176-214 tgtcacttctcactccacca tcccaaacctcttgtttgct This work CUY20 KP115893 AT 4 55 218-258 tcttggaaatggcctacatttt tggtctctaggggtatccatt This work CUY22 KP115894 TC 4 55 206-232 cgaacatgccaagcagatta acaccagttccttgccacat This work Cavy2 AJ496560 AC 2 55 124-154 ggccattatgccccccaac agctgctccttgtgctgtag Kanitz et al. (2009) Cavy3 AJ496561 CT 1 55 195-225 acagcgatcacaatctgcac gcagtggtaacccagaatgg Kanitz et al. (2009) Cavy11 AC192015 CT 1 55 140-180 ccgtgcttttcctgtctttg tggaccccaatctgacatag Kanitz et al.(2009) Cavy12 AC182323 AG 1 55 143-187 agaatgcctttgggactgg agatcttgcctctgcacttg Kanitz et al.(2009)
GB, GenBank accession number; RP, microsatellite repeat motive; MX, polymerase chain reaction multiplex reaction where the locus amplified; Tm, annealing temperature of polymerase chain reaction; SR, size range in base pairs.
ucleotide markers were selected from the Kanitz et al. (2009) based on sequence length and marker polymorphisms (Table 1) with no modification except for Cavy11 and Cavy 12, where the primer sequence was re-designed to improve the melting temperature parameter. A 4 colour system (ABI D Dye set) and a ~20 bp minimum predicted distance between loci was used to design the electrophoresis pattern. The unusually large distance between loci was designed because of a lack of references about this species, specifically information about expected allelic range. The panel of PCR ampli-fication resulted in four PCR multiplexes divid-ed into three electrophoresis sets (Figure 1). The gradient amplification resulted in an opti-mal hybridisation temperature, based on the broadness of the band, of 55±0.5°C for all of the multiplexes, with the exception of the CUY 16 maker (60±0.5°C).
Marker polymorphism and quality
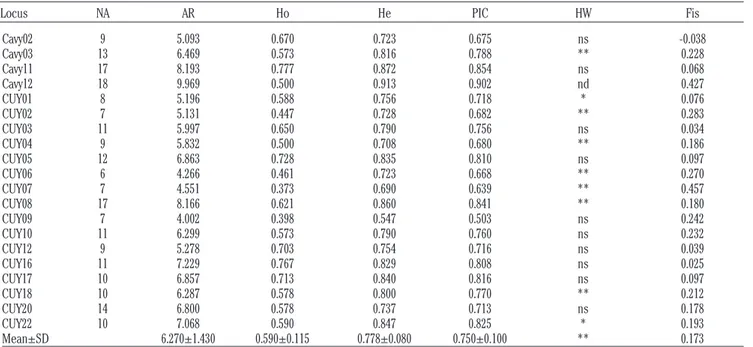
The allelic range (a region of the electro-pherogram where a locus specific allele can be found) we obtained was generally high. The mean difference between two alleles in the same individual ranged from 1.5 in CUY7 to 10.91 Cavy2.A total of 216 alleles were found with a mean value of 10.80±3.49. All microsatellites were highly polymorphic with a minimum of 6 alle-les (CUY6) and a maximum of 19 (Cavy12). The allelic richness ranged from a minimum of
4.002 for CUY9 and a maximum of 9.969 for Cavy12. We found observed and expected het-erozygosity to have an average mean value of 0.590±0.115 and 0.778±0.080, respectively, which is considered high (Table 2). To evalu-ate the polymorphisms of each marker, the PIC value was calculated and found to range from 0.503 for CUY9 and 0.902 for Cavy12. Deviations from HWE were found in 9 of the 20 loci (Appendix Table 2); Cavy12 and CUY7 were found in disequilibrium in 6 populations, CUY2, CUY10 and CUY17 (P<0.05). The sam-ple from Bolivia showed the highest number markers in disequilibrium (8) while the Spanish population showed the lowest ones (2). Fisvalues with a total mean value of 0.173.
Panel set power statistics
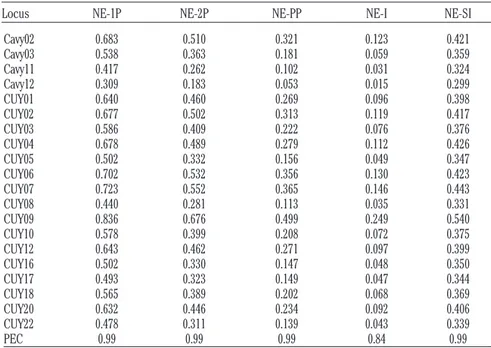
In Table 3, the non-exclusion probability val-ues are shown. The first two valval-ues (NE-1P and NE-2P) give the non-exclusion probability when the parents were considered one by one (the first parent and then the second parent of the opposite sex, respectively). In both cases, the higher value was for CUY9 (0.84 and 0.68), and the lower value was for Cavy12 (0.31 and 0.18). When parent pairs were considered, the results were comparable for identity and sib-ling identity non-exclusion probability, with a maximum value obtained for CUY9 (0.50, 0.25, and 0.54, respectively) and a lower probability for Cavy12 (0.05, 0.02 and 0.30, respectively).
Following the Jamieson (1994) algorithm
the combined posterior probability (PEC) was calculated (Table 3). The results show a high value for all types (0.99) but a smaller value for the sibling identity exclusion combined proba-bility (0.84).
Discussion
The aim of our study was to construct a poly-morphic marker panel of microsatellites that would be useful for both genetic diversity stud-ies and kinship and parentage analysis in
Cavia porcellus populations. Microsatellites
are very powerful genetic markers that can be used for identifying the genetic structure, pedigree analysis and genetic variation of closely related species. Until the present work, only a few studies had been carried out on wild guinea pigs using either a reduced microsatel-lite loci panel (Asher et al., 2008; Kanitz et al., 2009; Kouakou et al., 2015) or AFLP loci (Burgos-Paz et al., 2011). Some biodiversity studies have been carried out in Africa using the Kanitz et al. (2009) marker panel, such in Côte d’Ivoire (Kouakou et al., 2015) although these authors did not find clear genetic differ-ences among the three analysed populations. The most complete study on the genus Cavia was performed on mitochondrial DNA (Dunnum and Salazar-Bravo, 2010). Domestic
Table 2. Descriptive statistics of the twenty designed microsatellite marker loci.
Locus NA AR Ho He PIC HW Fis Cavy02 9 5.093 0.670 0.723 0.675 ns -0.038 Cavy03 13 6.469 0.573 0.816 0.788 ** 0.228 Cavy11 17 8.193 0.777 0.872 0.854 ns 0.068 Cavy12 18 9.969 0.500 0.913 0.902 nd 0.427 CUY01 8 5.196 0.588 0.756 0.718 * 0.076 CUY02 7 5.131 0.447 0.728 0.682 ** 0.283 CUY03 11 5.997 0.650 0.790 0.756 ns 0.034 CUY04 9 5.832 0.500 0.708 0.680 ** 0.186 CUY05 12 6.863 0.728 0.835 0.810 ns 0.097 CUY06 6 4.266 0.461 0.723 0.668 ** 0.270 CUY07 7 4.551 0.373 0.690 0.639 ** 0.457 CUY08 17 8.166 0.621 0.860 0.841 ** 0.180 CUY09 7 4.002 0.398 0.547 0.503 ns 0.242 CUY10 11 6.299 0.573 0.790 0.760 ns 0.232 CUY12 9 5.278 0.703 0.754 0.716 ns 0.039 CUY16 11 7.229 0.767 0.829 0.808 ns 0.025 CUY17 10 6.857 0.713 0.840 0.816 ns 0.097 CUY18 10 6.287 0.578 0.800 0.770 ** 0.212 CUY20 14 6.800 0.578 0.737 0.713 ns 0.178 CUY22 10 7.068 0.590 0.847 0.825 * 0.193 Mean±SD 6.270±1.430 0.590±0.115 0.778±0.080 0.750±0.100 ** 0.173
NA, total number of alleles; AR, allelic richness; Ho, observed heterozygosity; He, expected heterozygosity; PIC, polymorphic information content; HW, deviation from Hardy-Weinberg equilibrium; Fis, fixation index within populations; SD, standard deviation. *P<0.05; **P<0.01; ns, not significant.
guinea pigs were included in these studies as an out-group. Our main objective was to com-pare the genetic diversity of the domestic guinea pig to the overall rearing area of the species. For this reason, we designed a panel of microsatellite markers to examine recent evolutionary events to infer the population structure and the genetic differentiation among different commercial lines and locally recognised guinea pig breeds. In addition, the importance of the guinea pig for the rural economy of several Latin American countries increases the need for molecular tools to fur-ther initiatives for their genealogical manage-ment and breeding design (Mommens et al., 1998; Tozaki et al., 2001; Bonnet et al., 2002). Despite the diffusion into local communities and the low technological level needed for guinea pig farming, there exists intense com-mercial activity for these animals. Dinucleotide microsatellites are being used as genetic markers for the identification of popu-lation structure, genome mapping, and pedi-gree analysis and to resolve taxonomic ambi-guities in many other animals in addition to the guinea pig (Xu and Liu, 2011; Martinez et
al., 2012; Gama et al., 2013; Abdul-Muneer,
2014).
We successfully isolated, by scaffold genome sequencing, 25 microsatellite sequences, of which 16 were selected for the final panel based on their technical quality. All markers proposed here can be easily amplified in mul-tiplex PCR reactions using crude sample lysates. Generally, all of the loci had a very high number of alleles (10.8±3.40), which was higher than the values found by Kanitz et al. (2009) and Kouakou et al. (2015), as well as a high mean allelic range (25 bp). Even if only 11 loci out of 20 were in HWE in overall sample, the F index values were very high (0.173). These findings, despite the high number of alleles, can be explained by the small sample number used in this preliminary study, possi-bly leading to the maximization of heterozy-gous excess values (Wahlund, 1928), as high-lighted also by the HW disequilibrium calculat-ed by separatcalculat-ed populations that showcalculat-ed a sig-nificant value for the sixth population only in the markers Cavy12 and CUY7. These results can be due by the particular mating system based on using inbreeding animals added to the great interchange of males and females in the country markets. The total combined exclu-sion probability highlighted that the 20 loci are enough to obtain a good efficiency for parent-age testing and traceability purposes in this species.
Conclusions
We have identified a set of 16 microsatellite loci for domestic Cavia porcellus genetic
diver-sity research, and we have also established their standardised genotype analysis parame-ters. These markers could potentially resolve parentage and individual assignment cases. The high degree of genetic diversity and
Aviles et al.
Table 3. Summary statistics for the non-exclusion probability values.
Locus NE-1P NE-2P NE-PP NE-I NE-SI Cavy02 0.683 0.510 0.321 0.123 0.421 Cavy03 0.538 0.363 0.181 0.059 0.359 Cavy11 0.417 0.262 0.102 0.031 0.324 Cavy12 0.309 0.183 0.053 0.015 0.299 CUY01 0.640 0.460 0.269 0.096 0.398 CUY02 0.677 0.502 0.313 0.119 0.417 CUY03 0.586 0.409 0.222 0.076 0.376 CUY04 0.678 0.489 0.279 0.112 0.426 CUY05 0.502 0.332 0.156 0.049 0.347 CUY06 0.702 0.532 0.356 0.130 0.423 CUY07 0.723 0.552 0.365 0.146 0.443 CUY08 0.440 0.281 0.113 0.035 0.331 CUY09 0.836 0.676 0.499 0.249 0.540 CUY10 0.578 0.399 0.208 0.072 0.375 CUY12 0.643 0.462 0.271 0.097 0.399 CUY16 0.502 0.330 0.147 0.048 0.350 CUY17 0.493 0.323 0.149 0.047 0.344 CUY18 0.565 0.389 0.202 0.068 0.369 CUY20 0.632 0.446 0.234 0.092 0.406 CUY22 0.478 0.311 0.139 0.043 0.339 PEC 0.99 0.99 0.99 0.84 0.99
1P, non-exclusion of one candidate parent; 2P, candidate parent given the genotype of a known parent of the opposite sex; NE-PP, candidate parent pair; NE-I, identity of two unrelated individuals; NE-SI, identity of two siblings; PEC, combined exclusion prob-ability calculated using the Jamieson formula (Jamieson, 1994).
Figure 1. Electrophoresis set up of the twenty Cavia porcellus microsatellites based on allelic range and fluorescent dye for ABI D set. Blue=6FAM; Green=HEX; Yellow=ATTO550 (ROX as internal ladder).
morphisms indicate the potential of this microsatellite panel to be employed in future extended studies on the biodiversity of the cavy population. Therefore, genotype analyses with these standardised microsatellite panels will enhance cavy genetic selection by provid-ing individual identification to increase the precision of measured phenotypes and for the construction of pedigrees to support the meas-urement of genetic estimates of phenotypic variation across generations.
References
Abdul-Muneer, P.M., 2014. Application of microsatellite markers in conservation genetics and fisheries management: recent advances in population structure analysis and conservation strategies. Genet. Res. Int. 2014:691759.
Asher, M., Lippmann, T., Epplen, J.T., Kraus, C., Trillmich, F., Sachser, N., 2008. Large males dominate: ecology, social organiza-tion, and mating system of wild cavies, the ancestors of the guinea pig. Behav. Ecol. Sociobiol. 62:1509-1521.
Bonnet, A., Thevenon, S., Maudet, F., Maillard, J.C., 2002. Efficiency of semi-automated fluorescent multiplex PCRs with 11 microsatellite markers for genetic studies of deer populations. Anim. Genet. 33:343-350.
Broad Institute, 2015. Guinea pig genome proj-ect. Available from: http://www.broadinsti- tute.org/science/projects/mammals-mod-els/guinea-pig/guinea-pig
Burgos-Paz, W., Ceron-Munoz, M., Solarte-Portilla, C., 2011. Genetic diversity and population structure of the Guinea pig (Cavia porcellus, Rodentia, Caviidae) in Colombia. Genet. Mol. Biol. 34:711-718. DAD-IS, 2014. DAD-IS: domestic animal
diver-sity information system. Available from: h t t p : / / d a d . f a o . o r g / c g i -bin/EfabisWeb.cgi?sid=d856f41036885944 dea1b5f0c1525bab,reports
Dunnum, J.L., Salazar-Bravo, J., 2010. Molecular systematics, taxonomy and bio-geography of the genus Cavia (Rodentia: Caviidae). J. Zool. Syst. Evol. Res. 48:376-388.
Excoffier, L., Lischer, H.E., 2010. Arlequin suite ver 3.5: a new series of programs to per-form population genetics analyses under Linux and Windows. Mol. Ecol. Res. 10:564-567.
Gama, L.T., Martinez, A.M., Carolino, I., Landi, V., Delgado, J.V., Vicente, A.A., Vega-Pla, J.L., Cortes, O., Sousa, C.O., 2013. Genetic structure, relationships and admixture with wild relatives in native pig breeds from Iberia and its islands. Genet. Sel. Evol. 45:18.
Guerrini, A., 2003. Experimenting with humans and animals: from Galen to ani-mal rights. Johns Hopkins University Press, Baltimore, MD, USA.
Jamieson, A., 1994. The effectiveness of using co-dominant polymorphic allelic series for (1) checking pedigrees and (2) distin-guishing full-sib pair members. Anim. Genet. 25:37-44.
Kalinowski, S.T., Taper, M.L., Marshall, T.C., 2007. Revising how the computer program CERVUS accommodates genotyping error increases success in paternity assign-ment. Mol. Ecol. 16:1099-1106.
Kanitz, R., Trillmich, F., Bonatto, S., 2009. Characterization of new microsatellite loci for the South-American rodents Cavia aperea and C. magna. Conserv. Genet. Resour. 1:47-50.
Kouakou, P.K., Skilton, R., Apollinaire, D., Agathe, F., Beatrice, G., Clément, A.S., 2015. Genetic diversity and population structure of cavy (Cavia porcellus L) in three agro ecological zones of Côte d’Ivoire. Int. J. Agron. Agr. Res. 6:27-35. Maass, B.L., Jamnadass, R.H., Hanson, J.,
Pengelly, B.C., 2005. Determining sources of diversity in cultivated and wild Lablab purpureus related to provenance of germplasm by using amplified fragment length polymorphism. Genet. Resour. Crop. Ev. 52:683.
Maass, B.L., Katunga-Musale, D., Chiuri, W.L., Zozo, R., Peters, M., 2010. Livelihoods of smallholders in South Kivu depend on small livestock: the case of the ‘cobaye’.
Available from:
www.tropentag.de/2010/abstracts/full/491. pdf
Manjeli, Y., Tchoumboue, J., Njwe, R.M., Teguia, A., 1998. Guinea-pig productivity
under traditional management. Trop. Anim. Health Pro. 30:115-122.
Martinez, A.M., Gama, L.T., Canon, J., Ginja, C., Delgado, J.V., Dunner, S., Landi, V., Martin-Burriel, I., Penedo, M.C., Rodellar, C., Vega-Pla, J.L., Acosta, A., Alvarez, L.A., Camacho, E., Cortes, O., Marques, J.R., Martinez, R., Martinez, R.D., Melucci, L., Martinez-Velazquez, G., Munoz, J.E., Postiglioni, A., Quiroz, J., Sponenberg, P., Uffo, O., Villalobos, A., Zambrano, D., Zaragoza, P., 2012. Genetic footprints of Iberian cattle in America 500 years after the arrival of Columbus. PLoS One 7:e49066.
Matthiesen, T., Nyamete, F., Msuya, J.M., Maass, B.L., 2011. Importance of guinea pig husbandry for the livelihood of rural people in Tanzania: a case study in Iringa region. Available from: http://www.tropen-tag.de/2011/abstracts/links/Matthiesen_ll Ddf2DY.pdf
Mommens, G., Van Zeveren, A., Peelman, L.J., 1998. Effectiveness of bovine microsatel-lites in resolving paternity cases in American bison, Bison bison L. Anim. Genet. 29:12-18.
Morales, E., 1995. The guinea pig: healing, food, and ritual in the Andes. University of Arizona Press, Tucson, AZ, USA.
Park, S.D.E., 2001.Trypanotolerance in west african cattle and the population genetics effects of selection. University of Dublin, Dublin, Ireland.
Rozen, S., Skaletsky, H.J., 2000. Primer3 on the WWW for general users and for biologist programmers. Methods Mol. Biol. 2000:365-386.
Tozaki, T., Kakoi, H., Mashima, S., Hirota, K., Hasegawa, T., Ishida, N., Miura, N., Choi-Miura, N.H.,Tomita, M., 2001. Population study and validation of paternity testing for Thoroughbred horses by 15 microsatel-lite loci. J. Vet. Med. Sci. 63:1191-1197. Wahlund, S., 1928. Zusammensetzung von
Population und Korrelationserscheinung vom Standpunkt der Vererbungslehre aus betrachtet. Hereditas 11:65-106.
Xu, Q., Liu, R., 2011. Development and charac-terization of microsatellite markers for genetic analysis of the swimming crab, Portunus trituberculatus. Biochem. Genet. 49:202-212.
Aviles et al.
Appendix Table 1. Total primers pair designed in available scaffold sequence of Cavia porcellus.
Origin sequence description Accession number Repeat motive° Amplicon length Forward oligo Reverse oligo
Cavia porcellus clone CH234-497P15, complete sequence AC171739.3 GT(18) 273 ctttcaggcaataggcatcc gcagcttggactacagagca Cavia porcellus clone CH234-9K24, complete sequence AC173430.3 CA (22) 258 caagatgccatcaactttcgt tgttgctgagatgctgcttt Cavia porcellus, clone Cavia porcellus-24932957J7, complete sequence AC165221.3 GT (18) 228 gcaagtcaaattcatccctga gagtcctgccaagcaaaatc Cavia porcellus clone CH234-14J14, complete sequence AC175208.3 GT(22) 223 tcatctcgcttcagcatttg aatggtcaggggctaggatt Cavia porcellus clone CH234-497P15, complete sequence AC171739.3 CA(20) 156 ggccaaagcaggaatgtcta tagggcaagcattgatgatg Cavia porcellus clone CH234-9K24, complete sequence AC173430.3 CA(18) 162 tggcttgctttctctttggt ctgtgctcagcattgcattt Cavia porcellus clone B64 microsatellite sequence GU045442.1 CA(18) 187 gatgcagtgcagaggagtca tgtgtggttttgtgtgtgagg Cavia porcellus clone CH234-402D11, complete sequence AC175781.3 TC(21) 190 tgattgcacctgagaagtgg ccaagtgttcttggtgcttg Cavia porcellus clone CH234-334G9, complete sequence AC181988.3 GT(18) 120 gctggaatgcaagacaagc tgagttttcagctgtgatgagt Cavia porcellus clone CH234-9K24, complete sequence AC173430.3 GT(21) 117 ttccaagcatttcagaaaaca tgacttcccaaccaaggaaa Cavia porcellus clone C15 microsatellite sequence GU045440.1 TG(20) 156 aaaatgtgtccatggggatg gcatgtgtttatcgcgtctg Cavia porcellus clone CH234-34N9, complete sequence AC174609.3 AG(28) 242 ggaatggtggcaaactccta tctcctcctcctcctccttc Cavia porcellus clone CH234-34N9, complete sequence AC174609.3 AG(24) 273 tgccaaatgagaatggatga ggggttaatggcaatgtgtc Cavia porcellus clone CH234-386E16, complete sequence AC216606.3 CA(22) 250 agcaagaggcacacaagtca ggggttaatggcaatgtgtc Cavia porcellus clone CH234-14J14, complete sequence AC175208.3 AG(25) 153 aaagctttggactgcgaaga ttccttccttccttccttcc Cavia porcellus clone CH234-14J14, complete sequence AC175208.3 AT(25) 248 tttgagtcaagccgtgaaca gcctgttttgaaactgttttactg Cavia porcellus clone CH234-33F4, complete sequence AC174824.3 TC(19) 154 tgatggacaatatactgggaacc tagcatgcatgaagccctaa Cavia porcellus clone CH234-33F4, complete sequence AC174824.3 CA(21) 210 tgtcacttctcactccacca tcccaaacctcttgtttgct Cavia porcellus clone CH234-261L8, complete sequence AC181987.3 TC(22) 196 tcccaaaggctgagcatatc tggtcaaatttgtcttcatgtg Cavia porcellus clone CH234-261L8, complete sequence AC181987.3 AT(22) 231 tcttggaaatggcctacatttt tggtctctaggggtatccatt Cavia porcellus clone CH234-176E17, complete sequence AC171368.3 TC(27) 262 atctttcctgccccttcttc tggtgccacacacctgtaat Cavia porcellus clone CH234-487I3, complete sequence AC171142.3 TC(21) 248 cgaacatgccaagcagatta acaccagttccttgccacat Cavia porcellus clone CH234-487I3, complete sequence AC171142.3 CA(21) 195 gcaaatgtgccatcttgtgt aagttggttttgggggattt Cavia porcellus clone CH234-176E17, complete sequence AC171368.3 CA(27) 222 tgctgcagcctctttgaata ccacagtggtaaatgatcgag Cavia porcellus clone CH234-497P15, complete sequence AC171739.3 CA(23) 108 aaatcgcctacagcaacattc tttatggcaccagagagagc
°Repeat sequence length in National Center for Biotechnology Information sequence.
Appendix Table 2. Hardy Weinberg disequilibrium P value significance for each population.
Andinean line Inti line Peru line Commercial line Peru Bolivia Colombia Spain CAVY02 CAVY03 * CAVY11 ** CAVY12 ** ** ** ** ** ** CUY01 CUY02 * ** * ** CUY03 ** CUY04 * CUY05 CUY06 ** * CUY07 * * * ** ** CUY08 * ** ** CUY09 * CUY10 ** ** ** CUY12 CUY16 CUY17 * * ** CUY18 CUY20 CUY22 *P<0.05; **P<0.01.