The
new england
journal
of
medicine
established in 1812 April 5, 2018 vol. 378 no. 14
The authors’ full names, academic de-grees, and affiliations are listed in the Appendix. Address reprint requests to Dr. Motzer at Memorial Sloan Kettering Cancer Center, Memorial Hospital, 1275 York Ave., New York, NY 10065, or at motzerr@ mskcc . org; or to Dr. Sharma at M.D. Anderson Cancer Center, 1515 Hol-combe Blvd., Houston, TX 77030, or at padsharma@ mdanderson . org.
* A complete list of investigators in the CheckMate 214 trial is provided in the Supplementary Appendix, available at NEJM.org.
Drs. Sharma, Hammers, and Escudier con-tributed equally to this article.
This article was published on March 21, 2018, at NEJM.org.
N Engl J Med 2018;378:1277-90. DOI: 10.1056/NEJMoa1712126 Copyright © 2018 Massachusetts Medical Society. BACKGROUND
Nivolumab plus ipilimumab produced objective responses in patients with advanced renal-cell carcinoma in a pilot study. This phase 3 trial compared nivolumab plus ipili-mumab with sunitinib for previously untreated clear-cell advanced renal-cell carcinoma.
METHODS
We randomly assigned adults in a 1:1 ratio to receive either nivolumab (3 mg per kilogram of body weight) plus ipilimumab (1 mg per kilogram) intravenously every 3 weeks for four doses, followed by nivolumab (3 mg per kilogram) every 2 weeks, or sunitinib (50 mg) orally once daily for 4 weeks (6-week cycle). The coprimary end points were overall survival (alpha level, 0.04), objective response rate (alpha level, 0.001), and progression-free survival (alpha level, 0.009) among patients with inter-mediate or poor prognostic risk.
RESULTS
A total of 1096 patients were assigned to receive nivolumab plus ipilimumab (550 patients) or sunitinib (546 patients); 425 and 422, respectively, had intermediate or poor risk. At a median follow-up of 25.2 months in intermediate- and poor-risk pa-tients, the 18-month overall survival rate was 75% (95% confidence interval [CI], 70 to 78) with nivolumab plus ipilimumab and 60% (95% CI, 55 to 65) with sunitinib; the median overall survival was not reached with nivolumab plus ipilimumab versus 26.0 months with sunitinib (hazard ratio for death, 0.63; P<0.001). The objective re-sponse rate was 42% versus 27% (P<0.001), and the complete rere-sponse rate was 9% versus 1%. The median progression-free survival was 11.6 months and 8.4 months, respectively (hazard ratio for disease progression or death, 0.82; P = 0.03, not signifi-cant per the prespecified 0.009 threshold). Treatment-related adverse events occurred in 509 of 547 patients (93%) in the nivolumab-plus-ipilimumab group and 521 of 535 patients (97%) in the sunitinib group; grade 3 or 4 events occurred in 250 patients (46%) and 335 patients (63%), respectively. Treatment-related adverse events leading to discontinuation occurred in 22% and 12% of the patients in the respective groups.
CONCLUSIONS
Overall survival and objective response rates were significantly higher with nivolumab plus ipilimumab than with sunitinib among intermediate- and poor-risk patients with previously untreated advanced renal-cell carcinoma. (Funded by Bristol-Myers Squibb and Ono Pharmaceutical; CheckMate 214 ClinicalTrials.gov number, NCT02231749.)
abs tr act
Nivolumab plus Ipilimumab versus Sunitinib in Advanced
Renal-Cell Carcinoma
R.J. Motzer, N.M. Tannir, D.F. McDermott, O. Arén Frontera, B. Melichar, T.K. Choueiri, E.R. Plimack, P. Barthélémy, C. Porta, S. George, T. Powles, F. Donskov, V. Neiman, C.K. Kollmannsberger, P. Salman, H. Gurney, R. Hawkins, A. Ravaud, M.-O. Grimm, S. Bracarda, C.H. Barrios, Y. Tomita, D. Castellano, B.I. Rini, A.C. Chen, S. Mekan, M.B. McHenry,
S
unitinib, a vascular endothelial growth factor receptor tyrosine kinase in-hibitor, is a standard of care for first-linetreatment of advanced renal-cell carcinoma.1 In
a large, randomized, phase 3 trial involving pre-viously untreated patients, the median progres-sion-free survival with sunitinib was 9.5 months, the objective response rate was 25%, and the me-dian overall survival was 29.3 months, with a high rate of hematologic toxic effects.2
The prognosis of patients with advanced re-nal-cell carcinoma can be categorized according to favorable-, intermediate-, or poor-risk disease depending on the presence of well-characterized clinical and laboratory risk factors.3 A commonly
used, validated model to assess prognosis was developed by the International Metastatic Renal
Cell Carcinoma Database Consortium (IMDC).4,5
Approximately 75% of patients with advanced renal-cell carcinoma have intermediate- or poor-risk disease and have worse outcomes than those with favorable-risk disease.4,5
Nivolumab, a programmed death 1 (PD-1)
immune checkpoint inhibitor antibody,6 is
ap-proved for the treatment of advanced renal-cell carcinoma after treatment with antiangiogenic therapy, on the basis of an overall survival
ben-efit.7 Ipilimumab, an anti–cytotoxic
T-lympho-cyte–associated antigen 4 antibody, is approved
for the treatment of metastatic melanoma.8
Although ipilimumab at a dose of 3 mg per kilogram of body weight was associated in one trial with an objective response rate of 13% among patients with metastatic renal-cell car-cinoma, its toxic effects precluded further
de-velopment as monotherapy for this disease.9
Combination therapy with nivolumab plus
ipi-lim umab has shown promising efficacy in
multiple tumor types, resulting in higher rates
of response than either agent alone,10-14 and is
approved for the treatment of advanced
mela-noma.7 The combination has shown antitumor
activity in previously untreated and previously treated patients with advanced renal-cell carci-noma, with an objective response rate of 40% and a 2-year overall survival rate of 67 to 70%,
depending on the dose.11 Here, we report
re-sults from the phase 3 CheckMate 214 trial of nivolumab plus ipilimumab versus sunitinib in previously untreated advanced renal-cell car-cinoma.
Methods Patients
Eligible patients were 18 years of age or older, with previously untreated advanced renal-cell car-cinoma with a clear-cell component. Additional key inclusion criteria were measurable disease according to the Response Evaluation Criteria in
Solid Tumors (RECIST), version 1.1,15 and a
Kar-nofsky performance-status score of at least 70 (on a scale from 0 to 100, with lower scores in-dicating greater disability).16 Key exclusion criteria
were central nervous system metastases or auto-immune disease and glucocorticoid or immuno-suppressant use. Patients were characterized ac-cording to IMDC risk (favorable [score of 0], intermediate [score of 1 or 2], or poor [score of 3 to 6]), defined according to the number of the following risk factors present: a Karnofsky per-formance-status score of 70, a time from initial diagnosis to randomization of less than 1 year, a hemoglobin level below the lower limit of the normal range, a corrected serum calcium concen-tration of more than 10 mg per deciliter (2.5 mmol per liter), an absolute neutrophil count above the upper limit of the normal range, and a platelet
count above the upper limit of the normal range.4
Trial Design
This was a randomized, open-label, phase 3 trial of nivolumab plus ipilimumab followed by nivolumab monotherapy versus sunitinib mono-therapy. Randomization (in a 1:1 ratio) was performed with a block size of 4 with stratifica-tion according to IMDC risk score (0 vs. 1 or 2 vs. 3 to 6) and geographic region (United States vs. Canada and Europe vs. the rest of the world).
Nivolumab and ipilimumab were administered intravenously at a dose of 3 mg per kilogram over a period of 60 minutes and 1 mg per kilogram over a period of 30 minutes, respectively, every 3 weeks for four doses (induction phase), followed by nivolumab monotherapy at a dose of 3 mg per kilogram every 2 weeks (maintenance phase). Sunitinib was administered at a dose of 50 mg orally once daily for 4 weeks of each 6-week cycle. No dose reductions were allowed for nivolumab or ipilimumab. Dose delays for adverse events were permitted in both groups. Patients treated with nivolumab plus ipilimumab had to discon-tinue both nivolumab and ipilimumab if they
A Quick Take is available at NEJM.org
had a treatment-related adverse event during the induction phase that required discontinuation, and they could not continue on to nivolumab mainte-nance therapy. Detailed discontinuation criteria are shown in the Supplementary Appendix, available with the full text of this article at NEJM.org.
A November 2017 protocol amendment, after the primary end point had been met, permitted crossover from the sunitinib group to the nivolumab-plus-ipilimumab group. Nivolumab, ipilimumab, and sunitinib were provided by the sponsors, except when sunitinib was procured as a local commercial product in certain countries. Trial Oversight
This trial was approved by the institutional review board or ethics committee at each site and was conducted according to Good Clinical Practice guidelines, defined by the International Confer-ence on Harmonisation. All the patients provid-ed written informprovid-ed consent that was basprovid-ed on the Declaration of Helsinki principles. A data and safety monitoring committee reviewed efficacy and safety. The trial was designed by the authors in collaboration with the sponsors (Bristol-Myers Squibb and Ono Pharmaceutical). Bristol-Myers Squibb collected and analyzed the data with the authors. A data confidentiality agreement was in place between Bristol-Myers Squibb and the inves-tigators. The authors vouch for the completeness and accuracy of the data and analyses and for the adherence of the trial to the protocol (avail-able at NEJM.org). The development of the first draft of the manuscript was led by the first au-thor and the last three auau-thors; all the auau-thors contributed to drafting the manuscript and pro-vided final approval to submit the manuscript for publication. Medical writing support, funded by Bristol-Myers Squibb, was provided by PPSI. End Points and Assessments
The coprimary end points were the objective re-sponse rate, progression-free survival, and overall survival among intermediate- and poor-risk pa-tients. The objective response rate was defined as the percentage of patients having a confirmed best response of complete response or partial re-sponse according to RECIST, version 1.1, on the basis of assessment by an independent radiology review committee. Progression-free survival was defined as the time from randomization to first
RECIST-defined progression or death. Overall sur-vival was defined as the time from randomization to death.
Secondary end points included the objective response rate, progression-free survival, and over-all survival, over-all in the intention-to-treat popula-tion; and the incidence rate of adverse events among all treated patients. Exploratory end points included the objective response rate, progression-free survival, and overall survival, all among fa-vorable-risk patients. Additional exploratory end points included outcomes according to the level of tumor programmed death ligand 1 (PD-L1) ex-pression (≥1% vs. <1%), as assessed at a central laboratory with the use of the Dako PD-L1 IHC 28-8 pharmDx test, and health-related quality of life on the basis of the score on the National Comprehensive Cancer Network Functional As-sessment of Cancer Therapy–Kidney Symptom Index (FKSI-19) (see the Supplementary Appendix), both in intermediate- and poor-risk patients.17,18
FKSI-19 scores range from 0 to 76, with higher scores indicating fewer symptoms.
Disease assessments were performed with com-puted tomography or magnetic resonance imaging at baseline, 12 weeks after randomization, con-tinuing every 6 weeks for the first 13 months, and then every 12 weeks until progression or treatment discontinuation. After progression or treatment discontinuation, patients were followed for safety and survival. Adverse events were graded according to the National Cancer Institute Common Terminology Criteria for Adverse Events,
version 4.0.19 Patients in both groups were
al-lowed to continue therapy after initial investiga-tor-assessed, RECIST-defined progression if they had clinical benefit without disabling toxic ef-fects. Patients discontinued trial therapy on evi-dence of further progression, defined as an ad-ditional 10% or greater increase in tumor burden volume from the time of initial progression (in-cluding all target lesions and new measurable lesions) according to investigator assessment. Statistical Analysis
It was estimated that 1070 patients would under-go randomization, with 820 having IMDC inter-mediate or poor risk (the proportion expected according to the distribution in the general popu-lation and the number needed for robust statisti-cal analyses). Enrollment was discontinued once
approximately 820 patients (77%) with IMDC in-termediate or poor risk had undergone random-ization.
The overall alpha level was 0.05, split among three coprimary end points. The objective re-sponse rate was analyzed at an alpha level of 0.001. Progression-free survival was evaluated at an alpha level of 0.009, with a power of 80% or more. We evaluated overall survival at an alpha level of 0.04 with 90% power (independent of coprimary end points) on the basis of a hazard ratio of 0.77, accounting for two formal interim analyses after 51% (reported herein) and 75% of deaths had occurred, using a stratified log-rank test. An O’Brien and Fleming alpha spending function was used to determine nominal sig-nificance levels that were based on the number of deaths for the interim and final analyses and stopping boundaries, and an adjusted alpha level of 0.002 was used for the first interim analysis. The critical hazard ratio for the first interim analysis of overall survival was 0.72. The strati-fied hazard ratio between treatment groups is presented along with the 99.8% confidence in-terval (adjusted for interim analyses). For progres-sion-free survival, a two-sided stratified 99.1% confidence interval for the hazard ratio was cal-culated. Confidence intervals were defined on the basis of the respective alpha allocated to that end point. Estimates of response rate, along with the exact two-sided 95% confidence interval by
the Clopper–Pearson method,20 were computed.
Overall survival, progression-free survival, and duration of response were estimated with the use of Kaplan–Meier methods.
For quality-of-life assessments, descriptive sta-tistics and change from baseline were conducted for the FKSI-19 score. Calculations of P values, to evaluate the between-group difference in mean change from baseline, were based on an indepen-dent-samples t-test under the assumption that variances were unequal. Both a pattern-mixture model and a restricted maximum likelihood–based repeated-measures approach were used to confirm descriptive data.
R esults Patients
From October 2014 through February 2016, a total of 1096 patients were randomly assigned to treatment at 175 sites in 28 countries; 1082
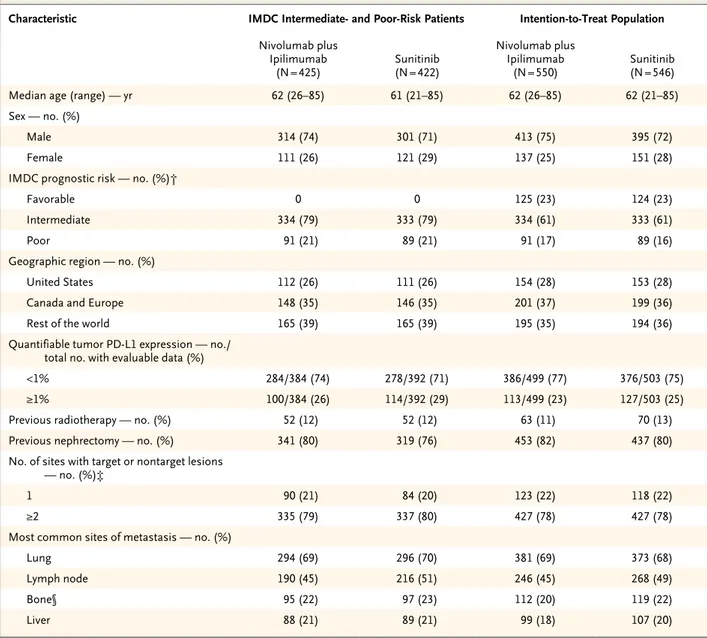
pa-tients received treatment (547 with nivolumab plus ipilimumab and 535 with sunitinib in the in-tention-to-treat population; 423 and 416, respec-tively, had intermediate or poor risk). At the time of the database lock (August 7, 2017), 128 of 547 patients (23%) in the nivolumab-plus-ipilimu-mab group and 97 of 535 (18%) in the sunitinib group continued treatment (Fig. S1 in the Sup-plementary Appendix). The primary reason for treatment discontinuation was disease progres-sion, observed in 229 of 547 patients (42%) in the nivolumab-plus-ipilimumab group and 296 of 535 (55%) in the sunitinib group (Fig. S1 in the Supplementary Appendix). Patient character-istics were similar in the two treatment groups, and the characteristics of the intermediate- and poor-risk patients were similar to those of the intention-to-treat population (Table 1). The me-dian follow-up was 25.2 months; the minimum follow-up was 17.5 months.
Efficacy
Coprimary End Points in Intermediate- and Poor-Risk Patients
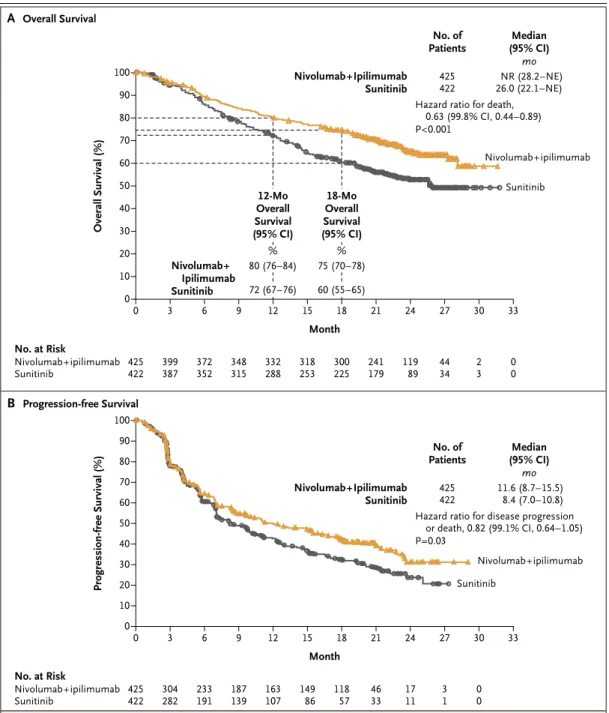
Nivolumab plus ipilimumab had a significant over-all survival benefit over sunitinib; the 12-month overall survival rate was 80% (95% confidence interval [CI], 76 to 84) with nivolumab plus ipi-limumab versus 72% (95% CI, 67 to 76) with sunitinib, and the 18-month overall survival rate was 75% (95% CI, 70 to 78) versus 60% (95% CI, 55 to 65) (hazard ratio for death, 0.63; 99.8% CI, 0.44 to 0.89; P<0.001). The median overall sur-vival was not reached (95% CI, 28.2 months to not estimable) with nivolumab plus ipilimumab versus 26.0 months (95% CI, 22.1 to not esti-mable) with sunitinib (Fig. 1A).
The coprimary end point of objective re-sponse rate was 42% (95% CI, 37 to 47) with nivolumab plus ipilimumab versus 27% (95% CI, 22 to 31) with sunitinib (P<0.001), with complete responses in 40 patients (9%) versus 5 patients (1%) (Table 2). Of all intermediate- and poor-risk patients, 81% of those treated with nivolumab plus ipilimumab and 70% of those treated with sunitinib had a duration of response of at least 1 year, and the median duration of response was not reached (95% CI, 21.8 months to not estima-ble) and 18.2 months (95% CI, 14.8 to not esti-mable), respectively (Table 2, and Fig. S2 in the Supplementary Appendix). Rates of investigator-assessed objective response were consistent with
rates of independently assessed objective response (Table S1 in the Supplementary Appendix).
For the coprimary end point of progression-free survival, the median was 11.6 months (95% CI, 8.7 to 15.5) with nivolumab plus ipilimumab and 8.4
months (95% CI, 7.0 to 10.8) with sunitinib (Fig. 1B). The between-group difference did not meet the prespecified threshold (P = 0.009) for statistical sig-nificance (hazard ratio for disease progression or death, 0.82; 99.1% CI, 0.64 to 1.05; P = 0.03).
Characteristic IMDC Intermediate- and Poor-Risk Patients Intention-to-Treat Population
Nivolumab plus Ipilimumab (N = 425) Sunitinib (N = 422) Nivolumab plus Ipilimumab (N = 550) Sunitinib (N = 546)
Median age (range) — yr 62 (26–85) 61 (21–85) 62 (26–85) 62 (21–85)
Sex — no. (%)
Male 314 (74) 301 (71) 413 (75) 395 (72)
Female 111 (26) 121 (29) 137 (25) 151 (28)
IMDC prognostic risk — no. (%)†
Favorable 0 0 125 (23) 124 (23)
Intermediate 334 (79) 333 (79) 334 (61) 333 (61)
Poor 91 (21) 89 (21) 91 (17) 89 (16)
Geographic region — no. (%)
United States 112 (26) 111 (26) 154 (28) 153 (28)
Canada and Europe 148 (35) 146 (35) 201 (37) 199 (36)
Rest of the world 165 (39) 165 (39) 195 (35) 194 (36)
Quantifiable tumor PD-L1 expression — no./ total no. with evaluable data (%)
<1% 284/384 (74) 278/392 (71) 386/499 (77) 376/503 (75)
≥1% 100/384 (26) 114/392 (29) 113/499 (23) 127/503 (25)
Previous radiotherapy — no. (%) 52 (12) 52 (12) 63 (11) 70 (13)
Previous nephrectomy — no. (%) 341 (80) 319 (76) 453 (82) 437 (80)
No. of sites with target or nontarget lesions — no. (%)‡
1 90 (21) 84 (20) 123 (22) 118 (22)
≥2 335 (79) 337 (80) 427 (78) 427 (78)
Most common sites of metastasis — no. (%)
Lung 294 (69) 296 (70) 381 (69) 373 (68)
Lymph node 190 (45) 216 (51) 246 (45) 268 (49)
Bone§ 95 (22) 97 (23) 112 (20) 119 (22)
Liver 88 (21) 89 (21) 99 (18) 107 (20)
* Information shown in the table is based on data collected with the use of an interactive voice-response system. Percentages may not total 100 because of rounding. IMDC denotes International Metastatic Renal Cell Carcinoma Database Consortium, and PD-L1 programmed death ligand 1.
† Patients with favorable risk had an IMDC score of 0, those with intermediate risk had a score of 1 or 2, and those with poor risk had a score of 3 to 6. IMDC risk scores are defined by the number of the following risk factors present: a Karnofsky performance-status score of 70 (on a scale from 0 to 100, with lower scores indicating greater disability; patients with a performance-status score of <70 were excluded from the trial), a time from initial diagnosis to randomization of less than 1 year, a hemoglobin level below the lower limit of the normal range, a cor-rected serum calcium concentration of more than 10 mg per deciliter (2.5 mmol per liter), an absolute neutrophil count above the upper limit of the normal range, and a platelet count above the upper limit of the normal range.
‡ The number of target or nontarget lesions at baseline was not reported for one patient in the sunitinib group. § Shown are patients who had bone metastases with or without a soft-tissue component.
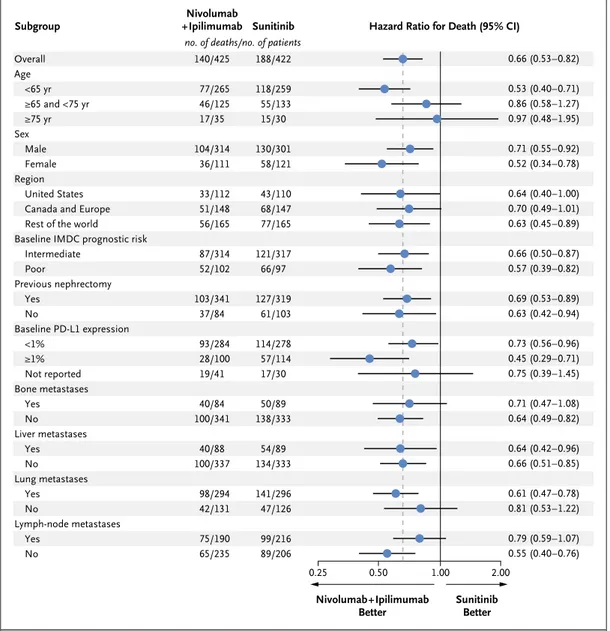
Overall survival favored nivolumab plus ipi lim-umab over sunitinib across subgroups (Fig. 2). Similarly, the objective response rate was higher with nivolumab plus ipilimumab than with suni-tinib in all subgroups (Fig. S3 in the Supplemen-tary Appendix).
Secondary End Points in the Intention-to-Treat Population
In the intention-to-treat population (patients with favorable, intermediate, or poor risk), the 12-month overall survival rate was 83% (95% CI, 80 to 86) with nivolumab plus ipilimumab versus 77%
Figure 1. Overall Survival and Progression-free Survival among IMDC Intermediate- and Poor-Risk Patients. Progression was defined according to the Response Evaluation Criteria in Solid Tumors, version 1.1. For progres-sion-free survival, the between-group difference did not meet the prespecified threshold (P = 0.009) for statistical significance. IMDC denotes International Metastatic Renal Cell Carcinoma Database Consortium, NE not estimable, and NR not reached.
Overall Survival (%) 100 80 90 70 60 40 30 10 50 20 0 0 6 12 15 21 27 33 Month B Progression-free Survival A Overall Survival
Hazard ratio for death, 0.63 (99.8% CI, 0.44–0.89) P<0.001 No. at Risk Nivolumab+ipilimumab Sunitinib 425422 372352 3 399 387 332288 9 348 315 318253 241179 18 300 225 4434 24 119 89 30 2 3 00 Nivolumab+ipilimumab Nivolumab+ Ipilimumab Sunitinib Nivolumab+Ipilimumab
Sunitinib 425422 NR (28.2–NE)26.0 (22.1–NE) Median (95% CI) No. of Patients mo Sunitinib Progression-free Survival (%) 100 80 90 70 60 40 30 10 50 20 0 0 6 12 15 21 27 33 Month
Hazard ratio for disease progression or death, 0.82 (99.1% CI, 0.64–1.05) P=0.03 No. at Risk Nivolumab+ipilimumab Sunitinib 425422 233191 3 304 282 163107 9 187 139 14986 4633 18 118 57 31 24 17 11 30 0 0 Nivolumab+ipilimumab Nivolumab+Ipilimumab Sunitinib 425422 11.6 (8.7–15.5)8.4 (7.0–10.8) Median (95% CI) No. of Patients mo Sunitinib 80 (76–84) 72 (67–76) 12-Mo Overall Survival (95% CI) 75 (70–78) 60 (55–65) 18-Mo Overall Survival (95% CI) % %
(95% CI, 74 to 81) with sunitinib, and the 18-month overall survival rate was 78% (95% CI, 74 to 81) versus 68% (95% CI, 63 to 72). The median over-all survival was not reached versus 32.9 months. Nivolumab plus ipilimumab had a significant over-all survival benefit over sunitinib (hazard ratio for death, 0.68; 99.8% CI, 0.49 to 0.95; P<0.001). The rate of independently assessed objective re-sponse was 39% (95% CI, 35 to 43) with nivolu-mab plus ipilimunivolu-mab and 32% (95% CI, 28 to 36) with sunitinib (P = 0.02, not significant per the prespecified 0.001 threshold). The median progression-free survival was 12.4 months (95% CI, 9.9 to 16.5) with nivolumab plus ipilimumab and 12.3 months (95% CI, 9.8 to 15.2) with suni-tinib. Progression-free survival did not differ significantly between the two groups (hazard ratio for disease progression or death, 0.98; 99.1% CI, 0.79 to 1.23; P = 0.85).
Exploratory Analyses of Favorable-Risk Patients
The baseline characteristics of the 249 favorable-risk patients were similar to those of the inter-mediate- and poor-risk patients and of the inten-tion-to-treat population, except that the baseline PD-L1 expression level was lower in favorable-risk patients (Table S2 in the Supplementary Appen-dix). The 12-month overall survival rate was 94% (95% CI, 87 to 97) with nivolumab plus ipilim-umab and 96% (95% CI, 90 to 98) with
suni-tinib, and the 18-month overall survival rate was 88% (95% CI, 80 to 92) and 93% (95% CI, 87 to 97), respectively (the hazard ratio for death favored sunitinib: 1.45; 99.8% CI, 0.51 to 4.12; P = 0.27). However, only 37 deaths had occurred at the time of the database lock (21 in the nivolumab-plus-ipilimumab group and 16 in the sunitinib group); the median overall survival was not reached and 32.9 months (95% CI, not estimable), respec-tively. The objective response rate was 29% (95% CI, 21 to 38) with nivolumab plus ipilimumab versus 52% (95% CI, 43 to 61) with sunitinib (P<0.001), and the median progression-free sur-vival was 15.3 months (95% CI, 9.7 to 20.3) ver-sus 25.1 months (95% CI, 20.9 to not estimable) (hazard ratio for disease progression or death, 2.18; 99.1% CI, 1.29 to 3.68; P<0.001), both fa-voring sunitinib. However, the rate of complete response was 11% with nivolumab plus ipilim-umab and 6% with sunitinib.
Exploratory Outcomes According to PD-L1 Expression Level
Among 776 intermediate- and poor-risk patients who had quantifiable PD-L1 expression, 100 of 384 patients (26%) in the nivolumab-plus-ipilim-umab group and 114 of 392 patients (29%) in the sunitinib group had 1% or greater PD-L1 expres-sion. In exploratory analyses, overall survival among the 776 patients was longer with
nivolu-Variable Nivolumab plus Ipilimumab (N = 425) Sunitinib (N = 422)
Confirmed objective response rate — % (95% CI)† 42 (37–47)‡ 27 (22–31)‡ Confirmed best overall response — no. (%)†
Complete response 40 (9)‡§ 5 (1)‡§
Partial response 137 (32) 107 (25)
Stable disease 133 (31) 188 (45)
Progressive disease 83 (20) 72 (17)
Unable to determine or not reported 32 (8) 50 (12)
Median time to response (range) — mo 2.8 (0.9–11.3) 3.0 (0.6–15.0)
Median duration of response (95% CI) — mo NR (21.8–NE) 18.2 (14.8–NE)
Patients with ongoing response — no./total no. (%) 128/177 (72) 71/112 (63) * NE denotes not estimable, and NR not reached.
† Response was assessed according to Response Evaluation Criteria in Solid Tumors, version 1.1, by an independent radiology review committee.
‡ P<0.001 for the difference between groups.
§ The analysis of the between-group difference in complete response was exploratory. Table 2. Antitumor Activity in IMDC Intermediate- and Poor-Risk Patients.*
mab plus ipilimumab than with sunitinib across PD-L1 expression levels (Fig. S4 in the Supplemen-tary Appendix). The 12-month overall survival rate with less than 1% PD-L1 expression was 80% (95% CI, 75 to 84) with nivolumab plus ipilim-umab and 75% (95% CI, 70 to 80) with
suni-tinib, and the 18-month overall survival rate was 74% (95% CI, 69 to 79) and 64% (95% CI, 58 to 70), respectively; the median overall survival was not reached in both groups (hazard ratio for death, 0.73; 95% CI, 0.56 to 0.96). In patients with 1% or greater PD-L1 expression, the 12-month overall
Figure 2. Subgroup Analysis of Overall Survival among IMDC Intermediate- and Poor-Risk Patients.
Patients with intermediate risk had an IMDC score of 1 or 2, and those with poor risk had a score of 3 to 6. IMDC risk scores are defined by the number of the following risk factors present: a Karnofsky performance-status score of 70 (on a scale from 0 to 100, with lower scores indicating greater disability; patients with a performance-status score of <70 were excluded from the trial), a time from initial diagnosis to randomization of less than 1 year, a he-moglobin level below the lower limit of the normal range, a corrected serum calcium concentration of more than 10 mg per deciliter (2.5 mmol per liter), an absolute neutrophil count above the upper limit of the normal range, and a platelet count above the upper limit of the normal range. Bone, liver, lung, and lymph-node metastases were not protocol-prespecified subgroups. PD-L1 denotes programmed death ligand 1.
0.50 1.00 2.00 Sunitinib Better Nivolumab+Ipilimumab Better Overall Age <65 yr ≥65 and <75 yr ≥75 yr Sex Male Female Region United States Canada and Europe Rest of the world Baseline IMDC prognostic risk
Intermediate Poor Previous nephrectomy Yes No Baseline PD-L1 expression <1% ≥1% Not reported Bone metastases Yes No Liver metastases Yes No Lung metastases Yes No Lymph-node metastases Yes No Nivolumab
+Ipilimumab Sunitinib Hazard Ratio for Death (95% CI) Subgroup 0.66 (0.53–0.82) 0.53 (0.40–0.71) 0.86 (0.58–1.27) 0.97 (0.48–1.95) 0.71 (0.55–0.92) 0.52 (0.34–0.78) 0.64 (0.40–1.00) 0.70 (0.49–1.01) 0.63 (0.45–0.89) 0.66 (0.50–0.87) 0.57 (0.39–0.82) 0.69 (0.53–0.89) 0.63 (0.42–0.94) 0.73 (0.56–0.96) 0.45 (0.29–0.71) 0.75 (0.39–1.45) 0.71 (0.47–1.08) 0.64 (0.49–0.82) 0.64 (0.42–0.96) 0.66 (0.51–0.85) 0.61 (0.47–0.78) 0.81 (0.53–1.22) 0.79 (0.59–1.07) 0.55 (0.40–0.76) 0.25 140/425 77/265 46/125 17/35 104/314 36/111 33/112 51/148 56/165 87/314 52/102 103/341 37/84 93/284 28/100 19/41 40/84 100/341 40/88 100/337 98/294 42/131 75/190 65/235 188/422 118/259 55/133 15/30 130/301 58/121 43/110 68/147 77/165 121/317 66/97 127/319 61/103 114/278 57/114 17/30 50/89 138/333 54/89 134/333 141/296 47/126 99/216 89/206
survival rate was 86% (95% CI, 77 to 91) with nivolumab plus ipilimumab and 66% (95% CI, 56 to 74) with sunitinib, and the 18-month over-all survival rate was 81% (95% CI, 71 to 87) and 53% (95% CI, 43 to 62), respectively; the median overall survival was not reached and 19.6 months (95% CI, 14.8 to not estimable), respectively (hazard ratio for death, 0.45; 95% CI, 0.29 to 0.71) (Fig. S4 in the Supplementary Appendix).
The objective response rate among patients with less than 1% PD-L1 expression was 37% with nivolumab plus ipilimumab and 28% with sunitinib (P = 0.03); among patients with 1% or greater PD-L1 expression, the objective response rate was 58% versus 22% (P<0.001) (Table S3 in the Supplementary Appendix). The median pro-gression-free survival among patients with less than 1% PD-L1 expression was 11.0 months with nivolumab plus ipilimumab and 10.4 months with sunitinib (hazard ratio for disease progres-sion or death, 1.00; 95% CI, 0.80 to 1.26); among patients with 1% or greater PD-L1 expression, the median progression-free survival was 22.8 and 5.9 months, respectively (hazard ratio for disease progression or death, 0.46; 95% CI, 0.31 to 0.67). A similar trend was observed among patients with 5% or greater PD-L1 expression, as compared with patients with less than 5% PD-L1 expression (not shown).
Exposure and Safety
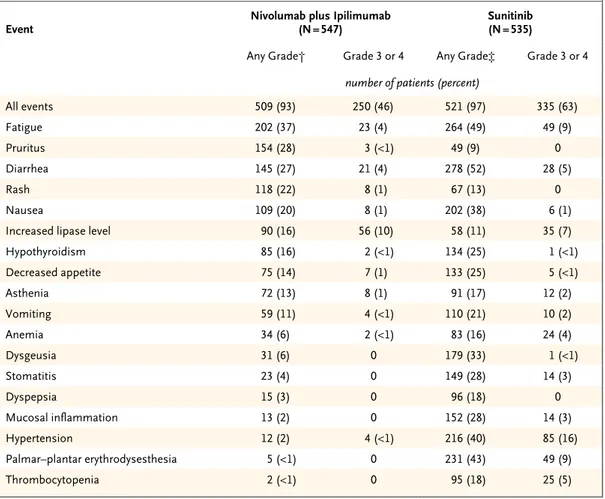
The median duration of treatment in all patients who received a trial drug was 7.9 months (95% CI, 6.5 to 8.4) with nivolumab plus ipilimumab and 7.8 months (95% CI, 6.4 to 8.5) with sunitinib. A total of 79% of the patients received all four doses of ipilimumab with nivolumab. Among the 547 patients treated with nivolumab plus ipilimumab, nivolumab dose delays occurred in 319 (58%), and ipilimumab dose delays occurred in 148 (27%). Among the 535 patients treated with sunitinib, dose delays occurred in 315 (59%), and dose reductions occurred in 283 (53%). A total of 157 of 550 patients (29%) in the nivolumab-plus-ipilimumab group and 129 of 546 patients (24%) in the sunitinib group were treated beyond initial investigator-assessed, RECIST-defined pro-gression, as permitted according to the protocol. Treatment-related adverse events of any grade occurred in 509 of 547 patients (93%) treated with nivolumab plus ipilimumab and 521 of 535 patients (97%) treated with sunitinib (Table 3).
Grade 3 or 4 events occurred in 250 patients (46%) and 335 patients (63%) in the respective groups. Treatment-related adverse events leading to discontinuation occurred in 118 of 547 pa-tients (22%) in the nivolumab-plus-ipilimumab group and 63 of 535 patients (12%) in the suni-tinib group. Eight deaths in the nivolumab-plus-ipilimumab group and four deaths in the suni-tinib group were reported to be treatment-related (Table 3). Of the 436 patients treated with nivolu-mab plus ipilimunivolu-mab who had a treatment-related select (immune-mediated) adverse event (includes skin, endocrine, gastrointestinal, pulmonary, he-patic, and renal categories), 152 (35%) received high-dose glucocorticoids (≥40 mg of prednisone per day or equivalent).
Quality of Life
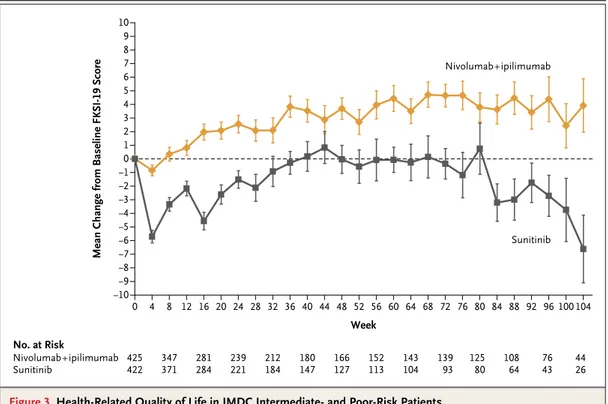
The rate of completion of the FKSI-19 question-naire exceeded 80% in both groups during the first 6 months. The mean baseline FKSI-19 score (a quality-of-life metric) was similar in the two groups among patients with intermediate or poor risk (60.1 for nivolumab plus ipilimumab and 59.1 for sunitinib); the mean change from base-line was greater in the nivolumab-plus-ipilim-umab group than in the sunitinib group at each assessment during the first 6 months (P<0.001) (Fig. 3). The pattern-mixture model and the mixed-model repeated-measures approach indicated a significant difference in favor of nivolumab plus ipilimumab, which substantiated the descriptive results (not shown).
Subsequent Therapy
Among randomly assigned patients, 217 of 550 (39%) in the nivolumab-plus-ipilimumab group and 295 of 546 (54%) in the sunitinib group re-ceived subsequent systemic therapy. The most common subsequent therapies were sunitinib (111 patients, 20%) and pazopanib (72 patients, 13%) in the nivolumab-plus-ipilimumab group and nivolumab (147 patients, 27%) and axitinib (106 patients, 19%) in the sunitinib group.
Discussion
In this randomized, phase 3 trial involving pre-viously untreated patients with advanced renal-cell carcinoma, two of the three coprimary end points were met; among intermediate- and poor-risk patients, the poor-risk of death was 37% lower
with nivolumab plus ipilimumab than with suni-tinib, and the objective response rate was higher with nivolumab plus ipilimumab (42% vs. 27%). The 9% complete response rate with nivolumab plus ipilimumab compared favorably with the 1% observed with sunitinib and with a complete response rate of 1% or less reported with other tyrosine kinase inhibitor therapies.2,21 A
signifi-cant difference in overall survival favoring nivolu-mab plus ipilimunivolu-mab was also observed in the intention-to-treat population (18-month overall survival rate, 78% [95% CI, 74 to 81] with nivolu-mab plus ipilimunivolu-mab vs. 68% with sunitinib [95% CI, 63 to 72]; hazard ratio for death, 0.68; 99.8% CI, 0.49 to 0.95; P<0.001).
Progression-free survival among intermediate- and poor-risk patients was longer with nivolu-mab plus ipilimunivolu-mab than with sunitinib but did not meet the prespecified boundary for sta-tistical significance (alpha level, 0.009), partly owing to the distribution of the alpha level across three coprimary end points. The curves separated at 6 months after randomization and followed a pattern similar to that observed in a randomized, phase 3 trial comparing nivolumab with everolimus in previously treated advanced renal-cell carcinoma.22
Longer progression-free survival with nivolu-mab plus ipilimunivolu-mab than with sunitinib was ob-served among patients with 1% or greater PD-L1
Event Nivolumab plus Ipilimumab (N = 547) Sunitinib (N = 535)
Any Grade† Grade 3 or 4 Any Grade‡ Grade 3 or 4 number of patients (percent)
All events 509 (93) 250 (46) 521 (97) 335 (63) Fatigue 202 (37) 23 (4) 264 (49) 49 (9) Pruritus 154 (28) 3 (<1) 49 (9) 0 Diarrhea 145 (27) 21 (4) 278 (52) 28 (5) Rash 118 (22) 8 (1) 67 (13) 0 Nausea 109 (20) 8 (1) 202 (38) 6 (1)
Increased lipase level 90 (16) 56 (10) 58 (11) 35 (7)
Hypothyroidism 85 (16) 2 (<1) 134 (25) 1 (<1) Decreased appetite 75 (14) 7 (1) 133 (25) 5 (<1) Asthenia 72 (13) 8 (1) 91 (17) 12 (2) Vomiting 59 (11) 4 (<1) 110 (21) 10 (2) Anemia 34 (6) 2 (<1) 83 (16) 24 (4) Dysgeusia 31 (6) 0 179 (33) 1 (<1) Stomatitis 23 (4) 0 149 (28) 14 (3) Dyspepsia 15 (3) 0 96 (18) 0 Mucosal inflammation 13 (2) 0 152 (28) 14 (3) Hypertension 12 (2) 4 (<1) 216 (40) 85 (16) Palmar–plantar erythrodysesthesia 5 (<1) 0 231 (43) 49 (9) Thrombocytopenia 2 (<1) 0 95 (18) 25 (5)
* These events were considered by investigators to be related to treatment.
† There were eight treatment-related deaths in the nivolumab-plus-ipilimumab group: one each due to pneumonitis, pneu-monia and aplastic anemia (the cause of death in this case was updated after the database lock to treatment-related), immune-mediated bronchitis, lower gastrointestinal hemorrhage, the hemophagocytic syndrome, sudden death, liver toxic effects, and lung infection.
‡ There were four treatment-related deaths in the sunitinib group: two due to cardiac arrest and one each due to heart failure and multiple organ failure.
expression but not among those with less than 1% PD-L1 expression. In contrast, longer overall survival and a higher objective response rate were observed with nivolumab plus ipilimumab than with sunitinib among intermediate- and poor-risk patients across tumor PD-L1 expression levels, although the magnitude of benefit was higher in the population with 1% or greater PD-L1 expres-sion. This suggests that PD-L1 expression is not entirely predictive of response to and overall sur-vival benefit from the combination, as was also the case with nivolumab monotherapy as second-line treatment, in which a survival benefit was observed across PD-L1 expression levels, and in contrast to published data for sunitinib that showed better outcomes in patients with lower PD-L1 expression levels.22,23
Three quarters of the patients with advanced renal-cell carcinoma have intermediate- or poor-risk clinical features.4 In this trial, 23% of the
patients had favorable prognostic risk. The favor-able-risk group had a higher objective response rate and longer progression-free survival with sunitinib than with nivolumab plus ipilimumab;
these differences did not translate into a signifi-cant survival advantage. These results in favorable-risk patients should be interpreted with caution because of the exploratory nature of the analysis, the small subgroup sample, and the immaturity of survival data. However, they highlight the need to better understand the underlying biologic pro-cesses driving responses to these two different treatment regimens.
The safety profile of nivolumab plus ipilim-umab was consistent with that in previous stud-ies in multiple tumor types, including advanced renal-cell carcinoma,10-12,14,24 with a lower
inci-dence of grade 3 and 4 treatment-related adverse events than observed with sunitinib. The frequen-cies of treatment-related gastrointestinal, skin, and hepatic adverse events were lower than those seen in a trial involving patients with melanoma, in which a higher dose of ipilimumab (3 mg per kilogram) and a lower dose of nivolumab (1 mg per kilogram) were used.13 Dose delays, treatment
with glucocorticoids, and prompt diagnostic work-up to rule out noninflammatory causes were used to manage toxic effects according to management
Figure 3. Health-Related Quality of Life in IMDC Intermediate- and Poor-Risk Patients.
Scores on the National Comprehensive Cancer Network Functional Assessment of Cancer Therapy–Kidney Symptom Index (FKSI-19) range from 0 to 76, with higher scores indicating fewer symptoms. Only time points for which data were available for five or more patients are shown. The number at risk shows the number of randomly assigned pa-tients who were in the trial at each respective time point. I bars indicate standard errors.
Mean Change from Baseline FKSI-19 Score
10 6 8 4 2 −2 −4 −8 0 7 9 5 3 1 −6 −3 −5 −9 −1 −7 −10 0 16 32 40 60 76 104 Week No. at Risk Nivolumab+ipilimumab Sunitinib 425422 281284 8 347 371 212184 24 239 221 180147 152113 52 166 127 13993 7643 68 143 104 84 125 80 88 92 108 64 96 100 12 28 36 56 72 4 20 44 48 64 80 44 26 Nivolumab+ipilimumab Sunitinib
algorithms developed for immuno-oncology
treat-ment-related adverse events.25 Patients reported
better health-related quality of life, as measured by the FKSI-19, with nivolumab plus ipilimumab than with sunitinib.
The approved standard dose of sunitinib was used in this trial, and the data compare favorably with those in previous phase 3 trials of sunitinib.2
Alternate sunitinib schedules, such as 2 weeks on followed by 1 week off, may influence efficacy outcomes, the adverse-event profile, and adher-ence to therapy, although data from randomized trials are lacking.26
Progress in first-line treatment of renal-cell carcinoma has led to regulatory approval of three antiangiogenic drugs and one mammalian target of rapamycin inhibitor, although approval was largely due to a benefit with respect to progres-sion-free survival rather than overall survival.27-31
Few studies thus far have been conducted to spe-cifically address the efficacy of these drugs as first-line therapy in intermediate- and poor-risk patients.4,32
This trial showed an efficacy and overall sur-vival benefit of nivolumab plus ipilimumab over sunitinib in the first-line treatment of interme-diate- or poor-risk advanced clear-cell renal-cell carcinoma.
Supported by Bristol-Myers Squibb and Ono Pharmaceutical. The authors received no financial support or compensation for publication of this manuscript. Patients treated at the Memorial Sloan Kettering Cancer Center were supported in part by a Me-morial Sloan Kettering Cancer Center Support Grant/Core Grant (P30 CA008748).
Dr. Motzer reports receiving grant support and consulting fees from Pfizer, Novartis, Eisai, and Exelixis and grant support from Genentech/Roche; Dr. Tannir, receiving grant support, consulting fees, and honoraria from Bristol-Myers Squibb, re-ceiving grant support from Epizyme and Mirati Therapeutics, receiving grant support, consulting fees, and honoraria from and serving on an advisory board for Exelixis and Novartis, re-ceiving consulting fees and honoraria from Argos Therapeutics and Pfizer, and receiving consulting fees and honoraria from and serving on an advisory board for Eisai, Nektar, and On-corena; Dr. McDermott, receiving honoraria and consulting fees from Bristol-Myers Squibb, Pfizer, Merck, Novartis, Eisai, Exe-lixis, Array BioPharma, and Genentech BioOncology and grant support from Prometheus Laboratories; Dr. Melichar, receiving advisory board fees and lecture fees from Bristol-Myers Squibb, Merck, Merck Sharp & Dohme, Roche, Novartis, Astellas Phar-ma, Pfizer, and Bayer; Dr. Choueiri, receiving grant support, paid to his institution, consulting fees, and advisory fees from AstraZeneca, Bristol-Myers Squibb, Exelixis, Genentech, Merck, Novartis, Peloton Therapeutics, Pfizer, Roche, and Eisai, grant support, paid to his institution, from Tracon Pharmaceuticals, and consulting fees and advisory fees from Bayer, Cerulean Pharma, Foundation Medicine, GlaxoSmithKline, Prometheus Laboratories, and Corvus Pharmaceuticals; Dr. Plimack, receiving grant support, paid to her institution, from Acceleron Pharma,
AstraZeneca, Aveo Pharmaceuticals, Bristol-Myers Squibb, Den-dreon, Eli Lilly, GlaxoSmithKline, Merck, Peloton Therapeutics, and Pfizer, receiving consulting fees from Acceleron Pharma, Astellas Pharma, AstraZeneca, Bristol-Myers Squibb, Clovis On-cology, Dendreon, Eli Lilly, Exelixis, Genentech/Roche, Glaxo-SmithKline, Horizon Pharma, Inovio Pharmaceuticals, Merck, Novartis, Pfizer, and SynerGene Therapeutics, receiving fees for the development of educational presentations from Bristol- Myers Squibb, Merck, Novartis, and Roche, holding a pending patent (14/588,503) on methods for screening patients with muscle-invasive bladder cancer for neoadjuvant chemotherapy responsiveness, and holding a pending patent (15/226,474) on the combination of an immunomodulatory agent with PD-1 or PD-L1 checkpoint inhibitors in the treatment of cancer; Dr. Barthélémy, receiving advisory board fees from Bristol-Myers Squibb, Pfizer, Novartis, Roche, Ipsen, and Sanofi; Dr. Porta, receiving consulting fees and lecture fees from Bristol-Myers Squibb, Novartis, Ipsen, Eisai, and EUSA Pharma, grant sup-port, consulting fees, and lecture fees from Pfizer, and consult-ing fees from Janssen; Dr. George, receivconsult-ing consultconsult-ing fees from AstraZeneca, Exelixis, and Janssen, grant support and consulting fees from Bayer, Bristol-Myers Squibb, Corvus Phar-maceuticals, Novartis, and Pfizer, and grant support from Cell-dex Therapeutics and Merck; Dr. Powles, receiving grant support and honoraria from AstraZeneca and Roche, grant support from Novartis, and honoraria from Bristol-Myers Squibb, Merck, and Pfizer; Dr. Donskov, receiving grant support from Pfizer and Novartis; Dr. Kollmannsberger, receiving advisory board fees and honoraria from Bristol-Myers Squibb and Pfizer; Dr. Gur-ney, receiving advisory board fees from Bristol-Myers Squibb, Merck Sharp & Dohme, Roche, and AstraZeneca and grant sup-port and advisory board fees from Pfizer; Dr. Hawkins, receiv-ing lecture fees from Novartis, Ipsen and Pfizer, lecture fees and travel support from Bristol-Myers Squibb, and royalties for a patent (WO 90/05144) on the phage antibody patent family col-lectively known as Winter II; Dr. Ravaud, receiving grant sup-port, advisory board fees, and travel support from Pfizer, advi-sory board fees and travel support from Bristol-Myers Squibb, travel support from Novartis and Merck Sharp & Dohme, and advisory board fees from Roche; Dr. Grimm, receiving grant support, consulting fees, and lecture fees from Novartis and Bristol-Myers Squibb, consulting fees and lecture fees from Pfizer, Bayer HealthCare, and AstraZeneca, lecture fees from Astellas Pharma, Hexal, and Apogepha, and consulting fees from Intuitive Surgical, Sanofi-Aventis, Amgen, Merck Sharp & Dohme, and MedUpdate; Dr. Bracarda, receiving consulting fees, lecture fees, and travel support from Pfizer, Astellas Phar-ma, Bristol-Myers Squibb, Roche, and Janssen, travel support from Novartis and Bayer, consulting fees and travel support from Ipsen, and consulting fees from EUSA Pharma and Merck Sharp & Dohme; Dr. Barrios, receiving grant support and con-sulting fees from Novartis, Boehringer Ingelheim, GlaxoSmith-Kline, Roche, and Pfizer, grant support from Amgen, AstraZen-eca, Taiho Pharmaceutical, Eli Lilly, Sanofi, Mylan, Merrimack Pharmaceuticals, Merck, AbbVie, Astellas Pharma, BioMarin Pharmaceutical, Bristol-Myers Squibb, Daiichi Sankyo, Abraxis BioScience, Asana BioSciences, AB Science, Medivation, Exelixis, ImClone, LEO Pharma, Millennium Pharmaceuticals, and con-sulting fees from Eisai; Dr. Tomita, receiving grant support and honoraria from Astellas Pharma and Pfizer, grant support from AstraZeneca, honoraria from Bristol-Myers Squibb, honoraria and consulting fees from Novartis, grant support, honoraria, and consulting fees from Ono Pharmaceutical, and consulting fees from Taiho Pharmaceutical; Dr. Rini, receiving grant sup-port, paid to his institution, and consulting fees from Bristol-Myers Squibb; Dr. Chen, being employed by Bristol-Bristol-Myers Squibb; Drs. Mekan, McHenry, and Wind-Rotolo and Mr. Doan, being employed by and owning stock in Bristol-Myers Squibb; Dr. Sharma, owning stock in Jounce Therapeutics, Kite Pharma,
Constellation Pharmaceuticals, and Neon Therapeutics and re-ceiving consulting fees from Merck and Astellas Pharma; and Dr. Escudier, receiving honoraria from Bayer, Novartis, Pfizer, Exelixis, and Roche. No other potential conflict of interest rele-vant to this article was reported.
Disclosure forms provided by the authors are available with the full text of this article at NEJM.org.
We thank the patients and their families for making this trial possible; Paul Gagnier, the initial medical monitor; Jennifer Mc-Carthy, the CheckMate 214 protocol manager; the staff at Dako for collaborative development of the PD-L1 IHC 28-8 pharmDx assay; and Jennifer Granit and Lawrence Hargett of PPSI (a Par-exel company) for professional medical writing and editorial as-sistance with an earlier version of the manuscript.
Appendix
The authors’ full names and academic degrees are as follows: Robert J. Motzer, M.D., Nizar M. Tannir, M.D., David F. McDermott, M.D., Osvaldo Arén Frontera, M.D., Bohuslav Melichar, M.D., Ph.D., Toni K. Choueiri, M.D., Elizabeth R. Plimack, M.D., Philippe Barthélémy, M.D., Ph.D., Camillo Porta, M.D., Saby George, M.D., Thomas Powles, M.D., Frede Donskov, M.D., Ph.D., Victoria Nei-man, M.D., Christian K. Kollmannsberger, M.D., Pamela SalNei-man, M.D., Howard Gurney, M.D., Robert Hawkins, M.D., Alain Ravaud, M.D., Ph.D., Marc-Oliver Grimm, M.D., Sergio Bracarda, M.D., Carlos H. Barrios, M.D., Yoshihiko Tomita, M.D., Ph.D., Daniel Castel-lano, M.D., Brian I. Rini, M.D., Allen C. Chen, M.D., Sabeen Mekan, M.D., M. Brent McHenry, Ph.D., Megan Wind-Rotolo, Ph.D., Justin Doan, M.Sc., M.P.H., Padmanee Sharma, M.D., Ph.D., Hans J. Hammers, M.D., Ph.D., and Bernard Escudier, M.D.
The authors’ affiliations are as follows: Memorial Sloan Kettering Cancer Center, New York (R.J.M.), and Roswell Park Cancer Insti-tute, Buffalo (S.G.) — both in New York; University of Texas M.D. Anderson Cancer Center, Houston (N.M.T., P. Sharma); Beth Israel Deaconess Medical Center, Dana–Farber/Harvard Cancer Center (D.F.M.), and Dana–Farber Cancer Institute, Brigham and Women’s Hospital, and Harvard Medical School (T.K.C.), Boston; Centro Internacional de Estudios Clínicos (O.A.F.) and Fundación Arturo López Pérez (P. Salman), Santiago, Chile; Palacký University and University Hospital Olomouc, Olomouc, Czech Republic (B.M.); Fox Chase Cancer Center, Philadelphia (E.R.P.); Hôpitaux Universitaires de Strasbourg, Strasbourg (P.B.), Bordeaux University Hospital, Hôpital Saint-André, Bordeaux (A.R.), and Institut Gustave Roussy, Villejuif (B.E.) — all in France; Istituto di Ricovero e Cura a Carattere Sci-entifico San Matteo University Hospital Foundation, Pavia (C.P.), and Ospedale San Donato, Azienda Unità Sanitaria Locale Toscana Sud-Est, Istituto Toscano Tumori, Arezzo (S.B.) — both in Italy; Barts Cancer Institute, Cancer Research UK Experimental Cancer Medicine Centre, Queen Mary University of London, Royal Free NHS Trust (T.P.), and Cancer Research UK (R.H.), London; Aarhus University Hospital, Aarhus, Denmark (F.D.); Davidoff Cancer Center, Rabin Medical Center, Petah Tikva, and Tel Aviv University, Tel Aviv — both in Israel (V.N.); British Columbia Cancer Agency, Vancouver, Canada (C.K.K.); Westmead Hospital and Macquarie Univer-sity, Sydney (H.G.); Jena University Hospital, Jena, Germany (M.-O.G.); Centro de Pesquisa em Oncologia, Hospital São Lucas, Porto Alegre, Brazil (C.H.B.); Niigata University, Niigata, Japan (Y.T.); Hospital Universitario 12 de Octubre, Madrid (D.C.); Cleveland Clinic Taussig Cancer Institute, Cleveland (B.I.R.); Bristol-Myers Squibb, Princeton, NJ (A.C.C., S.M., M.B.M., M.W.-R., J.D.); and Johns Hopkins Sidney Kimmel Comprehensive Cancer Center, Baltimore (H.J.H.).
References
1. Motzer RJ, Jonasch E, Agarwal N, et al. Kidney cancer, version 2.2017, NCCN clinical practice guidelines in oncology. J Natl Compr Canc Netw 2017; 15: 804-34.
2. Motzer RJ, Hutson TE, Cella D, et al. Pazopanib versus sunitinib in metastatic renal-cell carcinoma. N Engl J Med 2013; 369: 722-31.
3. Choueiri TK, Motzer RJ. Systemic ther-apy for metastatic renal-cell carcinoma. N Engl J Med 2017; 376: 354-66.
4. Heng DY, Xie W, Regan MM, et al. Prognostic factors for overall survival in patients with metastatic renal cell carci-noma treated with vascular endothelial growth factor-targeted agents: results from a large, multicenter study. J Clin Oncol 2009; 27: 5794-9.
5. Heng DY, Xie W, Regan MM, et al. Ex-ternal validation and comparison with other models of the International Meta-static Renal-Cell Carcinoma Database Consortium prognostic model: a popula-tion-based study. Lancet Oncol 2013; 14: 141-8.
6. Topalian SL, Hodi FS, Brahmer JR, et al. Safety, activity, and immune correlates of anti–PD-1 antibody in cancer. N Engl J Med 2012; 366: 2443-54.
7. Opdivo (nivolumab) injection for in-travenous use (prescribing information). Princeton, NJ: Bristol-Myers Squibb, 2017.
8. Yervoy (ipilimumab) injection for
in-travenous use (prescribing information). Princeton, NJ: Bristol-Myers Squibb, 2017.
9. Yang JC, Hughes M, Kammula U, et al. Ipilimumab (anti-CTLA4 antibody) causes regression of metastatic renal cell cancer associated with enteritis and hypophysi-tis. J Immunother 2007; 30: 825-30.
10. Antonia SJ, López-Martin JA, Bendell J, et al. Nivolumab alone and nivolumab plus ipilimumab in recurrent small-cell lung cancer (CheckMate 032): a multicen-tre, open-label, phase 1/2 trial. Lancet Oncol 2016; 17: 883-95.
11. Hammers HJ, Plimack ER, Infante JR, et al. Safety and efficacy of nivolumab in combination with ipilimumab in meta-static renal cell carcinoma: the Check-Mate 016 study. J Clin Oncol 2017; 35: 3851-8.
12. Hellmann MD, Rizvi NA, Goldman JW, et al. Nivolumab plus ipilimumab as first-line treatment for advanced non-small-cell lung cancer (CheckMate 012): results of an open-label, phase 1, multico-hort study. Lancet Oncol 2017; 18: 31-41.
13. Larkin J, Chiarion-Sileni V, Gonzalez R, et al. Combined nivolumab and ipilim-umab or monotherapy in untreated mela-noma. N Engl J Med 2015; 373: 23-34.
14. Wolchok JD, Kluger H, Callahan MK, et al. Nivolumab plus ipilimumab in ad-vanced melanoma. N Engl J Med 2013; 369: 122-33.
15. Eisenhauer EA, Therasse P, Bogaerts J, et al. New response evaluation criteria in solid tumours: revised RECIST guideline (version 1.1). Eur J Cancer 2009; 45: 228-47.
16. Schag CC, Heinrich RL, Ganz PA. Karnofsky performance status revisited: reliability, validity, and guidelines. J Clin Oncol 1984; 2: 187-93.
17. Rao D, Butt Z, Rosenbloom S, et al. A comparison of the Renal Cell Carcinoma-Symptom Index (RCC-SI) and the Func-tional Assessment of Cancer Therapy-Kidney Symptom Index (FKSI). J Pain Symptom Manage 2009; 38: 291-8.
18. Rothrock NE, Jensen SE, Beaumont JL, et al. Development and initial valida-tion of the NCCN/FACT symptom index for advanced kidney cancer. Value Health 2013; 16: 789-96.
19. National Cancer Institute. Common Terminology Criteria for Adverse Events (CTCAE), version 4.0. June 14, 2010 (http:// ctep .cancer .gov/ protocolDevelopment/ electronic_applications/ ctc .htm#ctc_40).
20. Clopper CP. ES. The use of confidence or fiducial limits illustrated in the case of the binomial. Biometrika 1934; 26: 404-14.
21. Escudier B, Szczylik C, Hutson TE, et al. Randomized phase II trial of first-line treatment with sorafenib versus interfer-on alfa-2a in patients with metastatic re-nal cell carcinoma. J Clin Oncol 2009; 27: 1280-9.
22. Motzer RJ, Escudier B, McDermott DF, et al. Nivolumab versus everolimus in advanced renal-cell carcinoma. N Engl J Med 2015; 373: 1803-13.
23. Choueiri TK, Figueroa DJ, Fay AP, et al. Correlation of PD-L1 tumor expression and treatment outcomes in patients with renal cell carcinoma receiving sunitinib or pazopanib: results from COMPARZ, a randomized controlled trial. Clin Cancer Res 2015; 21: 1071-7.
24. Hodi FS, Chesney J, Pavlick AC, et al. Combined nivolumab and ipilimumab ver-sus ipilimumab alone in patients with ad-vanced melanoma: 2-year overall survival outcomes in a multicentre, randomised, controlled, phase 2 trial. Lancet Oncol 2016; 17: 1558-68.
25. Robert C, Long GV, Brady B, et al.
Nivolumab in previously untreated mela-noma without BRAF mutation. N Engl J Med 2015; 372: 320-30.
26. Kalra S, Rini BI, Jonasch E. Alternate sunitinib schedules in patients with met-astatic renal cell carcinoma. Ann Oncol 2015; 26: 1300-4.
27. Motzer RJ, Hutson TE, Tomczak P, et al. Sunitinib versus interferon alfa in meta-static renal-cell carcinoma. N Engl J Med 2007; 356: 115-24.
28. Escudier B, Pluzanska A, Koralewski P, et al. Bevacizumab plus interferon alfa-2a for treatment of metastatic renal cell carcinoma: a randomised, double-blind phase III trial. Lancet 2007; 370: 2103-11.
29. Rini BI, Halabi S, Rosenberg JE, et al. Bevacizumab plus interferon alfa com-pared with interferon alfa monotherapy
in patients with metastatic renal cell car-cinoma: CALGB 90206. J Clin Oncol 2008; 26: 5422-8.
30. Sternberg CN, Davis ID, Mardiak J, et al. Pazopanib in locally advanced or meta-static renal cell carcinoma: results of a randomized phase III trial. J Clin Oncol 2010; 28: 1061-8.
31. Hudes G, Carducci M, Tomczak P, et al. Temsirolimus, interferon alfa, or both for advanced renal-cell carcinoma. N Engl J Med 2007; 356: 2271-81.
32. Choueiri TK, Halabi S, Sanford BL, et al. Cabozantinib versus sunitinib as initial targeted therapy for patients with meta-static renal cell carcinoma of poor or in-termediate risk: the Alliance A031203 CABOSUN trial. J Clin Oncol 2017; 35: 591-7.
Copyright © 2018 Massachusetts Medical Society.
ARTICLE METRICS NOW AVAILABLE
Visit the article page at NEJM.org and click on Metrics to view comprehensive and cumulative article metrics compiled from multiple sources, including Altmetrics.