ISSN 1479-4411 34 ©ACPIL Reference this paper: de Felice, A., Biscione, A., and Martucci, I., 2019. Knowledge and Innovation: an Empirical Analysis of
Organization in the Baltic Countries
Annunziata de Felice¹, Antonella Biscione² and Isabella Martucci¹
¹Department of Law. University of Bari Aldo Moro. Bari. Italy
²Department of Bioeconomic Strategies in the European Union and in the Balkans, Catholic
University “Our Lady of Good Counsel”
[email protected]
[email protected]
[email protected]
Abstract: The aim of this paper is to investigate the relationship between firm’s innovation and knowledge sources in Baltic
countries. We focus on Estonia, Latvia and Lithuania, since for these countries, the relationship between innovation and knowledge is unexplored from an empirical point of view. There is a theoretical background on the different types of knowledge that influence a firm’s innovation level. By using firm-level data of the Community Innovation Survey (CIS 2014), we observe this relationship in the specific sub-category of the manufacturing sector in Baltic countries, and consider a range of control variables. Our findings highlight a positive and consistent relationship between knowledge sources and innovation.
Keywords: knowledge, innovation, Baltic Countries, manufacturing sector
1. Introduction
In recent years, there has been increased attention, among scholars and policy-makers, to the role played by different knowledge sources in the creation of innovation. Several studies have highlighted how knowledge is associated with innovation (see among others Nonaka and Takeuchi, 1995; Van den Bergh, 2008; Schoenmakers and Duysters, 2010).
In order to remain competitive, a firm must be innovative otherwise it is destined to disappear (Abbing, 2010; Cho and Pucik, 2005; Zawislak et. al., 2012). In other words, the firm requires constant innovative actions to increase its competitiveness and maintain its market share. Moreover, the competitiveness is closely linked to the process of knowledge accumulation (de Felice et al. 2012). The capacity of accumulation of knowledge that produces innovation is strictly connected to the acquired competences and, above all, to those reached through the research and networks.
These relationships are stressed by knowledge-based literature (Camuffo and Grandinetti, 2006, 2011; Maskell, 2001; Grandinetti and Tabacco, 2003; Rullani, 2003) and relational literature (Wasserman and Faust, 1994; Powell, 1990; Giuliani and Bell, 2005; Ter Wal, 2013 e.g.).
In particular, one part of the literature emphasizes the importance of “open innovation” (Chesbrough, 2003, 2006) or of the integration between external and internal knowledge in a firm to promote innovation. The external relationship with suppliers, competitors, clients and university becomes essential to develop new products or new processes (Powell and Grodal, 2005; Huggins, 2010; Athaide and Zhang, 2011). Knowledge management plays a key role, using new methods of organizing external relations with other firms or public institutions (i.e. use of alliances, partnerships, outsourcing or sub-contracting), establishing new business practices for organizing procedures (i.e. supply chain management, business reengineering, lean production, quality management, etc.) and/or putting in place new methods of organizing work responsibilities and decision making.
In the light of these considerations, in this paper we provide an empirical contribution on the relationship between knowledge and innovation using firm-level data provided by the Community Innovation Survey (CIS 2014) based on the Oslo Manual (OECD, 2005) in the specific sub-categories of the manufacturing sector in the Baltic countries. First of all, we examine the companies of three countries considering them as one economy.
Then, we observe the relationship between firm’s innovation and knowledge in the three countries in order to underline their differences.
We exploit a baseline regression and eventually we present some robustness tests. For sake of robustness, we employ two different innovations: product and process.
In sum, results show that knowledge sources are positively and significantly associated with innovation. In other words, knowledge appears to increase innovation. This result appears to be robust across different specifications. However, other contradictory results are also worth noting. For example, knowledge management appears to have no effects when considering the three countries as one economy.
The paper is structured as follows. In the next section, we focus on the literature review and conceptual background of innovation and its determinants. The third section describes the data and the methodology; the results are discussed in the fourth section, followed by the conclusions in the fifth.
2. Literature and Conceptual Background
In this section we try to expound the conceptual background of this work by surveying the existing literature on the linkage between innovation and knowledge sources.
The literature on innovation proposes a plethora of definitions, classifications, types and determinants of innovation. According to Schumpeter (1971, 1977) innovation is a process of creative destruction or “new combinations” of existing resources, involving the introduction of new goods and/or new production processes to create a new organization, a new trade, or a new form of marketing which results in access to a new supply source of raw or semi-finished materials in a new industrial organization. This technological change concerns not only the firms and the users, as technology sellers and buyers, respectively, but also public institutions; each of them, with their experience, contributing to the technological changes.
A part of the literature (Van Dijk et al., 1997; Schumpeter, 1971) highlights that large firms could be more innovative compared to small ones: the large ones having the market power and large profits necessary to finance R&D. Other studies (Cohen and Levinthal, 1990; Romer, 1990; Van Dijk et al., 1997) observe the innovation of small firms, which benefit from public funding and from local markets.
Cohen and Levinthal, 1990; Romer, 1990; Van Dijk et al., 1997; Kang and Park, 2012 emphasize the importance of public funds for small firms in order to be more innovative.
It is important to point out that even if firms are characterized by size, they do not innovate at the same time nor do they make the same type of innovation.
A great number of empirical analyses provide evidence that knowledge is the driving force of innovation, particularly, the tacit dimension as well as the external and internal relationship within the organization (Nelson and Winter, 1982; Nonaka and Takeuchi, 1995; de Felice et al., 2012; Tsai, 2001). These relations allow innovation to develop within a firm’s organizational structure. Significant are the channels of knowledge transfer such as local institutions, associations and university or research centers, to create innovation (Rigby et al., 2002; Camuffo and Grandinetti, 2006, 2011; Landry et al., 2002; Barrutia and Echebarria, 2010).
Firms should combine external relationships and networks with their internal knowledge to develop innovation (Chesbrough, 2003, 2006; Chiaroni et al., 2011; Martin-de Castro, 2015). So, the firm’s knowledge management is crucial to complement external and internal knowledge in its organization (Probst et al., 2002). The firm’s internal resources are important in order to benefit from external knowledge. This idea is based on absorptive capacity theory that show the important role of technological and organizational dimensions (Cohen and Levinthal, 1990; Zhara and George, 2002) in order to acquire, integrate and develop the external knowledge (Granero et al., 2014).
In addition, to internalize technical knowledge and technology, foreign direct investment (FDI) is crucial, since this is a source of external technological knowledge (Buckley and Kafouros, 2008, Erdal and Gocer, 2015; Crescenzi et al, 2015). The effect of FDI on local firms is not always positive (Nam et al.,2012), in fact, the
positive effects of FDI in the host country depends on the firms’ absorptive capacity of the external knowledge available by FDI inflows (Banri et. al., 2012).1
As in Baltic Countries there are few descriptive analyses, this paper can be considered as an empirical contribution that takes into account only these three countries.
3. Data and Methodology
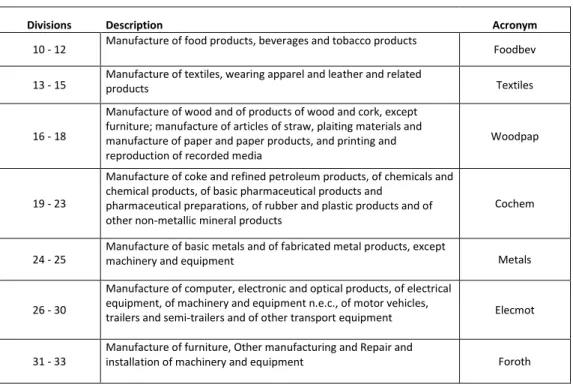
The aim of this study is to explore how the channels of knowledge transfer – external and/or internal – created innovation over the period covered by the CIS survey (2012-2014) for the Baltic countries. We focus on product and process in the manufacturing sector.2 We observe if this relationship is different and/or similar for different manufacturing sub-sectors (from C10 to C33) classified according to the taxonomies of the standard Eurostat classifications (NACE Rev.2). (Table 1)
Table 1
:
NACE sample classificationDivisions Description Acronym
10 - 12 Manufacture of food products, beverages and tobacco products Foodbev 13 - 15 Manufacture of textiles, wearing apparel and leather and related products Textiles
16 - 18
Manufacture of wood and of products of wood and cork, except furniture; manufacture of articles of straw, plaiting materials and manufacture of paper and paper products, and printing and reproduction of recorded media
Woodpap
19 - 23
Manufacture of coke and refined petroleum products, of chemicals and chemical products, of basic pharmaceutical products and
pharmaceutical preparations, of rubber and plastic products and of other non-metallic mineral products
Cochem
24 - 25
Manufacture of basic metals and of fabricated metal products, except
machinery and equipment Metals
26 - 30
Manufacture of computer, electronic and optical products, of electrical equipment, of machinery and equipment n.e.c., of motor vehicles,
trailers and semi-trailers and of other transport equipment Elecmot
31 - 33
Manufacture of furniture, Other manufacturing and Repair and
installation of machinery and equipment Foroth
We study this relationship in the Baltic area considering it as one economy, although in fact the three countries each have a unique history. Together they became independent, were invaded by the Soviets, later by the Nazis and then again by the Soviets. Together they regained independence and entered the EU and NATO. They have a similar territorial and demographic weight too. Baltic countries are characterized by common features such as similar history and economic structure, which gradually converges to the standards of the European Western countries and they are specialized in low-tech productions, but, each country has its peculiar economic characteristics. In fact, Estonia is the most developed with a GDP per capita of 76% of the EU28 average in purchasing power parity; Latvia has a GDP per capita of 64% of the EU28 average being less influenced by regional spillovers; Lithuania, although presenting a larger territorial extension than the other two countries, has a GDP per capita the same as Estonia (Poissonier, 2017).
The great recession beginning in 2007 in the USA influenced all three Countries, although Latvia was the most affected. The Baltic Countries all specialize in wood and paper products as well as furniture and textiles, with
1
In Lithuania, manufacturing sector employed for 27.6% the FDI which, in 2014, mainly derived from Sweden, followed by the Netherlands and Poland (Lithuanian Statistical Office). 84% of FDI in Estonia (Estonia Statistical Office) also come from Sweden, followed by Finland (22.3%) and the Netherlands (8%), while Estonian IDEs are headed to Lithuania (23.3%, Cyprus and Latvia (18%) Latvia, on the other hand, has known an increase in FDI of 3.7% compared to the previous year (Latvia Statistical Office).
2
The distinction between a product and a process innovation is crucial in order to identify the different firms’ strategy. Product innovation is associated with more radical strategies; process innovation prevails in small and traditional firms.
other areas of specialization including the food sector and pharmaceutical industry in Latvia; the food sector and chemicals in Lithuania; and oil, electronics and electrical equipment in Estonia (Poissonier, 2017).
Due to its proximity, Estonia has important relationships with Finland and has become a country where the tech sector is important. Estonia also adopted the Euro in 2011. Lithuania maintains a stronger relationship with Poland and Central Europe and adopted the Euro in 2015. Latvia occupies a strategic position and acts as a transit route, connecting the Western and Scandinavian countries with Russia and the other ex-Soviet republics. Latvia adopted the Euro in 2014. For this reason, we also analyze this relationship country by country.
For this purpose, we use data from the Community Innovation Survey (CIS), a survey about innovation activities in enterprises covering European Countries and we refer to CIS14 (2012-2014). In order to compare the evolution of firms in the manufacturing sector, Eurostat develops a standard questionnaire accompanied by a set of definitions and methodological recommendations also based on the Oslo Manual (2005).
The surveys provide information about a sample of 2449 firms. The sample for each Baltic Country is divided in the following way: (i) in Estonia there are 941 firms; (ii) in Latvia 532 firms and, finally, (iii) in Lithuania 976 firms (Table 2). These firms have 10 employees or more.
Table 2: Observations number of the firm for NACE divisions in manufacturing sector
Latvia Lithuania Estonia
2014 2014 2014
divisions Freq. Obs. Freq. Obs. Freq. Obs.
10 - 12 329 82 473 94 185 112 13 - 15 214 56 397 95 200 129 16 - 18 577 110 626 155 300 150 19 - 23 216 99 367 204 161 134 24 - 25 210 55 289 117 268 86 26 - 30 147 81 231 173 190 166 31 - 33 243 49 542 138 233 164 Total 1936 532 2925 976 1538 941
Source: our elaboration on data CIS 2014
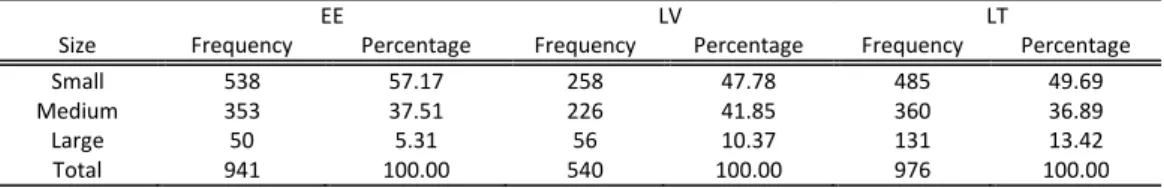
Table 3 shows the distribution of firms in Baltic Countries by size based on CIS data. In all three countries most of them (57.17% in Estonia; 47.78% in Latvia; 49.69% in Lithuania) are small-sized firms, the others are medium-and large-sized firms (42.82% in Estonia; 52.22% in Latvia; 50.31% in Lithuania).
Table 3: Distribution of firms by their size and Countries
EE LV LT
Size Frequency Percentage Frequency Percentage Frequency Percentage
Small 538 57.17 258 47.78 485 49.69
Medium 353 37.51 226 41.85 360 36.89
Large 50 5.31 56 10.37 131 13.42
Total 941 100.00 540 100.00 976 100.00
Source:our elaboration on data CIS 2014
Table 4 reveals the incidence of innovation by firm type. Product and process innovation is contextually diffused among medium firms in all three countries (8.18% and 7.65% in Estonia; 13.14 and 12.22% in Latvia; 14.45% and 19.67 in Lithuania, respectively).
Table 4: Incidence of Innovation by firm dimension (%)
EE LV LT
Size Product Process Product Process Product Process
Small 6.81 5.53 7.60 5.18 11.47 13.62
Medium 8.18 7.65 13.14 12.22 14.45 19.67
Large 1.80 2.34 4.26 4.63 8.71 9.84
Total 15.72 15.51 25.00 22.03 34.63 43.14
Source:our elaboration on data CIS 2014
In addition, all three Baltic countries and all divisions of the manufacturing sector (Table 5) present a good performance in innovation activities both in product and process. Particularly, Lithuania has seen the most important value in product and process innovation in 2014.
Table 5: Innovation in manufacturing sub-sector
Product Innovation Process Innovation
LV LT EE LV LT EE Divisions % % % % % % 10 - 12 17.88 39.51 30.92 14.27 42.41 22.52 13 - 15 5.70 30.96 6.17 5.23 27.10 8.88 16 - 18 4.30 11.91 10.73 11.01 24.74 18.54 19 - 23 16.94 22.57 14.03 17.59 34.81 13.62 24 - 25 11.02 29.88 11.17 9.71 39.13 8.85 26 - 30 28.12 42.67 18.77 23.20 47.10 15.24 31 - 33 9.84 19.82 10.44 5.54 31.06 11.76 Total 11.40 25.97 13.94 11.75 33.54 14.12
Source: our elaboration on data CIS 2014
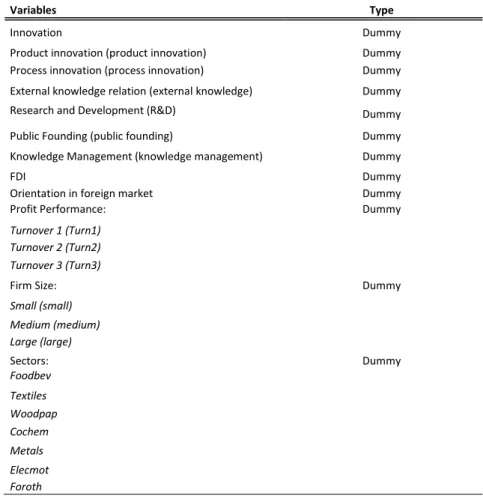
Table 6 shows the variables employed in this analysis. Table 4: Variables used in the econometrics analysis
Variables Type
Innovation Dummy
Product innovation (product innovation) Dummy
Process innovation (process innovation) Dummy
External knowledge relation (external knowledge) Dummy
Research and Development (R&D) Dummy
Public Founding (public founding) Dummy
Knowledge Management (knowledge management) Dummy
FDI Dummy
Orientation in foreign market Dummy
Profit Performance: Dummy
Turnover 1 (Turn1) Turnover 2 (Turn2) Turnover 3 (Turn3)
Firm Size: Dummy
Small (small) Medium (medium) Large (large) Sectors: Dummy Foodbev Textiles Woodpap Cochem Metals Elecmot Foroth
The dataset provides detailed firm-level information not only on innovation behaviors by type of enterprise and by sector, but also on various aspects of the development of an innovation, such as objectives, sources of knowledge and information, public funding or expenditure. It is important to point out that the dataset used has some limitations, therefore we use dichotomous variables in order to bypass these restrictions.
Innovation is the dependent variable. In our analysis we considered the Schumpeterian definition of innovation described in the theoretical framework.
It includes the technological innovation or the introduction of new products (product innovation) and new processes (process innovation) by a firm of the sample. For these variables we use a binary indicator because we distinguish between innovative firms (1) and non-innovative firms (0).
When we refer to product innovative firms, we consider firms which introduced a new or significantly improved good or service.
For process innovative firms we include firms which have carried out one of the follow strategies:
1. Introduction of new or significantly improved methods of manufacturing or producing goods or services;
2. introduction of new or significantly improved logistics, delivery or distribution methods for firm’s inputs, goods or services;
3. New or significantly improved supporting activities for firm’s processes, such as maintenance. According to the theoretical part, the most important independent variable that we have selected is the knowledge. Knowledge is distinguished as external relations knowledge (external knowledge) and knowledge management (KM).
We define external relations knowledge as the tacit/explicit dimension of knowledge that are sourced or derived from cooperation in innovation activities through external and distance relationships. We include in this variable cooperation arrangements with other enterprises, suppliers, clients, competitors, consultants, institutions, universities and research institutes located in the same country and/or in Europe, in EFTA Countries, in EE-CC, in the United States, in China, India, and in other countries. These relationships are external and geographically distant. We use a dummy variable which isequal to 1 if a firm has cooperated with at least one different external partner for each category.
We use knowledge management as a firm’s innovation capabilities depend on the intellectual assets and knowledge that managers have (Subramaniam and Youndt, 2005). Knowledge management also has the role of sharing the tacit or codified dimension of knowledge in the firm or in the enterprise group through face to face interactions (Koskinen et al., 2003) and though social interactions (Nonaka and Takeuchi, 1995).
Using the CIS14 questionnaire, we construct the knowledge management variable. It is equal to 1 if a firm, over the period 2012-2014, organized external relations with stakeholders, or/and it established new business practices for organizing procedures and/or it used new methods for organizing work responsibilities and decision making.
In order to innovate, another important variable is expenditure in R&D or the innovative effort. This represents the commitment to innovation (OECD, 2005; Malerba, 2005) and catches firms’ absorptive capacity (Cohen and Levinthal, 1990; Aghion and Jaravel, 2015). Relying on the CIS, we have considered the research activity in internal or in-house activities that create new knowledge or solve scientific or technical problems and external R&D that the firm has contracted out to other enterprises. We use a dummy which is equal to 1 if the firm invests in R&D.
In the Baltic Countries an important role is played by public funding to support the innovation activity. This support comes from local or regional authorities; central government; the European Union or the EU 7th Framework Programme. It is a dummy variable which is equal to 1 if the firm has received at last one amount of public funding among these institutions. We include other important regressors including firm size, profit performance, orientation in foreign markets, FDI, and firm sectors, because these are some of the innovation
determinants generally used in empirical studies (i.e. Acs and Audretsch, 1988; Kleinknecht, 1989; Shefer and Frenkel, 2005; Martinez-Ros and Labeaga, 2010).
With reference to the firm size, CIS does not provide the exact number of employees, but rather a range and firms with less than 10 employees are excluded from the sample. The size classes used with the correspondent value is the following: 0 if the firm has 10-49 employees (small); 1 if the firm has 50-249 employees (medium); 2 if the firm has more than 250 employees (large).
The profit performance of the firm is measured by turnover growth rate. We expect that high levels of performance can facilitate growth and subsequent profit performance (Price et al. 2013) and innovation. We distinguish three categorical variables: turnover 1 if the firms have a turnover growth rate negative or equal to 0, turnover 2 if the firms have a turnover growth rate between 0.1 and 1 and turnover 3 if the firms have a turnover growth rate more than 1.
Another important variable is the orientation in the foreign markets that we define as the export propensity of the firm. Recent empirical studies have studied the relationship between exports and innovation comparing the export performance of innovative and non-innovative firms (Castellani and Zanfei, 2007; Cassiman and Golovko, 2011; Hwang and Dong 2015; Lopez-Bazo and Motellòn, 2013). According to Choi (2015) exporting firms tend to invest more in product and process innovation. We construct this dimension as a dummy variable of 1 if the firm sells goods/services in local, National, EU and extra EU market.
In our analysis, we consider the sector variable as having a significant influence on innovation activities. For this reason, we have distinguished the sectors according to the NACE classification (see Table 1).
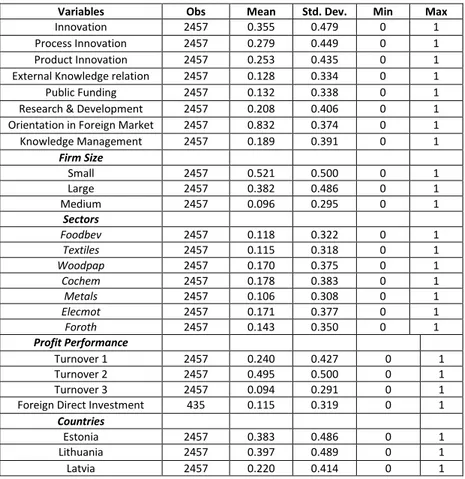
Also the foreign direct investment (FDI) is considered as an important determinant for innovation, and is defined “as a form of inter-firm cooperation that involves a significant equity stake in, or effective management control of foreign enterprise” (Erdal et al., 2002). It is a dummy and its value is 1 if in the three Baltic countries there are branches and contextually there are patents. Table 6 presents the set of variables used, Table 7 shows the descriptive statistics.
Table 7: Descriptive Statistics
Variables Obs Mean Std. Dev. Min Max
Innovation 2457 0.355 0.479 0 1
Process Innovation 2457 0.279 0.449 0 1
Product Innovation 2457 0.253 0.435 0 1
External Knowledge relation 2457 0.128 0.334 0 1
Public Funding 2457 0.132 0.338 0 1
Research & Development 2457 0.208 0.406 0 1
Orientation in Foreign Market 2457 0.832 0.374 0 1
Knowledge Management 2457 0.189 0.391 0 1 Firm Size Small 2457 0.521 0.500 0 1 Large 2457 0.382 0.486 0 1 Medium 2457 0.096 0.295 0 1 Sectors Foodbev 2457 0.118 0.322 0 1 Textiles 2457 0.115 0.318 0 1 Woodpap 2457 0.170 0.375 0 1 Cochem 2457 0.178 0.383 0 1 Metals 2457 0.106 0.308 0 1 Elecmot 2457 0.171 0.377 0 1 Foroth 2457 0.143 0.350 0 1 Profit Performance Turnover 1 2457 0.240 0.427 0 1 Turnover 2 2457 0.495 0.500 0 1 Turnover 3 2457 0.094 0.291 0 1
Foreign Direct Investment 435 0.115 0.319 0 1
Countries
Estonia 2457 0.383 0.486 0 1
Lithuania 2457 0.397 0.489 0 1
4. The Empirical Model And Results
Given the binary nature of the dependent variable, we use the following Probit model: Pr (𝑌𝑖=
1
𝑋) = 𝜙(𝑋, 𝛽)
where 𝜙 is the cumulative distribution function of the standard normal distribution and 𝑌𝑖 is the dummy
variable that takes value 1 if the firm i introduces innovation and 0 otherwise. X is a set of covariates described in Table 6.
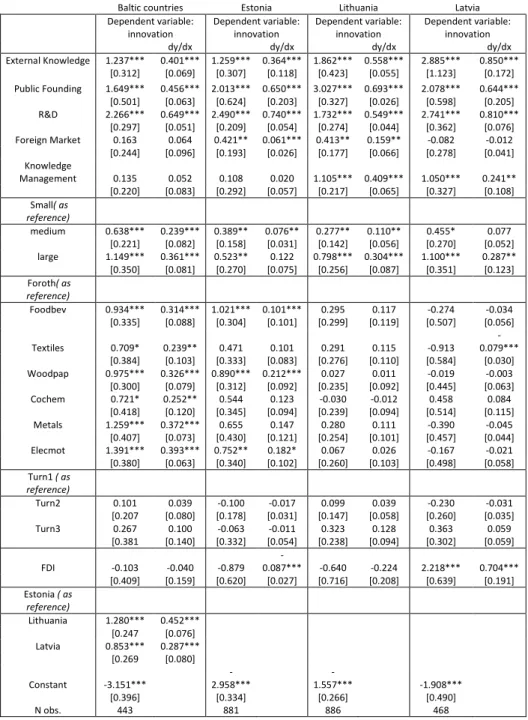
The following tables present the results of a set of Probit regressions estimating the impact of external knowledge and management knowledge on the probability of introducing an innovation and the probability of introducing a product and a process innovation. Table 8 reports the main results.
Table 8: The impact of knowledge on the propensity to innovate
Baltic countries Estonia Lithuania Latvia
Dependent variable: innovation Dependent variable: innovation Dependent variable: innovation Dependent variable: innovation
dy/dx dy/dx dy/dx dy/dx
External Knowledge 1.237*** 0.401*** 1.259*** 0.364*** 1.862*** 0.558*** 2.885*** 0.850*** [0.312] [0.069] [0.307] [0.118] [0.423] [0.055] [1.123] [0.172] Public Founding 1.649*** 0.456*** 2.013*** 0.650*** 3.027*** 0.693*** 2.078*** 0.644*** [0.501] [0.063] [0.624] [0.203] [0.327] [0.026] [0.598] [0.205] R&D 2.266*** 0.649*** 2.490*** 0.740*** 1.732*** 0.549*** 2.741*** 0.810*** [0.297] [0.051] [0.209] [0.054] [0.274] [0.044] [0.362] [0.076] Foreign Market 0.163 0.064 0.421** 0.061*** 0.413** 0.159** -0.082 -0.012 [0.244] [0.096] [0.193] [0.026] [0.177] [0.066] [0.278] [0.041] Knowledge Management 0.135 0.052 0.108 0.020 1.105*** 0.409*** 1.050*** 0.241** [0.220] [0.083] [0.292] [0.057] [0.217] [0.065] [0.327] [0.108] Small( as reference) medium 0.638*** 0.239*** 0.389** 0.076** 0.277** 0.110** 0.455* 0.077 [0.221] [0.082] [0.158] [0.031] [0.142] [0.056] [0.270] [0.052] large 1.149*** 0.361*** 0.523** 0.122 0.798*** 0.304*** 1.100*** 0.287** [0.350] [0.081] [0.270] [0.075] [0.256] [0.087] [0.351] [0.123] Foroth( as reference) Foodbev 0.934*** 0.314*** 1.021*** 0.101*** 0.295 0.117 -0.274 -0.034 [0.335] [0.088] [0.304] [0.101] [0.299] [0.119] [0.507] [0.056] Textiles 0.709* 0.239** 0.471 0.101 0.291 0.115 -0.913 -0.079*** [0.384] [0.103] [0.333] [0.083] [0.276] [0.110] [0.584] [0.030] Woodpap 0.975*** 0.326*** 0.890*** 0.212*** 0.027 0.011 -0.019 -0.003 [0.300] [0.079] [0.312] [0.092] [0.235] [0.092] [0.445] [0.063] Cochem 0.721* 0.252** 0.544 0.123 -0.030 -0.012 0.458 0.084 [0.418] [0.120] [0.345] [0.094] [0.239] [0.094] [0.514] [0.115] Metals 1.259*** 0.372*** 0.655 0.147 0.280 0.111 -0.390 -0.045 [0.407] [0.073] [0.430] [0.121] [0.254] [0.101] [0.457] [0.044] Elecmot 1.391*** 0.393*** 0.752** 0.182* 0.067 0.026 -0.167 -0.021 [0.380] [0.063] [0.340] [0.102] [0.260] [0.103] [0.498] [0.058] Turn1 ( as reference) Turn2 0.101 0.039 -0.100 -0.017 0.099 0.039 -0.230 -0.031 [0.207 [0.080] [0.178] [0.031] [0.147] [0.058] [0.260] [0.035] Turn3 0.267 0.100 -0.063 -0.011 0.323 0.128 0.363 0.059 [0.381 [0.140] [0.332] [0.054] [0.238] [0.094] [0.302] [0.059] FDI -0.103 -0.040 -0.879 -0.087*** -0.640 -0.224 2.218*** 0.704*** [0.409] [0.159] [0.620] [0.027] [0.716] [0.208] [0.639] [0.191] Estonia ( as reference) Lithuania 1.280*** 0.452*** [0.247 [0.076] Latvia 0.853*** 0.287*** [0.269 [0.080] Constant -3.151*** -2.958*** -1.557*** -1.908*** [0.396] [0.334] [0.266] [0.490] N obs. 443 881 886 468
Standard errors in brackets; statistical significance *** p < 0.01, ** p < 0.05, * p <0.1
First, external knowledge is significantly and positively associated with firms’ innovation at 1% in the Baltic Countries considered as “one economy” and for each country. This means that an increase of external
knowledge equal to 1% could lead to an increase of about 40% of innovation across the Baltic Countries and 36% in Estonia, 56% in Lithuania and 85% in Latvia. This result is consistent with the knowledge-based theory, relational and open innovation literature which stresses the importance of continuous internal and external interaction, linkages and ties for sharing knowledge and creating and improving firm’s innovation.
Knowledge management is not significant if we consider Baltic Countries as a unique economy. It becomes significant for Lithuania and Latvia at 1% if we consider the results for each country. An improvement in knowledge management is associated with an increase of innovation. The effect of knowledge management on innovation is almost twice in Lithuania than in Latvia. This finding could depend on the productive structure of the countries, characterized by a greater number of small firms (de Felice et al., 2012). Moreover, in a country with large firms such as Lithuania, the importance and the effect of knowledge management is quite substantial.
This consideration is confirmed by observing the relevance of the firm dimension. In other words, large and medium firms have the probability to improve the firm’s innovation performance compared to the small ones. In addition, Lithuania and Latvia present a probability of 45% and 28% respectively to make innovation as compared with Estonia.
The positive effect of R&D on innovation is always statistically significant at 1% confidence level in this Baltic area. External knowledge is easy to internalize, and firms are able to absorb it given the continuous external relationship with the neighboring countries. The results are not consistent with those obtained by Cohen and Levintal (1990) which found that external knowledge is not simple to internalize if firms do not invest resources in order to absorb it. On the contrary, it is in line with the Dautel’s study (2009) conducted on a sample of Luxembourg firms from the manufacturing and service sectors. In Baltic countries, public funding plays an important role in supporting innovation activity. In fact, a one percentage change in public funding would lead to a change in innovation of more or less 70% whereas all other variables remain constant.
Even if the recent literature (Adeoti, 2012; Choi, 2015; Hwang and Dong, 2015) has found that exports have a positive effect on a firm’s innovation, in our empirical analysis, we find that this probability is not uniform, but differs across the countries (in Estonia and Lithuania at 5% with a marginal effect equal to 6% for the first Country and to 16% for the second one). This probability depends on regional characteristics (López-Bazo and Motellón, 2013). Nam and Li (2102) highlight that the impact of FDI on technological innovation of local companies is not always positive. Our results are discordant; in Estonia the effect of FDI on innovation is negative and significant at 5%, whereas in Latvia this effect is positive and significant at 1%. To explain this finding we distinguish between passive and active learning. The first concerns the branches and only in a production capacity; the latter stimulates learning capacity and it implies a capacity to absorb external technological knowledge to create its own innovation. In addition, it could also be a horizontal investment, in which case it is possible to have a duplication abroad of a particular phase of the production process, carried out in geographical areas that guarantee good access to large markets. Vertical investments, on the other hand, are privileged where the cost of the factors are low (Barba Navaretti and Venables, 2004).
In the Baltic Countries, the innovation in manufacturing sector is important, presenting different significant levels and a substantial difference among the countries. In addition, all divisions are positive and significant (Foodbev, Woodpap, Metals and Elecmot at 1%, whereas Textiles and Cochem have a level of significance equal to 10%).
Although in Estonia the companies are specialized in the production of computers, electronic and optical products; food and wood sectors are also more innovative, in fact, these sectors are still considered a driving force for the economy of this country. It should be noted that in about half of the country there are forests, and, in addition, it is considered one of the most advanced countries in IT application (Poissonier, 2017); here were developed Skype, Hotmail and Kazaa. To sum up, the results confirm the Baltic area’s specialization in low-tech sectors in general and Estonia’s specialization in wood, food and IT divisions in particular.
5. Alternative Estimation and Robustness Check
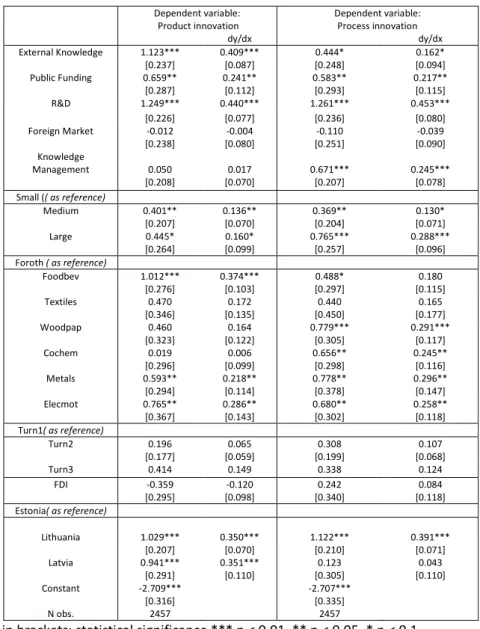
As a robustness check, we examined the effect of knowledge on firm innovation distinguishing the innovation in products and processes, considering initially the Baltic countries as a whole economy and then observing this effect in each country. We introduce this distinction to understand if the knowledge has the same effect
on these two types of innovation.Table 9 and table 10show the findings obtained considering the two kinds of innovation.
Table 9: The impact of knowledge on the propensity to introduce product and process innovation on Baltic
Countries Dependent variable: Product innovation Dependent variable: Process innovation dy/dx dy/dx External Knowledge 1.123*** 0.409*** 0.444* 0.162* [0.237] [0.087] [0.248] [0.094] Public Funding 0.659** 0.241** 0.583** 0.217** [0.287] [0.112] [0.293] [0.115] R&D 1.249*** 0.440*** 1.261*** 0.453*** [0.226] [0.077] [0.236] [0.080] Foreign Market -0.012 -0.004 -0.110 -0.039 [0.238] [0.080] [0.251] [0.090] Knowledge Management 0.050 0.017 0.671*** 0.245*** [0.208] [0.070] [0.207] [0.078] Small (( as reference) Medium 0.401** 0.136** 0.369** 0.130* [0.207] [0.070] [0.204] [0.071] Large 0.445* 0.160* 0.765*** 0.288*** [0.264] [0.099] [0.257] [0.096] Foroth ( as reference) Foodbev 1.012*** 0.374*** 0.488* 0.180 [0.276] [0.103] [0.297] [0.115] Textiles 0.470 0.172 0.440 0.165 [0.346] [0.135] [0.450] [0.177] Woodpap 0.460 0.164 0.779*** 0.291*** [0.323] [0.122] [0.305] [0.117] Cochem 0.019 0.006 0.656** 0.245** [0.296] [0.099] [0.298] [0.116] Metals 0.593** 0.218** 0.778** 0.296** [0.294] [0.114] [0.378] [0.147] Elecmot 0.765** 0.286** 0.680** 0.258** [0.367] [0.143] [0.302] [0.118] Turn1( as reference) Turn2 0.196 0.065 0.308 0.107 [0.177] [0.059] [0.199] [0.068] Turn3 0.414 0.149 0.338 0.124 FDI -0.359 -0.120 0.242 0.084 [0.295] [0.098] [0.340] [0.118] Estonia( as reference) Lithuania 1.029*** 0.350*** 1.122*** 0.391*** [0.207] [0.070] [0.210] [0.071] Latvia 0.941*** 0.351*** 0.123 0.043 [0.291] [0.110] [0.305] [0.110] Constant -2.709*** -2.707*** [0.316] [0.335] N obs. 2457 2457
Standard errors in brackets; statistical significance *** p < 0.01, ** p < 0.05, * p < 0.1
Table 8: The impact of knowledge on the propensity to introduce product and process innovation for each
Country
Lithuania
Explanatory Variables
Dependent variable: Product Innovation
Dependent variable: process innovation dy/dx dy/dx External Knowledge 0.651*** 0.216** 1.000*** 0.382*** [0.237] [0.090] [0.263] [0.096] Public Funding 1.348*** 0.473*** 1.644*** 0.586*** [0.192] [0.071] [0.209] [0.055] R&D 0.943*** 0.325*** 1.202*** 0.452*** [0.203] [0.079] [0.206] [0.070] Foreign Market 0.329** 0.085** 0.296** 0.100 [0.168] [0.041] [0.163] [0.053] Knowledge Management 0.729*** 0.239*** 0.954*** 0.362 [0.190] [0.071] [0.185] [0.069] Small ( as reference) Medium 0.101 0.028 0.207 0.074
Lithuania [0.147] [0.042] [0.134] [0.048] Large 0.308 0.094 0.376 0.141 [0.233] [0.077] [0.236] [0.092] Foroth ( as reference) Foodbev 0.675*** 0.217** 0.307 0.113 [0.252] [0.091] [0.265] [0.101] Textiles 0.605** 0.194** -0.03 -0.011 [0.258] [0.093] [0.276] [0.096] Woodpap -0.085 -0.023 0.045 0.016 [0.225] [0.059] [0.210] [0.074] Cochem -0.038 -0.01 0.009 0.003 [0.230] [0.061] [0.210] [0.074] Metals 0.386* 0.119 0.241 0.088 [0.233] [0.078] [0.228] [0.086] Elecmot 0.169 0.049 -0.21 -0.097 [0.231] [0.070] [0.237] [0.071] Turn1( as reference) Turn2 -0.080 -0.022 0.152 0.053 [0.137] [0.037] [0.137] [0.048] Turn3 0.301 0.09 0.316 0.117 [0.220] [0.071] [0.228] [0.087] FDI 0.360 0.113 0.893* -0.226*** [0.667] [0.233] [0.498] [0.078] Constant -1.742*** -1.451*** [0.221] [0.240] N obs. 886 886 Latvia
Explanatory Variables Dependent variable: product innovation Dependent variable: process innovation dy/dx dy/dx External Knowledge 1.488** 0.242 0.639 0.087 [0.597] [0.195] [0.652] [0.134] Public Funding 1.192*** 0.151 1.053*** 0.185* [0.382] [0.095] [0.396] [0.111] R&D 1.778*** 0.303*** 2.069*** 0.517*** [0.260] [0.082] [0.324] [0.130] Foreign Market -0.651*** -0.040** 0.378 0.027 [0.228] [0.02] [0.290] [0.019] Knowledge Management 1.090*** 0.110** 0.734*** 0.096* [0.282] [0.051] [0.290] [0.054] Small ( as reference) Medium 0.333 0.018 0.271 0.025 [0.239] [0.015] [0.252] [0.027] Large 0.118* 0.006 0.851** 0.135** [0.629] [0.035] [0.417] [0.099] Foroth ( as reference) Foodbev 0.135 0.007 0.100 0.009 [0.485] [0.025] [0.538] [0.049] Textiles 0.018 0.001 0.218 0.021 [0.471] [0.021] [0.619] [0.066] Woodpap -0.825* -0.028** 0.489 0.048 [0.478] [0.014] [0.541] [0.060] Cochem 0.469 0.03 0.721 0.096 [0.396] [0.036] [0.648] [0.121] Metals 0.082 0.004 0.093 0.008 [0.450] [0.022] [0.552] [0.050] Elecmot 0.408 0.026 -0.073 -0.006 [0.455] 0.04 [0.566] [0.042] Turn1( as reference) Turn2 -0.13 -0.006 0.19 0.016 [0.210] [0.009] [0.246] [0.023] Turn3 -0.488 -0.017 0.920*** 0.118 [0.295] [0.009] [0.278] [0.054] FDI -1.006** -0.0170*** 1.749** 0.444 [0.486] [0.006] [0.836] [0.332]
Latvia
Explanatory Variables Dependent variable: product innovation Dependent variable: process innovation dy/dx dy/dx Constant -1.790*** -3.051*** [0.461] [0.580] N obs. 468 468 Estonia
Explanatory Variables Dependent variable: product innovation Dependent variable: process innovation dy/dx dy/dx External Knowledge 0.410* 0.051 0.607*** 0.105** [0.222] 0.037 [0.238] [0.056] Public Funding 0.993*** 0.185** 0.619** 0.111 [0.297] 0.088 [0.320] 0.078 R&D 1.703*** 0.367*** 1.508*** 0.348*** [0.204] 0.060 [0.195] [0.062] Foreign Market 0.636*** 0.043*** 0.420** 0.041** [0.230] [0.014] [0.210] 0.018 Knowledge Management 0.055 0.006 0.627*** 0.109** [0.233] [0.024] [0.234] [0.055] Small ( as reference) Medium 0.228 0.024 0.173 0.022 [0.155] [0.017] [0.149] [0.019] Large 0.133 0.014 0.521** 0.089 [0.329] [0.038] [0.271] [0.060] Foroth ( as reference) Foodbev 0.940*** 0.158*** 0.328 0.048 [0.235] [0.058] [0.243] [0.043] Textiles -0.202 -0.017 0.110 0.014 [0.319] [0.024] [0.229] [0.031] Woodpap 0.025 0.002 0.523** 0.080* [0.312] [0.031] [0.228] [0.044] Cochem -0.018 -0.002 0.051 0.006 [0.277] [0.026] [0.264] [0.034] Metals 0.391 0.046 0.037 0.005 [0.334] [0.050] [0.377] [0.047] Elecmot 0.356 0.042 -0.067 -0.008 [0.256] [0.037] [0.259] [0.029] Turn1( as reference) Turn2 -0.136 -0.013 0.176 0.021 [0.163] [0.015] [0.172] [0.020] Turn3 -1.063*** -0.051*** 0.563** 0.095* [0.407] [0.012] [0.268] [0.054] FDI -0.217 -0.017 -0.201 -0.021 [0.366] [0.024] [0.443] [0.039] Constant -2.711*** -2.653*** [0.304] [0.293] N obs. 881 881
Standard errors in brackets; statistical significance *** p < 0.01, ** p < 0.05, * p < 0.10
In general, with respect to the key estimations presented in the previous paragraph the results do not change. External knowledge is always positive and significant thus confirms the baseline results but with different significative levels. This means that if external knowledge increases by 1%, it could lead to a growth of about 41% for product innovation and 16% for process innovation in the Baltic area. Considering the firm’s innovation performance in each country, we note that Lithuania presents a probability equal to 38% to make process innovation with respect to Estonia. Latvia, on the other hand, presents the highest probability to make product innovation equal to 24% with respect to Lithuania and Estonia. On the contrary, knowledge management is significant and positive only for process innovation that considers Baltic countries as “one economy”. These results are confirmed when the variables are separated for each country, but knowledge management becomes significant for all three countries if we separate product and process innovation.
6. Conclusion
The aim of this paper is the examination of knowledge influence on firms’ innovation in the Baltic Countries by using CIS 2014 data. As we specified in the introduction, this is an empirically unexplored area.
Innovation is considered as a systemic phenomenon in which external knowledge as well as knowledge management are fundamental for making product and process innovation.
Any firm that wants to be innovative in products and processes should pay attention to R&D investment, firm size and external knowledge.
The main finding confirms that not only external knowledge and knowledge management influence a firms’ innovation in the manufacturing sector, but that other factors appear as key determinants of innovation, such as expenditure in R&D, public funding, foreign markets and firm’s size. The results are ambiguous for foreign direct investment.
We can conclude that the empirical results support our hypothesis regarding the positive linkage between innovation and external knowledge. The external relationships with suppliers, competitors, clients and university are essential to develop new products or new processes. In addition, it the role played by knowledge management is important, particularly for medium-large firms to improve their organizational structure and to organize internal and/or external relations.
It is important to specify that if some of these conclusions are true when the Baltic area is considered as one economy, it is necessary to remember the specificity of each country and each economy’s characteristics that innovation-oriented policy must consider. Given its important relationship with other EU countries, Estonia is a hi-tech country in which innovation is influenced by external knowledge, public funding R&D and foreign markets. In Lithuania innovation is influenced by external knowledge, public funding, R&D and knowledge management for the industrial structure characterized by the presence of medium and large sized firms. In Latvia, innovation depends particularly on public funding, R&D, knowledge management and external investment, probably for the substitution of foreign markets with internal production and active learning. To conclude, this work has several limitations. Statistical analysis is based on standard CIS data which it is problematic. In order to bypass these restrictions, we constructed and use dummy variables.
Acknowledgements
The authors are grateful to European Commission Microdata Access Team, Eurostat for CIS data.
References
Abbing, E. R. (2010). Brand-Driven Innovation. Switzerland: AVA Publishing SA
Acs, I. J., Avsdretch, D. B. (1988). Innovation in large and small firms: An empirical analysis. The American Economic Review, 78(4), 678 - 690.
Adeoti, J. O. (2012). Technology-Related Factors As Determinants of Export Potential of Nigerian Manufacturing Firms. Structural Change and Economic Dynamics Journal, 23, 487-503.
Aghion, P., and Jaravel, X. (2015). Knowledge Spillovers, Innovation and Growth. The Economic Journal, 125(3), 533-573. Athaide, G. A., and Zhang, J. Q. (2011). The determinants of seller-buyer interactions during new product development in
technology-based industrial markets. Journal of Product Innovation Management, (s1), 146–158.
Banri I., Naomitsu Y., Zhaoyuan X., Hong C.X., Ryuhei W. (2012). How do Chinese industries benefit from FDI spillovers?, China Economic Review, 23, 342-356.
Barba Navaretti, G. and Venables A. J. (2004), Multinational Firms in the World Economy, Princeton, Princeton University Press. Edizione Italiana Le multinazionali nell’economia italiana, Il Mulino.
Barrutia J.M., Echebarria C.(2010). An Evolutionary View of Policy Network Management. European Planning Studies,19 (3), 379-401.
Buckley, PJ., Kafouros, M (2008) Under what conditions do firms benefit from the research efforts of other organizations? Research Policy, 37 (2). 225 – 239.
Camuffo A., Grandinetti R. (2006). I distretti industriali come sistemi locali di innovazione. Sinergie, 69:33-60. Camuffo A., Grandinetti R. (2011). Italian Industrial Districts as Cognitive Systems: Are They Still
Reproducible?Entrepreneurship & Regional Development, 23(9-10): 815-852.
Cassiman B., Golovko E. (2011). Abstract: Successful product innovation leads ... Journal of International Business Studies,42 (1), 56-75.
Chesbrough HW (2003) Open innovation: the new imperative for creating and profiting from technology. Harvard Business School Press, Boston MA.
Chesbrough HW (2006) Open Innovation: A New Paradigm for Understanding Industrial. In: Chesbrough HW, Vanhaverbeke W, West J (eds) Open innovation: researching a new paradigm. Oxford University Press.
Chiaroni, D., Chiesa, V., Frattini, F. (2011). The open innovation journey: How firms dynamically implement the Emerging innovation management paradigm. Technovation, 41, 34-43.
Cho, H., Pucik, V. (2005) Relationship between Innovativeness, Quality, Growth, Profitability and Market Value. Strategic Management Journal, 26, 555-575.
Choi, J. (2015). Create or buy? Internal vs. external source of innovation and firms productivity. TMCD Working Paper, No. 67.
Cohen, W. M., Levinthal, D. A. (1990). Absorptive capacity: A new perspective on learning and innovation, Administrative Science Quarterly, 35:126-138.
Crescenzi R., Gagliardi L., Iammarino S. (2015). Foreign multinationals and domestic innovation: Intra-industry effects and firm heterogeneity, Research Policy, 44, 596–609.
de Felice A., Martucci I. Schirone D. (2012). Knowledge and Innovation in Manufacturing Sector: The Case of Wedding Dresses in Southern Italy. In: Computational Science and Its Applications (edit by) Murgante B. et al. - ICCSA 2012. Part II. vol. LNCS 7334. Berlin Heidelberg: Springer – Verlag. 1-16
Erdal L., Gocer I. (2015), The Effects of Foreign Direct Investment on R&D and Innovations: Panel Data Analysis for Developing Asian Countries, Procedia, 195, 749-758.
Giuliani E., Bell M. (2005). The Micro-determinants of Meso-level Learning and Innovation: Evidence from a Chilean Wine Cluster. Research Policy, 34, 47-68.
Grandinetti R., Tabacco R. (2003). I distretti industriali come laboratori cognitive. Sviluppo locale. 10. 22
Granero, A., Vega, J., Vidal, J. (2014). Is R&D Enough to Take Advantage from the External Knowledge? Focusing on Coordination Mechanisms. Journal of Technology Managemnt & Innovation, 9(2), 118-130.
Hwang M.H., Dong X., (2015). The Relationships Among Firm Size, Innovation Type, and Export Performance With Regard to Time Spans, Emerging markets finance and trade,51(5), 947-962.
Huggins R, (2010) Network resources and knowledge alliances: Sociological perspectives on inter‐firm networks as innovation facilitators, International Journal of Sociology and Social Policy, Vol. 30 Issue: 9/10, pp.515-531. Kang K.N., Park H., (2012). nfluence of government R&D support and inter-firm collaborations on innovation in Korean
biotechnology SMEs, Technovation, Vol. 32 Issue 1, 68-78.
Kleinknecht, A., (1989), Firm size and innovation, Small Business Economics, 1(3), 215-222.
Koskinen K.U., Pihlanton P., Vanharanta H., (2003), International Journal of Project Management, 21, 281–290. Landry. R., Amara. N., Lamari. M. (2002) Does Social Capital Determine Innovation? To What Extent? Technological
Forecasting & Social Change, 69, 681-701.
Lòpez-Bazo E., Motellòn E. (2013), Firm export, innovation,… and regions, IREA WP 201308, University of Barcelona, Research Institute of Applied Economics, May.
Malerba F. (2005). Economia dell’innovazione. Carocci
Martin-de Castro, G. (2015). Knowledge Management and Innovation in Knowledge-Based and High-Tech Industrial Markets: the Role of Openness and Absorptive Capacity. Industrial Marketing Management, 47, 143-146. Martinez-Ros, E., Labeaga, J.M., (2010). Product and Process Innovation: Persistence and Complementarities. European
Management Review, 6(1), 64-75.
Maskell. P. (2001). Towards a Knowledge-based Theory of the Geographical Cluster. Industrial and Corporate Change. n.4. Nam J.B., Linghui T., Lei Z., (2012). Information Technology and Bilateral FDI: Theory and Evidence, MPRA Paper 36628,
University Library of Munich, Germany.
Nelson R., Winter S. (1982), An evolutionary theory of economic change, Harvard University Press, Cambridge. Nonaka. I., Takeuchi. H., (1995) The knowledge – creating company. Oxford University Press.
OECD. 2005. Oslo Manual. OECD. Paris.
Poissonier A., (2017), The Baltics: three countries, one economy? European Commission, 024 April
Powell W.W. (1990). Neither Market No Hierarchy: Network Forms of Organizations. Research in Organizational Behavior. vol.12. Press Inc., 295-336.
Powell W.W., Grodal S. (2005). Networks of Innovators. in Fagerberg J., Mowery D.C. and Nelson R.R. (eds). The Oxford Handbook of Innovation. Oxford. Oxford University Press: 56-85.
Price, D.P., Stoica, M., Boncella, R.J. (2013). The relationship between innovation, knowledge, and performance in family and non-family firms: an analysis of SMEs
Journal of Innovation and Entrepreneurship, 2 – 14.
Rigby, D.K., F.F. Reichheld, and P. Schefter (2002), Avoid the four perils of CRM. Harvard Business Review, 80(2): 101-109. Romer, P. M. (1990). Endogenous technological change. Journal of Political Economy, 78, 71-102.
Rullani E. (2003). The Industrial District as a Cognitive System. in Belussi F. Gottardi G. Rullani E. (eds.). The Technological Evolution of Industrial District. Kluwer. Boston.
Schumpeter J.A. (1971). Teoria dello sviluppo economico. Sansoni ed., Firenze
Schumpeter J.A. (1977) Il processo capitalistico. Cicli economici. Bollati Boringhieri. Torino.
Schoenmakers, W., Duysters, G., (2010). The technological origins of radicalinventions. Res. Policy 39, 1051–1059. Shefer D., Frenkel A., (2005). R&D, Firm Size and Innovation: An Empirical Analysis. Technovation, 25(1), 25-32.
Subramaniam, M., Youndt, M.A. (2005) The Influence of Intellectual Capital on the Types of Innovative Capabilities. Academy of Management Journal, 48, 450-463.
Ter Wal A., (2013). Cluster Emergence and Network Evolution: A Longitudinal Analysis of the Inventor network in Sophia Antipolis. Regional Studies. vol.47(5): 651-668.
Tsai, W. (2001) Knowledge transfer in intra-organizational networks: Effects of network position and absorptive capacity on business unit innovation and performance. Academy of Management Journal, 44(5), 996-1004.
Van den Bergh, J.C.J.M., (2008). Optimal diversity: increasing returns versusrecombinant innovation. J. Econ. Behav. Organ. 68, 565–580.
Van Dijk, B., Den Hertog, R., Menkveld, B., & Thurik, D. (1997). Some new evidence on the determinants large and small firm determinants. Small Business Economics, 9(4), 335 - 343.
Wasserman S., Faust K. (1994). Social Network Analysis. Cambridge University Press.
Winter S. (1987). Knowledge and Competence as Strategic Assets. in D. J. Teece (ed.). The Competitive Challenge. Ballinger. Cambridge Mass.
Zawislak, P. A., Alves, A. C., Tello-Gamarra, J., Barbieux, D., Reichert, F. M. (2012). Innovation capability: From technology development to transaction capability. Journal of Technology Management and Innovation, 7 (2), 14-26.
Zhara, S., George, G., (2002). Absorptive Capacity: A Review, Reconceptualization and Extension. Academy of Management Review, 27(2), 185-203.