DOI 10.1140/epjc/s10052-017-4779-8 Regular Article - Experimental Physics
Measurement of azimuthal correlations of D mesons with charged
particles in pp collisions at √s = 7 TeV and p–Pb collisions at
√s
NN
= 5.02 TeV
ALICE Collaboration⋆ CERN, 1211 Geneva 23, Switzerland
Received: 15 August 2016 / Accepted: 21 March 2017
© CERN for the benefit of the ALICE collaboration 2017. This article is an open access publication
Abstract The azimuthal correlations of D mesons with charged particles were measured with the ALICE
appara-tus in pp collisions at √s = 7 TeV and p–Pb collisions at
√s
NN = 5.02 TeV at the Large Hadron Collider. D0, D+,
and D∗+mesons and their charge conjugates with transverse momentum 3 < pT<16 GeV/c and rapidity in the
nucleon-nucleon centre-of-mass system|ycms| < 0.5 (pp collisions)
and−0.96 < ycms < 0.04 (p–Pb collisions) were corre-lated to charged particles with pT >0.3 GeV/c. The yield
of charged particles in the correlation peak induced by the jet containing the D meson and the peak width are compat-ible within uncertainties in the two collision systems. The data are described within uncertainties by Monte-Carlo sim-ulations based on PYTHIA, POWHEG, and EPOS 3 event generators.
1 Introduction
The study of the angular correlation of D mesons with charged particles, i.e. the distribution of the differences in azimuthal angles, "ϕ = ϕch − ϕD, and pseudorapidities,
"η= ηch−ηD, allows for the characterisation of charm
pro-duction and fragmentation processes in proton–proton (pp) collisions and of their possible modifications due to nuclear effects in proton–Pb and Pb–Pb collisions [1,2]. For leading-order (LO) Quantum-ChromoDynamic (QCD) processes, charm quark–antiquark pairs are produced back-to-back in azimuth: the angular correlation of D mesons with charged particles features a “near-side” peak at ("ϕ, "η)= (0, 0) and an “away-side” peak at "ϕ= π. The former originates from the jet containing the “trigger” D meson, the latter is induced by the recoil jet, which can also include the decay products of the other charmed hadron produced in the
colli-⋆e-mail:[email protected]
sion. The away-side peak extends over a wide range in "η. The two peaks lie on top of an approximately flat distribu-tion arising from the correladistribu-tion of D mesons with charged particles from the underlying event. Next-to-leading order (NLO) production processes can give rise to significantly dif-ferent correlation patterns [3,4]. For example, the radiation of a hard gluon from a charm quark smears the back-to-back topology of LO production and broadens both the near- and the away-side peak. In addition, quark–antiquark charm pairs originating from the splitting of a gluon can be rather col-limated and, especially at high transverse momentum ( pT),
can generate sprays of hadrons contributing to a unique and broader “near-side” peak. In such cases, the away-side peak stems from the particles coming from the fragmentation of the recoil parton (typically a gluon or a light quark), which is not aligned with the trigger D meson. Finally, in hard-scattering topologies classified as “flavour excitation” (see e.g. [4]) a charm quark (antiquark) from an initial splitting g→ c ¯c undergoes a hard interaction. The hadrons originat-ing from the antiquark (quark) can be significantly separated in rapidity with respect to the trigger D meson and contribute with a rather flat term to the "ϕ distribution.
Since the first measurement performed by STAR in
Au–Au collisions at √sNN = 200 GeV [5], two-particle
azimuthal correlations have been exploited at both RHIC and the LHC [6–8] to investigate the possible modifications of jet and dijet properties that can be caused by the interaction of high-energy partons with the constituents of the Quark Gluon Plasma (QGP) formed in ultra-relativistic heavy-ion colli-sions. The most evident effect is the suppression of the away-side correlation peak, commonly attributed to in-medium partonic energy loss. The results allow one to constrain the dependence of the energy loss on the distance covered by par-tons in the QGP as well as the initial gluon density [9,10]. The correlation pattern of hadron–hadron pairs primarily arises from the back-to-back production of gluons or light-quarks produced in hard-scattering processes, and their subsequent
fragmentation. PHENIX measured the azimuthal correlation of electrons from heavy-flavour hadron decays with charged particles in Au–Au collisions at √sNN= 200 GeV [11]. The
near- and away-side peaks are suppressed by factors com-patible, within uncertainties, to those observed for hadron– hadron correlations, if a similar pTis considered for the
trig-ger hadron and the electron parent hadron. The proper inter-pretation of nucleus–nucleus results and the connection of the modifications of the correlation peak properties to the parton dynamics in the QGP requires the comparison of data with model predictions. It is crucial that the models reproduce the correlation pattern measured in pp collisions, where nuclear effects are absent, as well as the production spectra in both pp and nucleus–nucleus collisions. Therefore, the measure-ment of azimuthal correlations of D mesons with charged particles in pp and p–Pb collisions serves not only as a refer-ence for future measurements in Pb–Pb collisions but it also allows for validation of Monte-Carlo generator expectations, which is fundamental for the understanding of the results in all collision systems.
Perturbative QCD calculations relying on the collinear-factorisation approach, like FONLL [12] and GM-VFNS [13], or based on the kT-factorisation approach [14] describe
rea-sonably well the pT-differential production cross sections
of D mesons from charm-quark fragmentation measured at central rapidity (|y| < 0.5) in pp collisions at √s = 7
and 2.76 TeV using the ALICE detector [15,16]. These
calculations represent the state of the art for the computa-tion of ( pT,y)-differential cross sections of charm quarks and charmed hadrons. However, the kinematic relationship between D mesons and particles from charm fragmentation and the underlying event is accessible only with event genera-tors coupled with parton-shower Monte-Carlo programs like
those provided by PYTHIA [17] and HERWIG [18]. The
order of hard-scattering matrix elements used, the specific implementation of parton shower and hadronisation, as well as the modeling of the underlying event have an influence on the angular correlations of D mesons with charged particles produced in the event. For heavy quarks with mass M and energy EQ, the suppression of gluon radiation off the quark
inside the forward cone with opening angle & = M/EQ
(the so-called “dead-cone” effect) reduces the phase space for primary gluon radiation [19]. This implies a harder frag-mentation of the quarks into the heavy hadrons and leads to essential differences in the profiles of gluon-, light-quark- and heavy-quark-initiated jets resulting in shape differences of pT-spectra and multiplicity distributions of primary hadrons
in the jets [20,21].
Correlations between D mesons were measured at the
LHC in pp collisions at √s = 7 TeV with the LHCb
experiment [22], providing information on charm
produc-tion mechanisms and on the properties of events
contain-ing heavy flavours. ATLAS measured the production of D∗+
mesons in jets in pp collisions at √s = 7 TeV for jets with
25 < pT <70 GeV/c and D∗+ carrying a jet momentum
fraction (z) in the range 0.3 < z < 1. The results indi-cate that the production of charm-quark jets or charm-quark
fragmentation into D∗+ mesons is not properly modeled
in state-of-the-art Monte-Carlo generators [23]. Azimuthal correlations of electrons from heavy-flavour hadron decays with charged particles were also exploited to study the rela-tive beauty contribution to the population of electrons from heavy-flavour hadron decays in pp collisions at RHIC and at the LHC [24,25].
The angular distribution of particles produced in an event is sensitive to collective effects that correlate particle pro-duction over wide phase-space regions. This is particularly relevant in Pb–Pb collisions with non-zero collision impact parameter, where the azimuthal asymmetry of the overlap-ping region of the colliding nuclei gives rise to anisotropic pressure gradients inducing an anisotropy in the azimuthal distribution of particle momenta [26,27]. The main com-ponent of the Fourier decomposition used to describe the resulting "ϕ distribution of two particle correlations is the 2nd order term, proportional to cos(2"ϕ), called elliptic flow or v2. Given that correlations induced by the
collec-tive motion of the system extend over large pseudorapidity ranges, the elliptic-flow term manifests itself with the pres-ence of two long-range ridge-like structures in the near and away sides of two-particle angular correlations. Unexpect-edly, similar long-range correlation structures were observed in high-multiplicity pp and p–Pb collisions at the LHC [28–
33]. Also in central d–Au collisions at RHIC [34,35] similar results were obtained, although contributions from jet-like correlations due to biases on the event selection could not be excluded [36]. The origin of such v2-like structures is still
debated. Positive v2values in high-multiplicity pp collisions
and p–Pb (d–Au) collisions at LHC (RHIC) are expected in models that include final-state effects [37–41], as well as initial-state effects related to the Color Glass Conden-sate [42] or to gluon bremsstrahlung by a quark–antiquark string [43]. A modification of the azimuthal correlations of D mesons with charged particles in p–Pb with respect to pp collisions could be a signal of the presence of long-range v2-like correlations for particles originating from
hard-scattering processes. This would yield complementary infor-mation to that obtained from correlations of light-flavour par-ticles, which at low pTare primarily produced in soft
pro-cesses. The D-meson pT-differential production cross
sec-tion in p–Pb collisions at √sNN = 5.02 TeV was measured
with ALICE in the interval of rapidity in the nucleon-nucleon centre-of-mass system−0.96 < ycms<0.04 [44]. The data are compatible, within uncertainties, with a Glauber-model-based geometrical scaling of a pp collision reference obtained
from the cross sections measured at √s = 7 TeV and
√s
small for D mesons in the range 1 < pT<24 GeV/c. How-ever, they could still affect angular correlations as observed at RHIC for azimuthally-correlated pairs of electrons and muons from decays of heavy-flavour hadrons in d–Au
col-lisions at √sNN = 200 GeV [45]. A modification of the
azimuthal correlation of heavy-flavour particles in p–Pb col-lisions could occur at the LHC due to gluon saturation in
the heavy nucleus [46]. Moreover, transport models based
on the Langevin equation [2,47] describe, within uncertain-ties, the nuclear modification factor of D mesons measured in p–Pb collisions at the LHC and that of electrons from heavy-flavour hadron decays measured in d–Au collisions at
RHIC [48]. These models assume the formation of a
small-size QGP in p–Pb and d–Au collisions and include the possi-bility of heavy-flavour hadron formation via coalescence of heavy quarks with thermalised light quarks from the medium. These transport calculations predict a positive D-meson v2
in central p–Pb collisions. As an example, in the case of the
POWLANG model [2] the maximum expectation for the 20%
most central p–Pb collisions is v2∼ 5% at pT = 4 GeV/c.
A finite v2 of muons from heavy-flavour hadron decays in
high-multiplicity p–Pb collisions was also suggested in [31] as one of the possibilities for reconciling the measured values of v2of inclusive muons with the expectations based on the
multi-phase transport model AMPT [49].
In this paper we report the first measurements of azimuthal correlations of D mesons with charged primary particles in pp
and p–Pb collisions at √s= 7 TeV and√sNN = 5.02 TeV,
respectively. Unless differently specified we always refer to “prompt” D mesons from charm-quark fragmentation. In what follows, primary particles are defined as particles orig-inated at the collision point, including those deriving from strong and electromagnetic decays of unstable particles, and those from decays of hadrons with charm or beauty. The paper is organised as follows. In Sect.2the data samples used and the details of the ALICE experimental apparatus relevant for this analysis are described. The analysis strategy, the D-meson signal extraction, the associated-track selection crite-ria, and the corrections applied to measure the correlations between D mesons and charged primary particles are reported in Sect.3. In the same section, the fit procedure adopted to quantify the correlation peak properties is described. Sec-tion4reports the systematic uncertainties affecting the mea-surement. The results are discussed in Sect.5. The paper is then summarised in Sect.6.
2 Experimental apparatus and data samples 2.1 The ALICE detector and event selection
The ALICE apparatus [50,51] consists of a central barrel embedded in a 0.5 T solenoidal magnetic field, a forward
muon spectrometer, and a set of detectors located in the forward- and backward-rapidity regions dedicated to trigger and event characterisation. The analysis reported in this paper is performed using the central barrel detectors. Charged par-ticle tracks are reconstructed using the Inner Tracking Sys-tem (ITS), consisting of six layers of silicon detectors, and the Time Projection Chamber (TPC). Particle identification (PID) is based on the specific energy loss dE/dx in the TPC gas and on the time of flight from the interaction vertex to the Time-Of-Flight (TOF) detector. The ITS, TPC and TOF detectors provide full azimuthal coverage in the pseudora-pidity interval|η| < 0.9.
The pp data sample consists of about 3× 10⁸
minimum-bias events, corresponding to an integrated luminosity of Lint = 5 nb−1. These collisions are triggered by the
pres-ence of at least one hit in one of the V0 scintillator arrays, covering the ranges−3.7 < η < −1.7 and 2.8 < η < 5.1, or in the Silicon Pixel Detector (SPD), constituting the two innermost layers of the ITS, with an acceptance of|η| < 2 (inner layer) and|η| < 1.4 (outer layer). The p–Pb data sam-ple consists of about 108minimum-bias events,
correspond-ing to an integrated luminosity of about Lint= 50 µb−1. In
this case the minimum-bias trigger requires signals in both the V0 detectors.
Only events with a reconstructed primary vertex within ±10 cm from the centre of the detector along the beam line are considered for both pp and p–Pb collisions. This choice maximises the detector coverage of the selected events, con-sidering the longitudinal size of the interaction region, and the detector pseudorapidity acceptances (for more details see [51]). For p–Pb collisions, the center-of-mass reference frame of the nucleon-nucleon collision is shifted in rapidity by "yNN= 0.465 in the proton direction with respect to the
laboratory frame, due to the different per-nucleon energies of the proton and the lead beams.
Beam-gas events are removed by offline selections based on the timing information provided by the V0 and the Zero Degree Calorimeters (two sets of neutron and pro-ton calorimeters located around 110 m from the interaction point along the beam direction), and the correlation between the number of hits and track segments in the SPD detec-tor.
The minimum-bias trigger efficiency is 100% for events
with D mesons with pT >1 GeV/c for both pp and p–Pb
data sets. For the analyzed data samples, the probability of pile-up from collisions in the same bunch crossing is below 4% per triggered pp event and below the percent level per triggered p–Pb event. Events in which more than one primary interaction vertex is reconstructed with the SPD detector are rejected, which effectively removes the impact of in-bunch pile-up events on the analysis. The contribution of particles from pile-up of pp collisions in different bunch crossings is also negligible due to the selections applied to the tracks used
in this analysis and the large interval between subsequent bunch crossings in the data samples used.
2.2 Monte-Carlo simulations
Monte-Carlo simulations including a complete description of the ALICE detector are used to calculate the corrections for the azimuthal-correlation distributions evaluated from data. The distribution of the collision vertex along the beam line, the conditions of all the ALICE detectors, and their evolution with time during the pp and p–Pb collision runs are taken into account in the simulations. Proton-proton collisions are sim-ulated with the PYTHIA 6.4.21 event generator [17] with the Perugia-0 tune (tune number 320) [52] while p–Pb collisions are simulated using the HIJING v1.36 event generator [53]. For the calculation of D-meson reconstruction efficiencies PYTHIA simulations of pp collisions are used, requiring that in each event a c¯c or b¯b pair is present. In the simulation used for the analysis of p–Pb data, a p–Pb collision simulated with HIJING is added on top of the PYTHIA event. The generated particles are transported through the ALICE apparatus using
the GEANT3 package [54].
The measured angular-correlation distributions are com-pared to simulation results obtained with the event generators PYTHIA 6.4.25 [17] (tunes number 320, 327, and 350, corre-sponding to the reference versions of the 0, Perugia-2010, and Perugia-2011 sets [52], respectively), PYTHIA 8.1
(tune 4C) [55], POWHEG [56,57] coupled to PYTHIA
(Perugia-2011 tune), and EPOS 3.117 [58–60] (referred
to as EPOS 3 hereafter). PYTHIA simulations utilise
LO-pQCD matrix elements for 2 → 2 processes, along with
a leading-logarithmic pT-ordered parton shower, the Lund
string model for hadronisation, and an underlying-event sim-ulation including Multiple-Parton Interactions (MPI). With respect to older tunes, the Perugia tunes use different initial-state radiation and final-initial-state radiation models. One of the main differences is that the parton shower algorithm is based on a pT-ordered evolution rather than a virtuality-ordered
one. Significant differences in the treatment of colour recon-nection, MPI, and the underlying event were also introduced. Perugia 0 is the first of the series. The Perugia-2010 tunes dif-fer from those of Perugia-0 in the amount of final-state radia-tion and by a modificaradia-tion of the high-z fragmentaradia-tion (induc-ing a slight harden(induc-ing of the spectra). They are expected to better reproduce observables related to the jet shape. The first LHC data, mainly from multiplicity and underlying-event related measurements, were considered for the Perugia-2011 tunes. PYTHIA 8.1 also includes several improvements in the treatment of MPI and colour reconnection [55]. In the
simulations done with √s = 5.02 TeV, the centre-of-mass
frame is boosted in rapidity by "yNN = 0.465 in order to
reproduce the rapidity shift of the reference frame of the nucleon-nucleon collision in the p–Pb collision system.
POWHEG is a NLO-pQCD generator [56,57] that,
cou-pled to parton shower programs (e.g. from PYTHIA or HERWIG [18]), can provide exclusive final-state particles, maintaining the next-to-leading order accuracy for inclusive observables. The charm-production cross sections obtained
with POWHEG+PYTHIA are consistent with FONLL [12]
and GM-VFNS [13] calculations within the respective uncer-tainties, and are in agreement with measured D-meson pro-duction cross sections within the model and experimental
uncertainties [61,62]. The POWHEG+PYTHIA simulations
presented in this paper are obtained with the POWHEG BOX
framework [63,64] and the tune Perugia 2011 of PYTHIA
6.4.25. For the comparison with the measured p–Pb colli-sion data, parton distribution functions (PDFs) corrected for nuclear effects (CT10nlo [65] with EPS09 [66]) are used. In addition, a boost in rapidity by "yNN = 0.465 is applied to
the partons generated with POWHEG before the PYTHIA parton shower process.
EPOS 3 [58–60] is a Monte-Carlo event generator based on a 3+1D viscous hydrodynamical evolution starting from flux tube initial conditions, which are generated in the Gribov-Regge multiple-scattering framework. Individual scat-terings are referred to as Pomerons, and are identified with parton ladders. Each parton ladder is composed of a pQCD hard process with initial and final state radiation. Non-linear effects are considered by means of a saturation scale. The hadronisation is performed with a string fragmentation pro-cedure. Based on these initial conditions, the hydrodynami-cal evolution can be applied on the dense core of the colli-sion. An evaluation within the EPOS 3 model shows that the
energy density reached in pp collisions at √s = 7 TeV is
high enough to apply such hydrodynamic evolution [60]. 3 Data analysis
The analysis procedure consists of three main parts, which are described in the following subsections: D-meson recon-struction and selection of primary particles to be used in the correlation analysis (Sect. 3.1), construction of azimuthal-correlation distribution and corrections, including the sub-traction of combinatorial background and beauty feed-down contributions (Sect.3.2), extraction of correlation properties via fits to the azimuthal distributions (Sect.3.3).
3.1 D-meson and associated-particle reconstruction The correlation analysis is performed by associating D
mesons (D0, D+, D∗+ mesons and their antiparticles),
defined as “trigger” particles, with charged primary parti-cles in the same event, and excluding those coming from the decay of the trigger D mesons themselves. The D0, D+, D∗+ mesons and their charge conjugates are reconstructed via
their hadronic decay channels D0 → K−π+, with
Branch-ing Ratio (BR) of (3.88±0.05)%, D+ → K−π+π+, BR of
(9.13±0.19)%, and D∗+→ D0π+, BR of (67.7±0.5)% [67].
The D-meson signal extraction is based on the reconstruc-tion of decay vertices displaced from the primary vertex by a few hundred microns and on the identification of the decay-particle species. The same selection procedures used for the measurements of D-meson production in pp and p–Pb
colli-sions at √s = 7 TeV and√sNN = 5.02 TeV, respectively,
are adopted [15,44]. For both the pp and p–Pb data sets, D0
and D+ candidates are formed by combining two or three
tracks, respectively, with each track satisfying|η| < 0.8 and pT>0.3 GeV/c. Additionally, D0and D+daughter tracks are required to have at least 70 out of a maximum of 159
possible associated space points in the TPC, a χ2/NDF of
the momentum fit in the TPC smaller than 2, and at least
2 out of 6 associated hits in the ITS. D∗+ candidates are
formed combining D0candidates with tracks with one point
in the SPD, |η| < 0.8 and pT > 0.1 GeV/c. The main
variables used to reject the combinatorial background are the separation between primary and secondary vertices, the distance of closest approach (DCA) of the decay tracks to the primary vertex, and the angle between the reconstructed D-meson momentum and the flight line defined by the pri-mary and secondary vertices. A tighter selection is applied for p–Pb collisions with respect to pp collisions to reduce the larger combinatorial background. Charged kaons and pions
are identified using the TPC and TOF detectors. A±3σ cut
around the expected value for pions and kaons is applied on both TPC and TOF signals. The D mesons are selected in a fiducial rapidity range varying from|ylab| < 0.5 at low pT
to|ylab| < 0.8 for D mesons with pT>5 GeV/c in order to avoid cases in which the decay tracks are close to the edge of the detector, where the acceptance decreases steeply. The D0 and D+ raw yields are extracted using fits to the
dis-tributions of invariant mass M(K−π+)and M(K−π+π+),
respectively, with a function composed of a Gaussian term for the signal and an exponential term that models the com-binatorial background. In the case of the D∗+, the raw yield is obtained by fitting the invariant-mass difference "M = M(K−π+π+)− M(K−π+), using a Gaussian function for
the signal and a threshold function multiplied by an exponen-tial (a√"M− Mπ·eb("M−Mπ)) to describe the background.
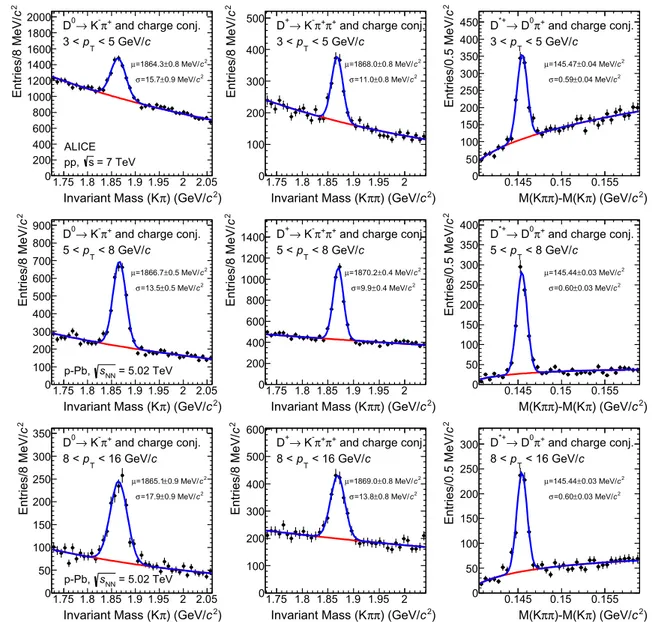
Relatively wide D-meson pTintervals (3 < pT<5 GeV/c, 5 < pT <8 GeV/c, 8 < pT<16 GeV/c for pp collisions and 5 < pT<8 GeV/c, 8 < pT<16 GeV/c for p–Pb col-lisions) are chosen to reduce the statistical fluctuations in the azimuthal-correlation distributions. Figure1 shows the D0
and D+invariant mass, and D∗+ invariant-mass difference
distributions in the 3 < pT<5 GeV/c interval for pp colli-sions and in the 5 < pT<8 GeV/c, 8 < pT <16 GeV/c
intervals for p–Pb collisions. The fits used to evaluate the raw yields are also shown.
The statistical uncertainty of the D-meson raw yields in
the pT intervals analyzed varies from about 5 to 8% (3 to
5%) in pp (p–Pb) collisions for the D0and D+mesons and
from about 5 to 6% (5 to 10%) for the D∗+mesons,
depend-ing on pT. For both collision systems, the signal over
back-ground ratio of the signal peaks is between 0.2 and 1 for the
D0 and D+ mesons, and up to 2.6 for the D∗+ meson. In
the interval 3 < pT <5 GeV/c the D-meson yield can be extracted from the invariant mass distribution with statistical uncertainty smaller than 3% in both pp and p–Pb collisions. However, in the latter case, the near- and away-side peaks of the azimuthal-correlation distribution, that have a small
amplitude at low D-meson pT, cannot be disentangled from
the statistical fluctuations of the baseline, which is related to the multiplicity of the event and thus higher in p–Pb than in pp collisions. Therefore, for this pTinterval, the results are
shown only for pp collisions.
Associated particles are defined as all charged primary particles with passoc
T > 0.3 GeV/c and with
pseudorapid-ity|η| < 0.8, except for the decay products of the trigger D meson. Particles coming from other weak decays or originat-ing from interactions with the detector material are defined as secondary particles and are discarded. Reconstructed tracks with at least 70 points in the TPC and 3 in the ITS, and a
χ2/NDF of the momentum fit in the TPC smaller than 2 are
associated to D-meson candidates. Using Monte Carlo simu-lations (see Sect.2.2), these selection criteria yield an average track reconstruction efficiency for charged primary particles of about 85% in the pseudorapidity range|η| < 0.8 and in the interval 0.3 < pT < 24 GeV/c, with variations contained within≈5% for pT <1.5 GeV/c. Negligible variations are observed at higher pT. The contamination of secondary
parti-cles is removed by requiring the DCA of the associated tracks to the primary vertex to be less than 2.5 mm in the transverse (x, y) plane and less than 1 cm along the beam line (z direc-tion). This selection identifies primary particles with a purity ( pprim) of approximately 96% and an efficiency higher than
99%, also for particles originating from decays of charm or beauty hadrons, which can be displaced by several hundred micrometers from the primary vertex. The purity is indepen-dent of pTin the measured pTrange. For the D0-meson case,
the low- pTpion produced from the D∗+→ D0π+decay is removed from the sample of associated particles by reject-ing tracks that yield a "M compatible within 3σ with the
value expected for D∗+mesons. It was verified with Monte
Carlo simulations that this selection rejects more than 99%
of the pions from D∗+decays in all D-meson pTintervals
considered and has an efficiency larger than 99% for primary particles with pT>0.3 GeV/c.
) 2 c ) (GeV/ π Invariant Mass (K 1.75 1.8 1.85 1.9 1.95 2 2.05 2c Entries/8 MeV/ 0 200 400 600 800 1000 1200 1400 1600 1800
2000 D0→ K-π+ and charge conj.
2 c 0.8 MeV/ ± =1864.3 µ 2 c 0.9 MeV/ ± =15.7 σ c < 5 GeV/ T p 3 < = 7 TeV s pp, ALICE ) 2 c ) (GeV/ π π Invariant Mass (K 1.75 1.8 1.85 1.9 1.95 2 2c Entries/8 MeV/ 0 100 200 300 400
500 D+→ K-π+π+ and charge conj.
2 c 0.8 MeV/ ± =1868.0 µ 2 c 0.8 MeV/ ± =11.0 σ c < 5 GeV/ T p 3 < ) 2 c ) (GeV/ π )-M(K π π M(K 0.145 0.15 0.155 2c Entries/0.5 MeV/ 0 50 100 150 200 250 300 350 400
450 D*+→ D0π+ and charge conj.
2 c 0.04 MeV/ ± =145.47 µ 2 c 0.04 MeV/ ± =0.59 σ c < 5 GeV/ T p 3 < ) 2 c ) (GeV/ π Invariant Mass (K 1.75 1.8 1.85 1.9 1.95 2 2.05 2c Entries/8 MeV/ 0 100 200 300 400 500 600 700 800
900 D0→ K-π+ and charge conj.
2 c 0.5 MeV/ ± =1866.7 µ 2 c 0.5 MeV/ ± =13.5 σ c < 8 GeV/ T p 5 < = 5.02 TeV NN s p-Pb, ) 2 c ) (GeV/ π π Invariant Mass (K 1.75 1.8 1.85 1.9 1.95 2 2c Entries/8 MeV/ 0 200 400 600 800 1000 1200
1400 D+→ K-π+π+ and charge conj.
2 c 0.4 MeV/ ± =1870.2 µ 2 c 0.4 MeV/ ± =9.9 σ c < 8 GeV/ T p 5 < ) 2 c ) (GeV/ π )-M(K π π M(K 0.145 0.15 0.155 2c Entries/0.5 MeV/ 0 50 100 150 200 250 300 350
400 D*+→ D0π+ and charge conj.
2 c 0.03 MeV/ ± =145.44 µ 2 c 0.03 MeV/ ± =0.60 σ c < 8 GeV/ T p 5 < ) 2 c ) (GeV/ π Invariant Mass (K 1.75 1.8 1.85 1.9 1.95 2 2.05 2c Entries/8 MeV/ 0 50 100 150 200 250 300
350 D0→ K-π+ and charge conj.
2 c 0.9 MeV/ ± =1865.1 µ 2 c 0.9 MeV/ ± =17.9 σ c < 16 GeV/ T p 8 < = 5.02 TeV NN s p-Pb, ) 2 c ) (GeV/ π π Invariant Mass (K 1.75 1.8 1.85 1.9 1.95 2 2c Entries/8 MeV/ 0 100 200 300 400 500 600
and charge conj. + π + π K → + D 2 c 0.8 MeV/ ± =1869.0 µ 2 c 0.8 MeV/ ± =13.8 σ c < 16 GeV/ T p 8 < ) 2 c ) (GeV/ π )-M(K π π M(K 0.145 0.15 0.155 2c Entries/0.5 MeV/ 0 50 100 150 200 250
300 D*+→ D0π+ and charge conj.
2 c 0.03 MeV/ ± =145.44 µ 2 c 0.03 MeV/ ± =0.60 σ c < 16 GeV/ T p 8 <
Fig. 1 Distributions of D0(left column) and D+(middle column) can-didate invariant mass and of the D∗+candidate invariant-mass differ-ence (right column). The distributions are shown for pp collisions in the 3 < pT<5 GeV/c range (top row) and for p–Pb collisions in the
5 < pT<8 GeV/c (middle row) and 8 < pT<16 GeV/c (bottom
row) ranges. The fits to the invariant mass distributions and the Gaussian mean and sigma values are also shown
3.2 Azimuthal-correlation distributions and corrections D-meson candidates with invariant mass (M) in the range |M − µ| < 2σ (peak region), where µ and σ denote the mean and width of the Gaussian term of the invariant-mass fit function, are correlated to tracks selected with the criteria described above, and the difference in the azimuthal angle ("ϕ) and in pseudorapidity ("η) of each pair is computed. In order to correct for the acceptance and reconstruction effi-ciency (Acc× ε) of the associated tracks and for the
vari-ation of (Acc× ε) of prompt D mesons inside a given pT
interval, a weight equal to the inverse of the product of both
(Acc× ε) is assigned to each pair. The dependence of the
associated-track efficiency on transverse momentum, pseu-dorapidity, and position of the primary vertex along the beam axis is taken into account. The dependence of the track recon-struction efficiency on the event multiplicity is negligible and therefore neglected. The reconstruction efficiency of prompt D mesons is calculated as a function of pTand event
multi-plicity. It is on the order of few percent in the lowest D-meson pTinterval, about 20% at high pT[15,44], and varies within
each pTinterval by up to a factor 2–3 (1.5–2) at low (high) pT,
depending on the D-meson species and collision system. The D-meson (Acc×ε) factor also accounts for the pT-dependent
fiducial rapidity range of the selected D mesons (Sect.3.1) in order to normalise the results to one unit of rapidity.
The obtained distribution, C("ϕ, "η)peak, also includes
the angular correlation of combinatorial D-meson candidates in the peak range, which is a source of background and needs to be subtracted. This contribution is estimated via the per-trigger correlation distribution of background candi-dates in the sideband invariant-mass range, 1/Bsidebands×
C("ϕ, "η)sidebands, where Bsidebandsis the amount of
back-ground in the sideband region 4σ <|M − µ| < 8σ (right
side only, 4σ < M − µ < 15σ, in the case of D∗+
mesons). The term C("ϕ, "η)sidebandsrepresents the
corre-lation distribution obtained as described above, but selecting trigger D-meson candidates with invariant mass in the side-bands. The background contribution is then subtracted from C("ϕ, "η)peakafter being normalised to the amount of
com-binatorial background in the peak region, Bpeak. The latter is
obtained from the counts in the invariant-mass distribution in the peak region, after subtracting the signal, Speak,
esti-mated from the invariant-mass fit. Note that Speak, Bpeakand
Bsidebandsare calculated from the invariant-mass distributions
weighted by the inverse of the prompt D-meson reconstruc-tion efficiency.
The correlation distributions C("ϕ, "η)peak and
C("ϕ, "η)sidebands are corrected for the limited detector
acceptance and spatial inhomogeneities using the event mix-ing technique. In this approach, D-meson candidates found in a given event are correlated with charged tracks from other events with similar multiplicity and primary-vertex position along the beam axis. The distribution obtained from the mixed events, ME("ϕ, "η), shows a typical triangular shape as a function of "η, due to the limited η coverage of the detector, and is approximately flat as a function of "ϕ. The event-mixing distribution is rescaled by its average value in the range (−0.2 < "ϕ < 0.2,−0.2 < "η < 0.2) and its inverse is used as a map to weight the distributions C("ϕ, "η)peakand C("ϕ, "η)sidebands. A correction for the
purity of the primary-particle sample ( pprim, see Sect.3.1) is
applied and the per-trigger normalisation is obtained divid-ing by Speak. The above procedure is summarised in Eq.1,
where the notation ˜C refers to angular-correlation distribu-tions normalised by the number of trigger particles:
˜Cinclusive("ϕ, "η) = pSprim peak ! C("ϕ, "η) ME("ϕ, "η) " " " "peak− Bpeak Bsidebands C("ϕ, "η) ME("ϕ, "η) " " " "sidebands # , ME("ϕ, "η)= $ C("ϕ, "η) ⟨C("ϕ, "η)⟩|"ϕ|,|"η|<0.2 % Mixed Events . (1)
Finally, the per-trigger azimuthal distribution ˜Cinclusive
("ϕ) is obtained by integrating ˜Cinclusive("ϕ, "η) in the range|"η| < 1.
It was verified using Monte-Carlo simulations based on PYTHIA (Perugia-2011 tune) that the per-trigger azimuthal correlation of D mesons and secondary particles not rejected
by the track selection has a "ϕ-dependent modulation with a maximum variation of 7% with respect to the azimuthal correlation of D mesons and primary particles. This "ϕ-dependent contamination has a negligible impact on the final results, considering the 4% level of contamination of sec-ondary particles in the sample of associated tracks, hence, it was neglected.
A fraction of the reconstructed D mesons consists of sec-ondary D mesons coming from B-meson decays. The topo-logical cuts, applied to reject combinatorial background, preferentially select displaced vertices, yielding a larger
(by about a factor 2 for D0 mesons in the measured p
T
range) efficiency for secondary D mesons than for prompt D mesons. Therefore, the fraction fprompt of reconstructed
prompt D mesons does not coincide with the natural fraction and depends on the analysis details. The different fragmen-tation, as well as the contribution of B-meson decay parti-cles and a possible different contribution of gluon splitting to charm- and beauty-quark production, imply a different angular-correlation distribution of prompt and secondary D mesons with charged particles, as it was verified with the
Monte-Carlo simulations described in Sect. 2.2. The
con-tribution of feed-down D mesons to the measured angular correlation is subtracted as follows:
˜Cprompt("ϕ)= 1
fprompt( ˜Cinclusive("ϕ)
−(1 − fprompt) ˜Cfeed-downMC templ("ϕ)). (2) In Eq.2, ˜Cprompt("ϕ)is the per-trigger azimuthal-correlation distribution after the subtraction of the feed-down
contri-bution, fprompt is the fraction of prompt D mesons and
˜CMC templ
feed−down("ϕ)is a template for the azimuthal-correlation
distribution of the feed-down component. Using the same method described in [15], fpromptwas evaluated on the basis
of FONLL calculations of charm and beauty pT-differential
production cross sections [12] and of the reconstruction
efficiencies of prompt and secondary D mesons, calculated using Monte-Carlo simulations. The value of fprompt, which
depends on the D-meson species and varies as a function of pT, is estimated to be larger than 75%. The azimuthal
cor-relation of feed-down D mesons, ˜CfeedMC templ−down, was obtained
from PYTHIA (tune Perugia 2011 [52]) simulations of pp
collisions at √s = 7 TeV and√s= 5.02 TeV for the
analy-sis of pp and p–Pb data, respectively. In order to avoid biases related to the different event multiplicity in real and simulated events, the correlation distribution was shifted to have its minimum coinciding with the baseline of the data azimuthal-correlation distribution before feed-down subtraction. A dif-ference smaller than 8% was observed in the simulation between the baseline values of the azimuthal-correlation dis-tributions for prompt and feed-down D mesons. Considering the typical values of fprompt, this difference results in a shift
of the baseline of ˜Cprompt("ϕ)smaller than 2%, negligible with respect to the other uncertainties affecting the measure-ment.
3.3 Characterization of azimuthal-correlation distributions In order to quantify the properties of the measured azimuthal correlations, the following fit function is used:
f ("ϕ)= b +√ ANS 2πσfit,NS e− ("ϕ)2 2σ 2fit,NS +√ AAS 2πσfit,AS e− ("ϕ−π)2 2σ 2fit,AS . (3)
It is composed of two Gaussian terms describing the near-and away-side peaks near-and a constant term describing the base-line. A periodicity condition is also imposed to the function, requiring f (0)= f (2π).
The integrals of the Gaussian terms, ANSand AAS,
corre-spond to the associated-particle yields for the near (NS)- and away (AS)-side peaks, respectively, while σfit,NSand σfit,AS
quantify the widths of the correlation peaks. By symmetry considerations, the mean of the Gaussian functions are fixed to "ϕ = 0 and "ϕ = π. The baseline b represents the physical minimum of the "ϕ distribution. To limit the effect of statistical fluctuations on the estimate of the associated yields, b is fixed to the weighted average of the points in the transverse region, defined as π/4 <|"ϕ| < π/2, using the inverse of the square of the point statistical uncertainty as weights. Given the symmetry of the correlation distributions around "ϕ = 0 and "ϕ = π, the azimuthal distributions are reported in the range 0 < "ϕ < π to reduce statistical fluctuations. The effect of a v2-like modulation in the "ϕ
distribution, which could be present in p–Pb collisions, was estimated and assessed in Sect.5.
In the case of the simulations, for which statistical fluctua-tions are negligible, the baseline is estimated as the minimum of the azimuthal-correlation distribution. An alternative fit-ting procedure based on a convolution of two Gaussian func-tions for the description of the NS peak was performed for Monte Carlo simulations. The resulting NS yields were found to be compatible with those obtained with the standard pro-cedure, with a maximum variation of 7% (10%) in pp (p–Pb) collisions in case of EPOS 3 simulations.
4 Systematic uncertainties
The fit of the D-meson invariant-mass distribution introduces systematic uncertainties on Speakand Bpeak(Sect.3.2, Eq.1).
The uncertainty on the correlation distribution was estimated by calculating Bpeakfrom the integral of the background term
of the invariant-mass fit function in the range|M − µ| < 2σ and by varying the fit procedure. In particular, the fit was repeated modeling the background distribution with a linear function and a parabola instead of an exponential function (for D0 and D+ mesons only), considering a different
his-togram binning, and varying the fit range. A 10% systematic uncertainty was estimated from the corresponding variation of the azimuthal-correlation distribution. No significant trend was observed as a function of "ϕ and the same uncertainty was estimated for all D-meson species in all pT-intervals and
in both pp and p–Pb collision systems.
A 5% uncertainty (10% for D+ mesons in p–Pb
colli-sions) arises from the possible dependence of the shape of ˜C("ϕ, "η)sidebands on the sideband range. This source of
uncertainty was determined by restricting the invariant-mass sideband window to the intervals 4σ < |M − µ| < 6σ or to 6σ < |M − µ| < 8σ for all the D mesons, and also by considering, for D0and D+mesons, only the left or only the
right sideband.
The uncertainty on the correction for the associated-particle reconstruction efficiency was assessed by varying the selection criteria applied to the reconstructed tracks, remov-ing the request of at least three associated clusters in the ITS, or demanding a hit on at least one of the two SPD layers. A ±4% uncertainty was estimated for p–Pb collisions, while a+10%−5% contribution was obtained for the pp analysis, with the +10% contribution arising from the request of hits in the SPD. No significant trend in "ϕ was observed.
The uncertainty on the residual contamination from sec-ondary tracks was evaluated by repeating the analysis varying the cut on the DCA in the (x, y) plane from 0.1 cm to 1 cm, and re-evaluating the purity of charged primary particles for each variation. This resulted in a 5% (3.5%) systematic uncer-tainty in pp (p–Pb) collisions, independent of "ϕ and passoc
T .
A 5% systematic effect originating from the correction of the D-meson reconstruction efficiency was evaluated by applying tighter and looser topological selections on the D-meson candidates. No significant dependence on "ϕ was observed and the same uncertainty was estimated for the
three D-meson pTintervals, apart from D+meson in p–Pb
collisions, for which a 10% uncertainty was assigned. The uncertainty on the subtraction of the beauty feed-down contribution was quantified by generating the templates of feed-down azimuthal-correlation distributions, ˜CfeedMC templ−down ("ϕ)in Eq.2, with different PYTHIA 6 tunes (Perugia 0, Perugia 2010, see Sect.2.2), and by considering the range of fpromptvalues obtained by varying the prompt and feed-down
D-meson pT-differential production cross sections within
FONLL uncertainty band, as described in [15]. The effect
on the azimuthal-correlation distributions is "ϕ dependent and contained within 8% and is more pronounced in the near side, in particular in the low and mid D-meson pTintervals.
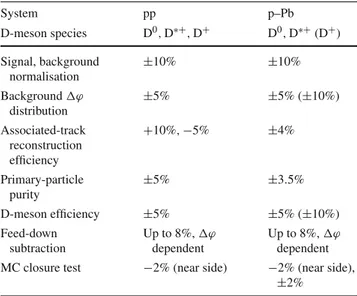
Table 1 List of systematic uncertainties for the "ϕ-correlation
distri-butions in pp and p–Pb collisions. See text for details
System pp p–Pb D-meson species D0,D∗+,D+ D0,D∗+(D+) Signal, background normalisation ±10% ±10% Background "ϕ distribution ±5% ±5% (±10%) Associated-track reconstruction efficiency +10%, −5% ±4% Primary-particle purity ±5% ±3.5% D-meson efficiency ±5% ±5% (±10%) Feed-down subtraction Up to 8%, "ϕ dependent Up to 8%, "ϕ dependent MC closure test −2% (near side) −2% (near side),
±2%
The consistency of the whole correction procedure, prior to the feed-down subtraction, was verified by performing the analysis on simulated events (“Monte-Carlo closure test”) separately for prompt and feed-down D mesons. For prompt D mesons, no effect was found for both pp and p–Pb collision systems. Conversely, for feed-down D mesons, an overesti-mate by about 20% in the near side was found for both colli-sion systems. It was verified that the source of this excess is related to a bias induced by the topological selection applied to D mesons, that tends to favour cases with a small angular opening between the products of the beauty-hadron decay, thus between the D meson and the other decay particles. This effect results in a "ϕ-dependent overestimate of the feed-down subtracted correlation distribution in the near side, contained within 2%.
The systematic uncertainties affecting the "ϕ-correlation distributions are summarised in Table1for both pp and p–Pb collision systems. The "ϕ-dependent parts of the uncertain-ties arising from the feed-down subtraction and the Monte-Carlo closure test define the "ϕ-uncorrelated systematic uncertainties. All the other contributions, correlated in "ϕ, act as a scale uncertainty. No significant dependence on the
transverse momentum of D mesons and associated particles was observed for both "ϕ-correlated and uncorrelated uncer-tainties, except for the feed-down systematic uncertainty.
Different approaches were applied to estimate the sys-tematic uncertainty on the near-side peak associated yield and peak width and on the baseline, obtained from the ANS, σfit,NS, and b parameters of the fit of the
azimuthal-correlation distribution, as described in Sect.3.3. The main source of uncertainty originates from the definition of the baseline itself, which is connected to the assumption that the observed variation of the azimuthal-correlation distribution in the transverse region is determined mainly by statistical fluctuations rather than by the true physical trend. The varia-tion of ANS, σfit,NS, and b values obtained when considering
a±π/4 variation of the "ϕ range defining the transverse region is interpreted as the systematic uncertainty due to the baseline definition. In addition, the fits were repeated by moving upwards and downwards the data points by the cor-responding value of the "ϕ-uncorrelated systematic uncer-tainty. The final systematic uncertainty was calculated by summing in quadrature the aforementioned contributions and, for the associated yields and baseline, also the system-atic uncertainty correlated in "ϕ. The values of the total systematic uncertainties on the near-side peak yield, width, and baseline are reported in Table 2, for two intervals of transverse momentum of D mesons and associated particles. Considering all the measured kinematic ranges, the uncer-tainties vary from±12 to ±25% for the near-side peak yield,
from±2 to ±13% for the near-side peak width and from ±11
to±16% for the baseline. Typically, lower uncertainties are obtained for p–Pb collisions, where the larger available statis-tics of the correlation distributions allow for a more precise estimate of the baseline height, which constitutes the main source of uncertainty also on the evaluation of the near-side peak associated yield and width.
5 Results
The azimuthal-correlation distributions of D0, D+, D∗+
mesons with charged particles with passoc
T > 1 GeV/c are
compared in Fig.2for 5 < pD
T <8 GeV/c in pp collisions
Table 2 List of systematic uncertainties for near-side (NS) peak associated yield, near-side peak width, and baseline in pp and p–Pb collisions, for
two different kinematic ranges of D mesons and associated particles. See text for details
System pp p–Pb
Kinematic range 5 < pD
T<8 GeV/c, 8 < pTD<16 GeV/c, 5 < pDT<8 GeV/c, 8 < pDT <16 GeV/c, 0.3 < passoc
T <1 GeV/c (%) passocT >1 GeV/c (%) 0.3 < pTassoc<1 GeV/c (%) passocT >1 GeV/c (%)
NS yield ±22 ±15 ±17 ±12
NS width ±10 ±5 ±3 ±3
) -1 (rad ϕ∆ d assoc Nd D N 1 0 0.5 1 1.5 2 2.5 3 = 7 TeV s pp, | < 0.5 cms D y | , c < 8 GeV/ D T p 5 < | < 1 η ∆ | , c > 1 GeV/ assoc T p ALICE scale uncertainty 13% −14% + , 0 D scale uncertainty 18% −19% + , + D scale uncertainty 13% −14% + , + * D (rad) ϕ ∆ ∆ϕ(rad) 0 0.5 1 1.5 2 2.5 3 0 0.5 1 1.5 2 2.5 3 ) -1 (rad ϕ∆ d assoc Nd D N 1 0 1 2 3 4 5 6 7 = 5.02 TeV NN s p-Pb, < 0.04 cms D y -0.96 < , c < 16 GeV/ D T p 8 < | < 1 η ∆ | , c > 1 GeV/ assoc T p ALICE scale uncertainty 13% −14% + , 0 D scale uncertainty 18% −19% + , + D scale uncertainty 13% −14% + , + * D
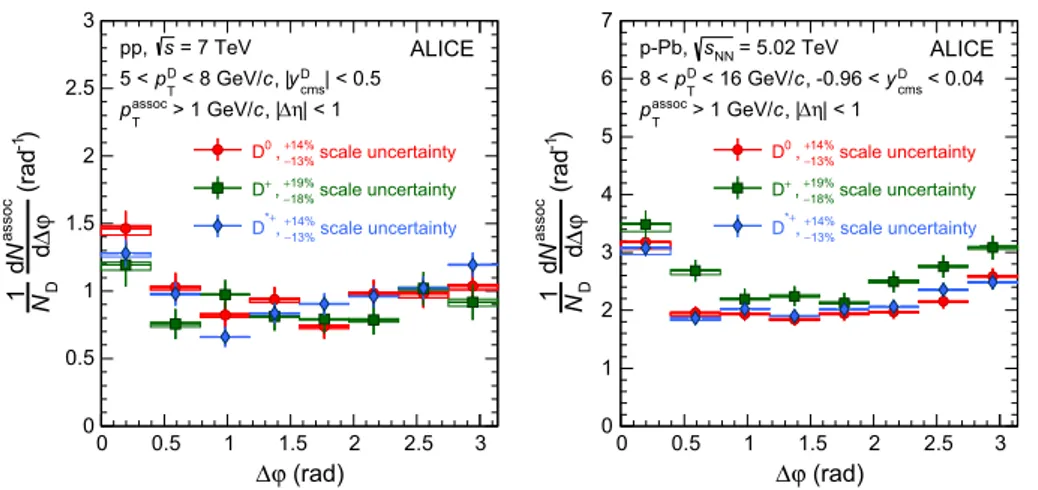
Fig. 2 Comparison of the azimuthal-correlation distributions of D
mesons with charged particles obtained for D0, D+and D∗+mesons for 5 < pD
T < 8 GeV/c, passocT > 1 GeV/c in pp collisions at √s = 7 TeV (left panel) and for 8 < pD
T < 16 GeV/c,
passoc
T > 1 GeV/c in p–Pb collisions at √sNN = 5.02 TeV (right
panel). The statistical uncertainties are shown as error bars, the "ϕ-uncorrelated systematic uncertainties as boxes, while the part of sys-tematic uncertainty correlated in "ϕ is reported as text (scale uncer-tainty). The latter is largely uncorrelated among the D-meson species
(left panel) and for 8 < pDT <16 GeV/c in p–Pb collisions (right panel). The distributions obtained with the three D-meson species are compatible within the quadratic sum (wi,
i = D0, D+, D∗+) of the statistical uncertainty and of the systematic uncertainties on the signal, background normali-sation, and on the background shape (see Table1), that are uncorrelated among the three meson species. The D0-, D+ -, D∗+-meson data are averaged using 1/w2
i as weights. The
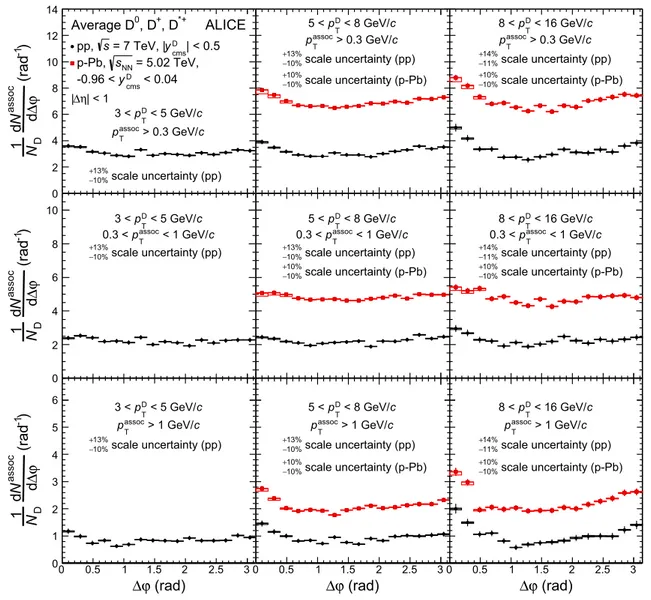
averages of the distributions are shown, for all the considered kinematic ranges, in Fig.3for pp and p–Pb collisions. A ris-ing trend of the height of the near-side peak with increasris-ing D-meson pTis observed for both collision systems. A similar
trend is present for hadron–hadron correlations measured at Tevatron and LHC energies [68–71]: an increase of hadron multiplicity in jets with increasing jet energy is expected from the evolution of parton cascade with the parton energy for both light and heavy quarks [19]. A decrease of the base-line level with increasing pTof the associated particles can
also be noticed.
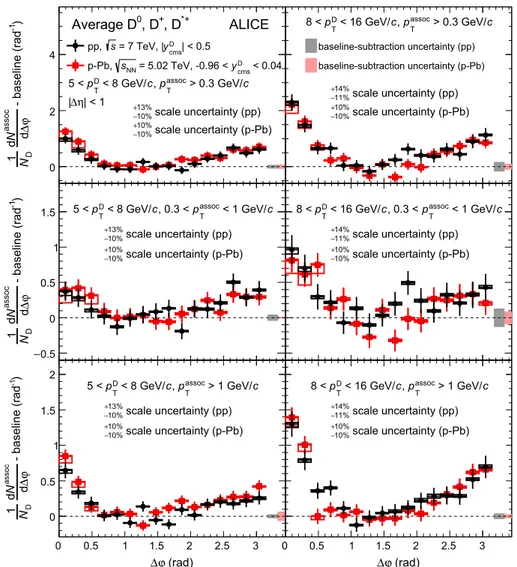
Figure4shows the "ϕ distributions after the subtraction of the baseline, calculated as described in Sect.3.3. The dis-tributions show a near-side peak along with a wider and lower peak in the away-side region. The results obtained for the two collision systems are compatible within the total uncertainties. According to simulations of pp colli-sions performed using PYTHIA 6 (Perugia-0, -2010, and -2011 tunes), the different centre-of-mass energy and the slightly different D-meson rapidity range of the two mea-surements should induce variations in the baseline-subtracted azimuthal-correlation distributions smaller than 7% in the near- and away-side regions. The same estimate is obtained with POWHEG+PYTHIA simulations including the EPS09 parametrisation of nuclear PDFs (see Sect.2.2). Such differ-ences are well below the current level of uncertainties.
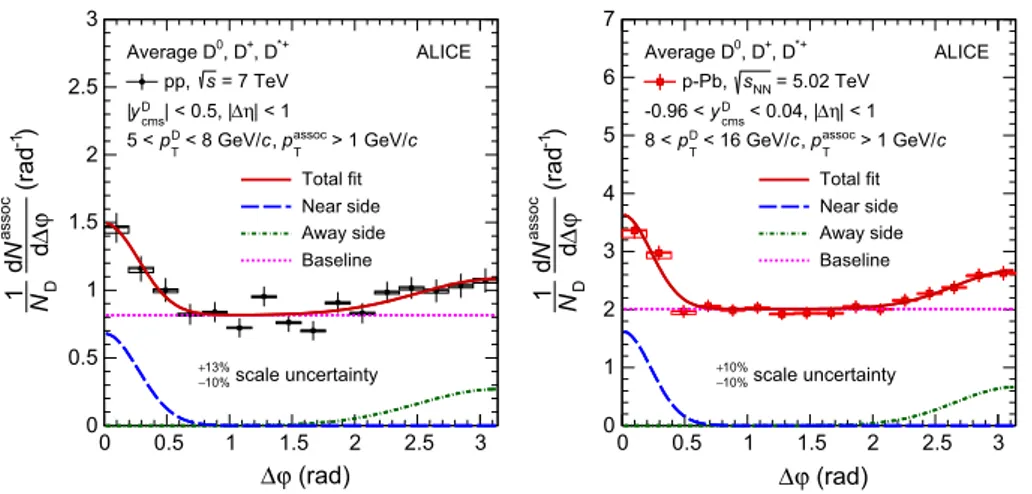
A further comparison of the results from pp and p–Pb colli-sions is done by quantifying the integrals and the widths of the near-side correlation peaks by fitting the measured distribu-tions as described in Sect.3.3. The fit results are reported only for the near-side peak parameters and the baseline because of the poor statistical precision on the fit parameters of the away-side peaks. Figure5shows an exemplary fit to the azimuthal-correlation distributions of D mesons with charged particles with passoc
T >1 GeV/c, for 5 < pDT <8 GeV/c in pp
col-lisions (left panel) and for 8 < pDT < 16 GeV/c in p–Pb collisions (right panel). The curves superimposed to the data represent the three terms of the function defined in Eq.3.
Within the uncertainties, the fit function describes the measured distributions in all kinematic cases considered,
yielding χ2/NDF values close to unity. The evolution of
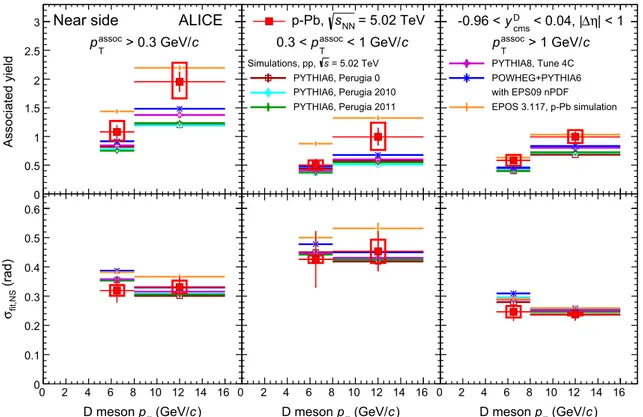
the near-side peak associated yield as a function of the
D-meson pT is reported in Fig. 6 (top row), for pp and
p–Pb collisions, for passoc
T > 0.3 GeV/c (left panel) and
for the two sub-intervals 0.3 < passoc
T < 1 GeV/c
(mid-dle panel) and pTassoc > 1 GeV/c (right panel). The near-side peak associated yield exhibits an increasing trend with
D-meson pT and has similar values, within uncertainties,
for the softer (0.3 < pTassoc < 1 GeV/c) and the harder ( passoc
T > 1 GeV/c) sub-ranges of passocT used, in each
D-meson pTinterval considered. The values obtained for pp and
p–Pb collision data are compatible within statistical uncer-tainties. In the bottom row of the same figure the width of the near-side Gaussian term (σfit,NS) is shown. Although the
case with pTassoc>0.3 GeV/c seems to suggest that σfit,NS
does not strongly depend on D-meson pT in the range of
the measurement, the current level of uncertainty does not allow for quantification of the dependence of σfit,NS on
D-meson and associated charged particle pT, as well as any
) -1 (rad ϕ∆ d assoc Nd D N 1 0 2 4 6 8 10 12 14 ALICE *+ , D + , D 0 Average D | < 0.5 cms D y = 7 TeV, | s pp, = 5.02 TeV, NN s p-Pb, < 0.04 cms D y -0.96 < | < 1 η ∆ | c < 5 GeV/ D T p 3 < c > 0.3 GeV/ assoc T p scale uncertainty (pp) 10% −13% + c < 8 GeV/ D T p 5 < c > 0.3 GeV/ assoc T p scale uncertainty (pp) 10% −13% + scale uncertainty (p-Pb) 10% −10% + c < 16 GeV/ D T p 8 < c > 0.3 GeV/ assoc T p scale uncertainty (pp) 11% −14% + scale uncertainty (p-Pb) 10% −10% + ) -1 (rad ϕ∆ d assoc Nd D N 1 0 2 4 6 8 10 c < 5 GeV/ D T p 3 < c < 1 GeV/ assoc T p 0.3 < scale uncertainty (pp) 10% −13% + c < 8 GeV/ D T p 5 < c < 1 GeV/ assoc T p 0.3 < scale uncertainty (pp) 10% −13% + scale uncertainty (p-Pb) 10% −10% + c < 16 GeV/ D T p 8 < c < 1 GeV/ assoc T p 0.3 < scale uncertainty (pp) 11% −14% + scale uncertainty (p-Pb) 10% −10% + (rad) ϕ ∆ 0 0.5 1 1.5 2 2.5 3 ) -1 (rad ϕ∆ d assoc Nd D N 1 0 1 2 3 4 5 6 D < 5 GeV/c T p 3 < c > 1 GeV/ assoc T p scale uncertainty (pp) 10% −13% + (rad) ϕ ∆ 0 0.5 1 1.5 2 2.5 3 c < 8 GeV/ D T p 5 < c > 1 GeV/ assoc T p scale uncertainty (pp) 10% −13% + scale uncertainty (p-Pb) 10% −10% + (rad) ϕ ∆ 0 0.5 1 1.5 2 2.5 3 c < 16 GeV/ D T p 8 < c > 1 GeV/ assoc T p scale uncertainty (pp) 11% −14% + scale uncertainty (p-Pb) 10% −10% +
Fig. 3 Average of the azimuthal-correlation distributions of D0, D+ and D∗+ mesons with 3 < pD
T < 5 GeV/c (left column), 5 <
pTD < 8 GeV/c (middle column), and 8 < pTD < 16 GeV/c (right
column), with charged particles with passoc
T > 0.3 GeV/c (top row), 0.3 < passoc
T <1 GeV/c (middle row), and passocT >1 GeV/c (bottom
row), measured in pp collisions at √s= 7 TeV and in p–Pb collisions at √sNN= 5.02 TeV. The statistical uncertainties are shown as error
bars, the "ϕ-uncorrelated systematic uncertainties as boxes, while the part of systematic uncertainty correlated in "ϕ is reported as text (scale uncertainty)
and p–Pb data. In particular, our approach for baseline cal-culation (Sect.3.3) guarantees a robust estimate of the min-imum, but the baseline uncertainty and its impact on the associated-yield uncertainty are rather large (Sect.4). This systematic uncertainty is expected to be significantly reduced in future measurements with larger data samples, where a smaller "ϕ range for the baseline calculation could be used.
A v2-like modulation of the baseline would introduce a
bias in the measurement of the associated yield and peak width and that needs to be taken into account while interpret-ing the measured quantities in terms of charm-jet properties. In order to get an estimate of this possible effect, for the p–Pb case the fit was repeated by subtracting from the
corre-lation distribution a v2-like modulation assuming v2= 0.05
for D mesons and v2 = 0.05 (0.1) for associated charged
particles with pT>0.3 (1) GeV/c. These values were cho-sen on the basis of charged-particle measurements in high-multiplicity p–Pb collisions [30] and assuming for D mesons the maximum value predicted in [2] for the 20% most central p–Pb collisions as a test case. With such assumptions, rather extreme also considering that this measurement is performed without any selection on event multiplicity, ANSvaries by
−10% (−6%) for D mesons with 5 < pT <8 GeV/c and
for 0.3 < passoc
T <1 GeV/c ( pTassoc>1 GeV/c). The
vari-ations on σfit,NS and on the baseline are below 4 and 1%,
respectively. Significantly smaller modifications result for D mesons with 8 < pT<16 GeV/c. With the available
statis-0 2 4 scale uncertainty (p-Pb) 10% −10% + scale uncertainty (pp) 10% −13% + | < 0.5 cms D y = 7 TeV, | s pp, < 0.04 cms D y = 5.02 TeV, -0.96 < NN s p-Pb, c > 0.3 GeV/ assoc T p , c < 8 GeV/ D T p 5 < | < 1 η ∆ | ALICE *+ , D + , D 0 Average D 0.5 0 0.5 1 1.5 scale uncertainty (p-Pb) 10% −10% + scale uncertainty (pp) 10% −13% + c < 1 GeV/ assoc T p , 0.3 < c < 8 GeV/ D T p 5 < ) -1 - baseline (rad ϕ∆ d assoc Nd D N 1 ) -1 - baseline (rad ϕ∆ d assoc Nd D N 1 − ) -1 - baseline (rad ϕ∆ d assoc Nd D N 1 0 0.5 1 1.5 2 scale uncertainty (p-Pb) 10% −10% + scale uncertainty (pp) 10% −13% + c > 1 GeV/ assoc T p , c < 8 GeV/ D T p 5 < scale uncertainty (p-Pb) 10% −10% + scale uncertainty (pp) 11% −14% + baseline-subtraction uncertainty (pp) baseline-subtraction uncertainty (p-Pb) c > 0.3 GeV/ assoc T p , c < 16 GeV/ D T p 8 < scale uncertainty (p-Pb) 10% −10% + scale uncertainty (pp) 11% −14% + c < 1 GeV/ assoc T p , 0.3 < c < 16 GeV/ D T p 8 < (rad) ϕ ∆ ∆ϕ (rad) 0 0.5 1 1.5 2 2.5 3 0 0.5 1 1.5 2 2.5 3 scale uncertainty (p-Pb) 10% −10% + scale uncertainty (pp) 11% −14% + c > 1 GeV/ assoc T p , c < 16 GeV/ D T p 8 <
Fig. 4 Comparison of the azimuthal-correlation distributions of D
mesons with 5 < pD
T < 8 GeV/c (left column) and 8 < pTD < 16 GeV/c (right column) with charged particles with passoc
T >
0.3 GeV/c (top row), 0.3 < passoc
T < 1 GeV/c (middle row), and
passoc
T >1 GeV/c (bottom row) in pp collisions at √s= 7 TeV and in p–Pb collisions at √sNN = 5.02 TeV, after baseline subtraction. The
statistical uncertainties are shown as error bars, the "ϕ-uncorrelated systematic uncertainties as boxes around the data points, the part of systematic uncertainty correlated in "ϕ is reported as text (scale uncer-tainty), the uncertainties deriving from the subtraction of the baselines are represented by the boxes at "ϕ > π
tics, the precision of the measurement is not sufficient to observe or exclude these modifications.
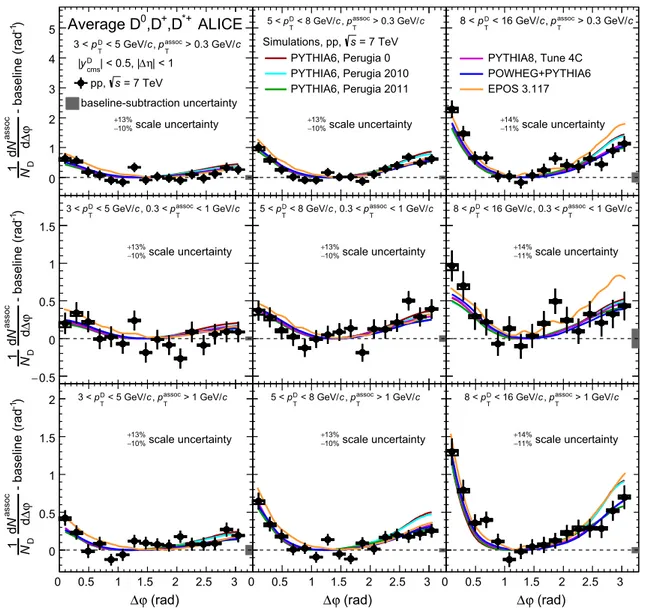
Figure7shows the comparison of the averaged azimuthal-correlation distributions measured in pp collisions with expectations from simulations performed with PYTHIA,
POWHEG+PYTHIA, and EPOS 3 (see Sect.2.2), after the
baseline subtraction. The average of the two lowest values of the azimuthal-correlation distribution is used to define the uncertainty related to the baseline definition in Monte-Carlo simulations (see Sect.3.3). This uncertainty is negligible and not displayed in the figures. The distributions obtained with the different generators and tunes do not show significant dif-ferences in the near side, except from EPOS 3 which tends to have higher and wider distributions. In the away side, the
PYTHIA 6 tunes Perugia 0 and Perugia 2010 tend to have higher correlation values, especially for passoc
T >1 GeV/c,
compared to the other simulation results. Similar consid-erations hold for EPOS 3 in the case of D mesons with
8 < pT < 16 GeV/c. The considered Monte-Carlo
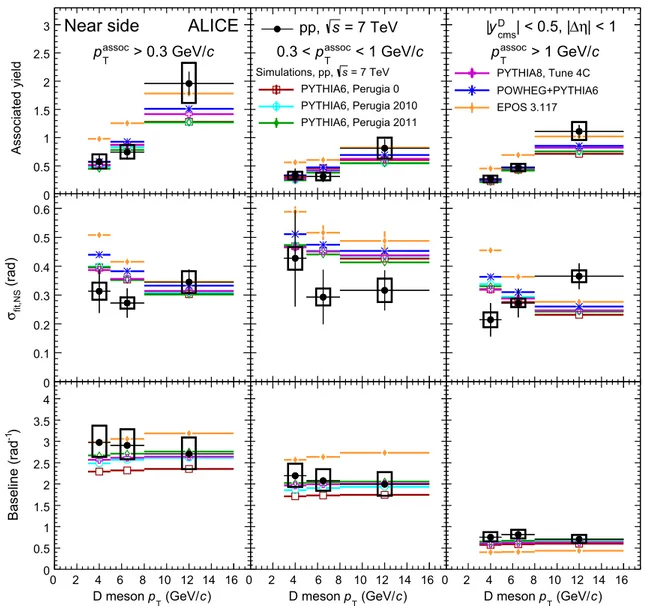
sim-ulations describe, within the uncertainties, the data in the whole "ϕ range. The comparison of the associated yield in the near-side peak in data and in simulations is displayed in
the top row of Figs. 8 and 9, for pp and p–Pb collisions,
respectively. The simulations obtained with EPOS 3 pro-vide a better description of the near-side yields for D mesons with 8 < pT < 16 GeV/c in both pp and p–Pb collisions.
At lower D-meson pT a better agreement is obtained with
(rad) ϕ ∆ 0 0.5 1 1.5 2 2.5 3 ) -1 (rad ϕ∆ d assoc Nd D N 1 0 0.5 1 1.5 2 2.5 3 *+ , D + , D 0 Average D = 7 TeV s pp, ALICE | < 1 η ∆ | < 0.5, | cms D y | c > 1 GeV/ assoc T p , c < 8 GeV/ D T p 5 < scale uncertainty 10% −13% + Total fit Near side Away side Baseline (rad) ϕ ∆ 0 0.5 1 1.5 2 2.5 3 ) -1 (rad ϕ∆ d assoc Nd D N 1 0 1 2 3 4 5 6 7 Total fit Near side Away side Baseline *+ , D + , D 0 Average D = 5.02 TeV NN s p-Pb, ALICE | < 1 η ∆ < 0.04, | cms D y -0.96 < c > 1 GeV/ assoc T p , c < 16 GeV/ D T p 8 < scale uncertainty 10% −10% +
Fig. 5 Examples of the fit to the azimuthal-correlation distribution,
for D mesons with 5 < pD
T <8 GeV/c with charged particles with
passoc
T > 1 GeV/c in pp collisions at √s = 7 TeV (left), and for D mesons with 8 < pD
T < 16 GeV/c with charged particles with
passoc
T >1 GeV/c in p–Pb collisions at √sNN= 5.02 TeV (right). The statistical uncertainties are shown as error bars, the "ϕ-uncorrelated
systematic uncertainties as boxes, while the part of systematic uncer-tainty correlated in "ϕ is reported as text (scale unceruncer-tainty). The terms of the fit function described in Sect.3.3are also shown separately: near-side Gaussian function (blue dashed line), away-near-side Gaussian function (green dashed–dotted line) and baseline constant term (magenta dotted
line) Associated yield 0 0.5 1 1.5 2 2.5
3 Near side ALICE
| < 1 η ∆ , | c > 0.3 GeV/ assoc T p ) c (GeV/ T p D meson 0 2 4 6 8 10 12 14 16 (rad) fit,NS σ 0 0.1 0.2 0.3 0.4 0.5 0.6
p-Pb points and error boxes
c = +0.3 GeV/ T p ∆ shifted by | < 0.5 cms D y = 7 TeV, | s pp, = 5.02 TeV, NN s p-Pb, < 0.04 cms D y -0.96 < | < 1 η ∆ , | c < 1 GeV/ assoc T p 0.3 < ) c (GeV/ T p D meson | < 1 η ∆ , | c > 1 GeV/ assoc T p
<7% variation expected from energy and rapidity difference (PYTHIA6, Perugia 2011)
) c (GeV/ T p D meson 0 2 4 6 8 10 12 14 16 0 2 4 6 8 10 12 14 16
Fig. 6 Comparison of the near-side peak associated yield (top row)
and peak width (bottom row) in pp and p–Pb collisions as a function of
pD
T, for pTassoc>0.3 GeV/c (left column), 0.3 < passocT <1 GeV/c (middle column), and passoc
T >1 GeV/c (right column). The points and
error boxes for p–Pb collisions are shifted by "pT= +0.3 GeV/c. Sta-tistical and systematic uncertainties are shown as error bars and boxes, respectively
of the near-side peaks, shown in the second row of the same figures, is better reproduced by the simulations in the case of p–Pb than of pp results. The evolution of the baseline value
as a function of the D-meson pTis compared for pp-collision
data to expectations from PYTHIA simulations in the bottom row of Fig.8for the three ranges of passocT considered in the
) -1 - baseline (rad ϕ∆ d assoc Nd D N 1 0 1 2 3 4 5 scale uncertainty 10% −13% + baseline-subtraction uncertainty ALICE c > 0.3 GeV/ assoc T p , c < 5 GeV/ D T p 3 < *+ ,D + ,D 0 Average D | < 1 η ∆ | < 0.5, | cms D y | = 7 TeV s pp, 0.5 ) -1 - baseline (rad ϕ∆ d assoc Nd D N 1 − 0 0.5 1 1.5 scale uncertainty 10% −13% + c < 1 GeV/ assoc T p , 0.3 < c < 5 GeV/ D T p 3 < (rad) ϕ ∆ ) -1 - baseline (rad ϕ∆ d assoc Nd D N 1 0 0.5 1 1.5 2 scale uncertainty 10% −13% + c > 1 GeV/ assoc T p , c < 5 GeV/ D T p 3 < scale uncertainty 10% −13% + c > 0.3 GeV/ assoc T p , c < 8 GeV/ D T p 5 < = 7 TeV s Simulations, pp, PYTHIA6, Perugia 0 PYTHIA6, Perugia 2010 PYTHIA6, Perugia 2011 scale uncertainty 10% −13% + c < 1 GeV/ assoc T p , 0.3 < c < 8 GeV/ D T p 5 < (rad) ϕ ∆ scale uncertainty 10% −13% + c > 1 GeV/ assoc T p , c < 8 GeV/ D T p 5 < scale uncertainty 11% −14% + c > 0.3 GeV/ assoc T p , c < 16 GeV/ D T p 8 < PYTHIA8, Tune 4C POWHEG+PYTHIA6 EPOS 3.117 scale uncertainty 11% −14% + c < 1 GeV/ assoc T p , 0.3 < c < 16 GeV/ D T p 8 < (rad) ϕ ∆ 0 0.5 1 1.5 2 2.5 3 0 0.5 1 1.5 2 2.5 3 0 0.5 1 1.5 2 2.5 3 scale uncertainty 11% −14% + c > 1 GeV/ assoc T p , c < 16 GeV/ D T p 8 <
Fig. 7 Comparison of "ϕ-correlation distributions of D mesons with
charged particles measured in pp collisions at √s= 7 TeV and Monte-Carlo simulations performed with different event generators, after the
subtraction of the baseline. The statistical and systematic uncertainties of the measured distributions are displayed as in Fig.4
analysis. The value of the baseline, mainly determined by the event multiplicity, does not show substantial variations as a
function of D-meson pT, as expected also from PYTHIA and
EPOS 3 simulations, which reproduce the observed values within the uncertainties.
6 Summary
The first measurements of the azimuthal correlations between D mesons with charged particles in pp and p–Pb collisions at √
s= 7 TeV and√sNN = 5.02 TeV, respectively, performed
with the ALICE apparatus at the LHC were presented. The "ϕdistributions were studied in pp collisions in three dif-ferent D-meson transverse-momentum intervals, 3 < pD
T <
5 GeV/c, 5 < pD
T <8 GeV/c, and 8 < pTD <16 GeV/c,
for associated charged particles with pTassoc > 0.3 GeV/c, and in the two sub-ranges 0.3 < passoc
T < 1 GeV/c and
passoc
T > 1 GeV/c. For p–Pb collisions, the results were
reported in two D-meson pTranges, 5 < pDT <8 GeV/c, and 8 < pD
T <16 GeV/c. The baseline-subtracted
azimuthal-correlation distributions observed in the two collision sys-tems are compatible within uncertainties. The variations expected from the lower nucleon-nucleon centre-of-mass energy of p–Pb collisions and from the slightly different D-meson rapidity ranges used for the p–Pb analysis were stud-ied with simulated pp collisions at the two centre-of-mass energies and are well below the sensitivity of the measure-ments.