A unified framework for content-aware view
selection and planning through view
importance
Massimo Mauro1 m.mauro001@unibs.it Hayko Riemenschneider2 http://www.vision.ee.ethz.ch/~rhayko/ Alberto Signoroni1 http://www.ing.unibs.it/~signoron/ Riccardo Leonardi1 http://www.ing.unibs.it/~leon/ Luc Van Gool2http://www.vision.ee.ethz.ch/~vangool/
1Department of Information Engineering
University of Brescia Brescia, Italia
2Computer Vision Lab
Swiss Federal Institute of Technology Zurich, Switzerland
Abstract
In this paper we present new algorithms for Next-Best-View (NBV) planning and Image Selection (IS) aimed at image-based 3D reconstruction. In this context, NBV algorithms are needed to propose new unseen viewpoints to improve a partially recon-structed model, while IS algorithms are useful for selecting a subset of cameras from an unordered image collection before running an expensive dense reconstruction. Our methods are based on the idea of view importance: how important is a given viewpoint for a 3D reconstruction? We answer this by proposing a set of expressive quality features and formulate both problems as a search for views ranked by importance. Our methods are automatic and work directly on sparse Structure-from-Motion output. We can remove up to 90% of the images and demonstrate improved speed at comparable reconstruction quality when compared with state of the art on multiple datasets.
1 Introduction
In the last years there has been a great evolution of the state-of-the-art in 3D reconstruction from images. With the millions of images downloadable from the Internet and community websites such as Flickr, Panoramio, etc, we could pose the challenge to reconstruct the entire world in 3D. But is this really feasible?
The great and unordered deal of available images leads to two challenging problems: completeness and scalability. People usually take photographs from "popular" viewpoints, resulting in 3D models that are incomplete. Such models contain gaps and holes where ad-ditional views are needed. On the other side, the collected images are redundant. Since
c 2014. The copyright of this document resides with its authors. It may be distributed unchanged freely in print or electronic forms.
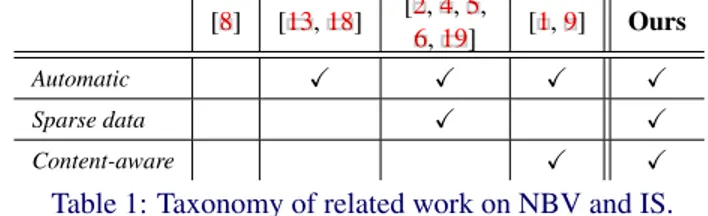
[8] [13,18] [2,4,5,
6,19] [1,9] Ours
Automatic X X X X
Sparse data X X
Content-aware X X
Table 1: Taxonomy of related work on NBV and IS.
processing near-duplicate images increases the computing time without improving the re-construction quality, it is important to reduce the redundancy.
Next-Best-View (NBV) and Image Selection (IS) methods are thus crucial for the ef-fectiveness of world-scale 3D reconstructions. NBV algorithms are needed to propose new viewpoints, IS algorithms are used to select a minimum relevant subset of images before running a SfM or a MVS reconstruction.
This work deals with both problems – view planning and selection, and solves them by considering the view importance of each image. Regarding IS, we focus our attention on the reduction of images before a MVS and show significant speedup without loss of accuracy. Regarding NBV, we automatically determine the next best camera.
1.1 Related Work
Next-Best-View and Image Selection have the common need of selecting good camera view-points. A general classification of related works is presented and summarized in Table1.
Human/Automatic. There exists methods which requires human intervention for se-lecting good viewpoints. Hoppe et al. [8] proposed a Structure-from-Motion (SfM) system which gives an online visual feedback guiding the user during the image acquisition process. The current resolution and image redundancy are shown as quality indicators on the surface model which is incrementally updated. Conversely to this, our method automatically finds the best viewpoints to improve the model.
Sparse/Dense. Many of the proposed algorithms [1,8,9,13,18] require a dense input data representation (mesh, volumetric, or depth maps). In the work of Dunn and Frahm [1] a surface mesh is first extracted and then an aggregate criterion is computed on every triangle which incorporates uncertainty, resolution and 2D visual saliency. Their method can be used for both planning and selection. The selection algorithm of Hornung et al. [9] relies on coverage and visibility cues to guarantee a minimum reconstruction quality and then refines the most difficult regions using photo-consistency. A dense volumetric representation is needed for their method to work. Tingdahl et al. [18] employ depth maps for reducing the set of initial views. In our approach we propose to directly exploit the SFM output and estimate the reconstruction quality on its sparse point cloud data.
Content-free/aware. Most methods [2, 4, 5, 6, 8, 13, 18, 19] are independent from content. They work only with accuracy and/or coverage objectives in mind, without con-sidering the visual or geometric properties of the object to reconstruct. In [6] a covariance propagation method is implemented which decides a camera calibration order with the goal of minimizing the reconstruction uncertainty. Goesele et al. [5] and Gallup et al. [4] se-lect viewpoints relying on simple properties of the input images such as resolution or base-line. Furukawa et al. [2] divide the camera set into clusters to make the MVS scalable, and also remove redundant images while respecting both cluster size and coverage constraints. Content-aware approaches use additional cues to consider the appearance and the geometric
properties of the model. NBV and IS algorithms may benefit from content-awareness [15], avoiding to suggest or retain viewpoints on useless flat textureless parts.
In this work, we present two algorithms for NBV planning and IS based on view impor-tance, which is a content-aware estimation of the significance of a camera for a 3D recon-struction. We propose a set of quality features which are expressive of the view importance and are computed directly on the sparse SfM point cloud data. Despite NBV and IS problems have a common ground, only few of the related works face them together. We formulate in-stead both problems in a unified framework, as a search for important/non-important views. The rest of the paper is structured as follows. In Section2 we introduce the proposed quality features. In Section 3 we explain how we use such features for the estimation of the view importance in NBV and IS algorithms. Experimental evaluation are conducted in Section4, while in Section5we discuss the future work and conclude the paper.
2 Quality features
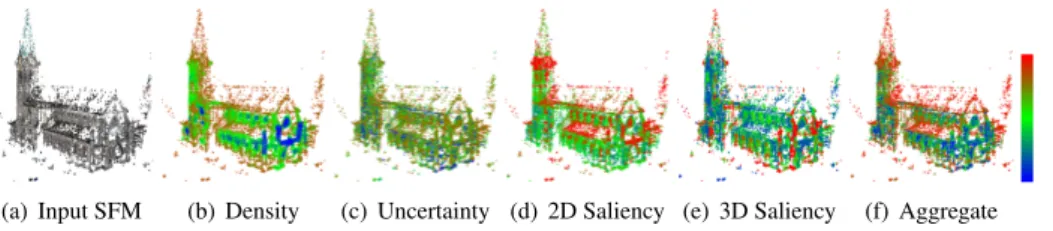
We adopt four quality features in our method: density, uncertainty, 2D and 3D saliency. We call them FD, FU, F2Dand F3Drespectively. Before the feature extraction, the input point
cloud is normalized. The normalization scales the point cloud to have a unit average distance ( ¯R = 1) between all its points and their nearest neighbors. This allows the feature extraction, camera positions and consequent methods to work without dependency from the scale.
Density. The density feature is defined as the number of points contained in a sphere of radius R around the point. Given a point cloud P and a point pibelonging to it, FDis
FD=|Si|, Si={pj|d(pi,pj) R} with pj2 P. (1)
The density feature may be interpreted as the counterpart of the tetrahedra resolution for methods where the point cloud is first transformed in a surface mesh [1]. In both cases the objective is to understand if the 3D object is well-covered by the input image data. For den-sity estimation, we set the radius of the sphere to R = 10 ¯R. This value and all the parameters in the rest of the paper are constant and generalize well on all test datasets.
Uncertainty. The uncertainty in the position of a reconstructed point depends on the an-gle between its viewing directions: in general, having a greater anan-gle reduces the estimation uncertainty [7], up to an angle limit between 30 and 40 beyond which the same point can not be matched among different images.Our uncertainty feature considers the maximum an-gle between the viewing directions of the evaluated point. Given a point piwith its associated
set of viewing directions Vi, the uncertainty feature FU is
FU=max
Vi \(!vj, !vk)with vj,vk2 Vi. (2) 2D saliency. The 2D saliency of a point is the meaningfulness of the point neighborhood in the original image. We project every 3D SfM point in the Nvoriginal images where it is
visible, and consider a square patch around each projection. The saliency of a 2D patch is estimated as the mean image gradient magnitude of the windowed region. We again average the saliency over all Nvimage patches for robustness against occlusions. Given a point pi
and a the set of Nvrelative image patches Sithe feature F2Dis
F2D=N1 v 1 |Si| Nv
Â
i=1 |Si|Â
j=1k !— (S i(j)) k with j 2 Si (3)(a) Input SFM (b) Density (c) Uncertainty (d) 2D Saliency (e) 3D Saliency (f) Aggregate
Figure 1: Example of single and aggregate energies extracted on an example SfM point cloud. Energies are in the range [0-1] and are color-coded in a blue-green-red color scheme.
3D saliency. The 3D saliency measures the geometric complexity around a point. We adopt the recently proposed Difference of Normals (DoN) operator [10] as our F3Dfeature.
The DoN is defined as the (normalized) length of the difference vector between two point normals estimated at different scales:
F3D=12(ˆnr1(pi) ˆnr2(pi)) (4) where ˆnr(pi)is the normal estimated at point piwith support radius r. We choose r1=10 ¯R
and r2=20 ¯R as support radius for the two scales.
2.1 Feature aggregation
At this point all the features have different ranges. We rescale them in the range [0,1] and we call normalized energies the obtained values. We then use the energies in the computation of an aggregate criterion. To transform feature values into the [0,1] range, we adopt a modified logistic function L(x µ,s) defined as
L(x µ,s) = 1
1 + e 2(xsµ)
(5) Density energy. High energy values correspond to low-density area where the recon-struction should be improved. We thus define ED=1 L(FD µD,sD)withµD=sD=100
Uncertainty energy. Uncertainty values are angles between viewpoints. We should have high energy where the maximum angle between viewpoints is too narrow. We define EU=1 L(FU µU,sU)withµU=30 andsU=10 .
Saliency energy. Both 2D and 3D saliency indicate importance when their values are high. Hence we follow a similar scheme and define the normalization as E2D=L(F2D
µ2D,s2D)and E3D=L(F3D µ3D,s3D)withµ2D=s2D=0.35,µ3D=s3D=0.15.
Aggregate energy. Examples of the energies are shown in Figure1 and2. The ag-gregation is defined with weights wD=wU =13, w2D=w3D=16 as a linear combination
Eagg=wDED+wUEU+w2DE2D+w3DE3D (6)
3 View importance
The key concept behind both our IS and NBV algorithms is the view importance. Given a point cloud P, the view importance I of a camera C is defined as the mean energy Eagg
combined over all its visible points:
I(C,P) =Âpi2VCEagg(pi)
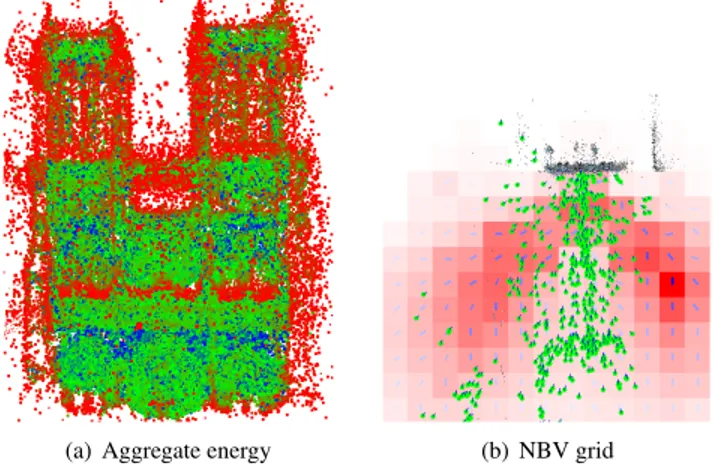
(a) Aggregate energy (b) NBV grid
Figure 2: Aggregate energy (a) and the resulting Next-Best-View grid (b) for the Notre Dame dataset. In the grid, a blue arrow in every cell indicates the best orientation.
where VCis the set of points in P visible from camera C. We use this basic definition in two
variants IISand INBV (for IS and NBV respectively) to better adapt to the problem at hand.
3.1 Image selection
The aim of an image selection (IS) algorithm is to remove redundant images. Most methods to achieve this task are "coverage-guided". That is, they select a subset of images which guarantees a good coverage, and in some cases [9] they must re-add single images in a following step to improve the most critical parts. We use instead an "importance-guided" approach: at every step our algorithm cuts out the worst view in terms of view importance.
The worst view. The worst view satisfies the relation:
CIS=argminC IIS(C,P) (8)
where view importance IISis a modified version of I in Equation7and is defined as
IIS(C,P) = Âpi2VCwcEagg(pi)
|VC| (9)
Coverage weight. The factor wcis the coverage weight for a camera. Given a camera C,
wcis defined as the ratio between the number of 3D points which are lost by the elimination
of C and the total number of points seen by the same camera. The goal of wcis to avoid the
creation of holes or missing parts in the reconstruction. A point is considered lost when it is seen by less than two cameras. We employ a size constraint to set the desired number NI
of images or a coverage constraint to limit the coverage factor wc. Cameras with a coverage
below wcare not removed. In Figure3we show the three best and worst views for 4 datasets,
(a) Best1 (b) Best2 (c) Best3 (d) Worst1 (e) Worst2 (f) worst3
(g) Best1 (h) Best2 (i) Best3 (j) Worst1 (k) Worst2 (l) Worst3
(m) Best1 (n) Best2 (o) Best3 (p) Worst1 (q) Worst2 (r) Worst3
(s) Best1 (t) Best2 (u) Best3 (v) Worst1 (w) Worst2 (x) Worst3
Figure 3: Best and worst views on Fraumunster [12] (1st row), Hall [3] (2nd row), Notre
Dame [16] (3rdrow) and Yotta [14] (4throw) datasets according to Equation9.
3.2 Next-Best-View (NBV)
The goal of a NBV algorithm is to find the camera CNBV with the largest view importance
CNBV=argmaxC INBV(C,P) (10)
A camera C is characterized by a camera center c, a camera orientation ~o, and a set of visible points VC. Point visibility for a given camera C(c,~o) is estimated considering a fixed field of
view which can be optionally specified.
Plane approximation. A great deal of images used for reconstruction are collected manually by humans. Hence, for simplicity we focus on 2D yet 3D is also possible. We simplify the NBV search by fitting a plane primitive to the given camera centers. We define a rectangular region (cube for 3D) over this plane large enough to contain the point cloud.
Search space quantization. This rectangular area is then quantized in a Nc⇥ Nc 2D
grid. A camera is positioned in the middle point of every grid cell and for each of them we consider Noevenly spaced orientations. For view planning the CNBV(c,o) is searched among
the obtained set of Nc⇥ Nc⇥ Nocameras. In our experiments, we set Nc=20 and No=12.
The result is shown as a view importance grid as in Figure2.
There are two factors when planning the NBV in our scenario. First, we favor cameras which have a similar distance to the object as the given cameras. Second, the NBV requires novel viewing angles compared to the available cameras. The view importance in the context
of NBV planning is therefore defined as
INBV(C,P) =Âpi2VCwdwaEagg(pi)
|VC| (11)
with wdas a distance weight and waas a angle weight for balanced view estimation.
Distance weight. Viewpoints that are too near or too far from the structure are not useful in reconstruction. We thus introduce a distance weight wdto penalize distant views by
wd(C, pi) =e
⇣d(pi,C) µd
sd
⌘2
(12) where d(pi,C) is the distance between the point piand the considered camera C,µd is the
mean distance between cameras and their visible points, and we setsd=µd.
Angle weight. Views are more meaningful if they look at the scene from novel yet overlapping viewing angles, otherwise they are redundant, cannot match and do not reduce the uncertainty. We thus favor novel viewpoints by defining an angle weight waas
wa(C, pi) =e
⇣amin µa
sa
⌘2
(13) whereaminis the minimum angle between the considered viewing direction and all the other
directions from which the considered point pihas already been seen. This is in practice an
estimation of the novelty of the viewing direction. We setµa=30 andsa=10 .
4 Experimental Evaluation
We evaluate our methods both quantitatively and visually: a precise quantitative comparison is made on the Image Selection (IS), while for the Next-Best-View (NBV) planning the obtained 2D grids are analyzed and discussed.
4.1 Image Selection
For a quantitative analysis of IS, we require a ground truth and a set of evaluation metrics. Ground truth. Ground truth is not readily available for these experiments as there is no best minimal set of images with an optimal point cloud. We consider as ground truth the 3D models that are obtained when the complete image set is used. The goal is to compare the number of removable images and the consequent speed improvement while maintaining a high reconstruction quality.
Evaluation metrics. We consider two different metrics for evaluating quality:
• Coverage: We evaluate coverage on the dense point clouds obtained by means of the PMVS reconstruction software [3]. Considering a ground-truth point cloud G and a point cloud P to be tested, for every point gi in G, we evaluate the distance dGP to
the nearest point in P. The point gi is "covered" if such distance is below a defined
threshold dGP2=4R. The coverage metric is the percentage of covered points in G.
• Hausdorff distance: We reconstruct two mesh Pmand Gmfrom the point clouds, using
the Poisson surface reconstruction algorithm [11]. The Hausdorff distance between the two meshes is obtained by finding for each vertex of Pmthe closest point on Gm.
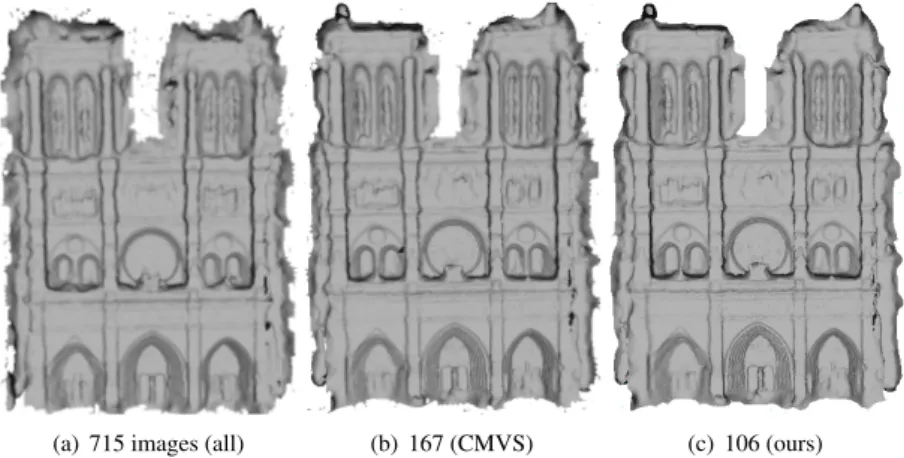
(a) 715 images (all) (b) 167 (CMVS) (c) 106 (ours)
Figure 4: Poisson surface reconstructions for Notre Dame dataset w.r.t. number of images.
Dataset Hall Fraumunster Yotta Notredame
Type structured structured streetside unstructured
# images 61 98 380 715 CMVS # selected 37 57 253 167 Ours # selected 35 46 188 106 CMVS Coverage 96.5% 97.8% 96.6% 93.8% Ours Coverage 96.5% 97.6% 96.6% 93.1% CMVS Hausdorff (max/mean) 0.48490/0.02835 0.048108/0.000287 0.045820/0.000313 1.330708/0.039537 Ours Hausdorff (max/mean) 0.44815/0.01154 0.033291/0.000296 0.049773/0.000177 1.435019/0.029425
CMVS Speedup 2.3x 1.8x 3.0x 9.6x
Our Speedup 2.4x 2.8x 4.1x 19.8x
Table 2: Quantitative results on different datasets.
Results. We compare our method with the image selection method in CMVS proposed by Furukawa et al. [2]. We consider different types of datasets: two structured datasets (Hall [3] and Fraumunster [12]), a streedside dataset (Yotta [14]) and a large unstructured dataset (Notre Dame [16]) We set wc=0.3 in our experiments as we found it to be a good tradeoff
between quality and number of selected images for all datasets.
In Table2we collect all the quantitative results. The quality metrics are comparable for all datasets. In all cases, our method can select a smaller subset with respect to CMVS and hence speedup the full PMVS reconstruction. The best situation is for large unstructured datasets having much redundancy. For Notre Dame, in fact, we can remove more than 90% of the images (609/715), reducing the runtime of the reconstruction to 1/20th of the time. Moreover, the quantitative metrics show that our method produces a mesh closer to the ref-erence, as we obtain lower Hausdorff distances on average. A visual comparison of the three reconstructions in Figure4confirms that selection is performed without causing significant differences in reconstruction quality. Additional reconstruction results can be found in the supplementary material.
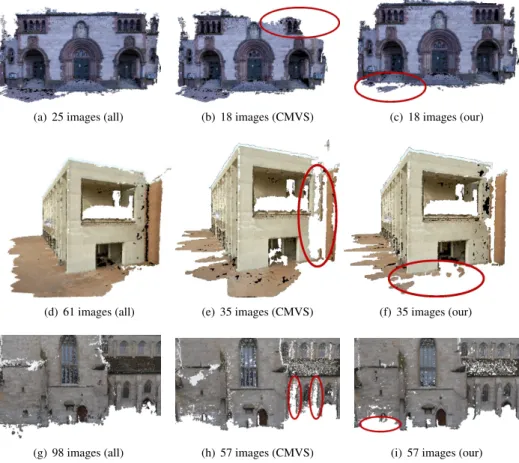
Benefits of content-awareness. In Figure5we show how selection is affected by the use of content. First, we show the reconstruction obtained on the smaller Herzjesu-P25 [17] dataset when all the images are used and with subsets of the same size for CMVS and our selection. CMVS selection removes the top part of the building wall, which has strong structural content. Our IS instead removes part of the textureless flat ground, which is less
(a) 25 images (all) (b) 18 images (CMVS) (c) 18 images (our)
(d) 61 images (all) (e) 35 images (CMVS) (f) 35 images (our)
(g) 98 images (all) (h) 57 images (CMVS) (i) 57 images (our)
Figure 5: PMVS reconstructions of Herzjesu-P25, Hall and Fraumunster datasets showing the effects of content-awareness. Our method keeps the most salient and textured regions.
important and thus removable. The same content-aware effect occurs in the second and third examples on the Hall and Fraumunster datasets. While CMVS tends to lose salient regions, our content-aware selection by means of view importance keeps the salient parts of the scene and sacrifices planar or unimportant regions.
4.2 Next-Best-View grids
The goal of Next-Best-View is to suggest the best location for taking the next image given a partial reconstruction. Our method estimates the exact location and also orientation.
In Figure2we showed the NBV map for the Notre Dame dataset. In this dataset, where all the images have been taken from a frontal viewpoint, our method suggests to take views at the boundary of the structure, guiding human photographers to explore the unseen parts of the Notre Dame church. Note that too far, too near, or too step viewpoints have low importance as an effect of wdand waweights defined above.
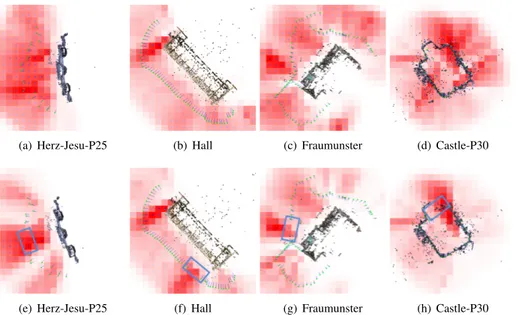
Further, we show the effectiveness of our NBV algorithm comparing the grids in case of removed cameras. In Figure 6 we draw on the top the grids obtained when using the complete dataset, while at the bottom the maps are obtained removing a set of contiguous
(a) Herz-Jesu-P25 (b) Hall (c) Fraumunster (d) Castle-P30
(e) Herz-Jesu-P25 (f) Hall (g) Fraumunster (h) Castle-P30
Figure 6: Next-Best-View (NBV) grids for (top) all views and (bottom) removed cameras. Note how the importance increased significantly where cameras are removed (box).
cameras. In the first group of grids, view importance focuses on the boundary of the 3D scenes but is mostly spread out. This is because the structures are generally well-covered by the set of available cameras. However, when cameras are removed, our method effectively suggests viewpoints in the regions corresponding to artificially deleted cameras.
5 Conclusions
In this work, we proposed two algorithms for Next-Best-View (NBV) planning and Image Selection (IS) based on the concept of view importance. View importance is a content-aware estimation of the significance of a camera for a 3D reconstruction and is computed through a set of proposed quality features extracted directly on a sparse SFM point cloud.
The experiments show the effectiveness of the proposed content-aware methods. Our NBV planning effectively finds regions where viewpoints are missing and shows the di-rection and the position where to take the next image. Our IS method greatly reduces the number of images (up to 90%) without losing salient regions of the scene, with the benefit of significant runtime savings (up to 1/20th). The same-sized image subsets found by us compare favorably with the state-of-the-art image selection in CMVS [2].
As future work, the NBV method may be generalized to a continuous 3D search space, which helps for non-discrete 3D movement (e.g. aerial vehicles). For IS, we plan to integrate selection and clustering similar to [2,12] in a joint end-to-end optimization.
Acknowledgments. This work was supported by the European Research Council (ERC) under the project VarCity (#273940) and by the Italian Ministry of Education, University and Research under the PRIN project BHIMM (Built Heritage Information Modeling and Management).
References
[1] Enrique Dunn and Jan-Michael Frahm. Next best view planning for active model improvement. In BMVC, 2009.
[2] Y. Furukawa, B. Curless, S. Seitz, and R. Szeliski. Towards internet-scale multi-view stereo. In CVPR, 2010.
[3] Yasutaka Furukawa and Jean Ponce. Accurate, dense, and robust multi-view stereopsis. In CVPR, 2007.
[4] David Gallup, J-M Frahm, Philippos Mordohai, and Marc Pollefeys. Variable baseline/resolution stereo. In CVPR, 2008.
[5] Michael Goesele, Noah Snavely, Brian Curless, Hugues Hoppe, and Steven Seitz. Multi-view stereo for community photo collections. In CVPR, 2007.
[6] Sebastian Haner and Anders Heyden. Covariance propagation and next best view planning for 3d reconstruction. In ECCV, 2012.
[7] Richard Hartley and Andrew Zisserman. Multiple view geometry in computer vision, volume 2. Cambridge Univ Press, 2000.
[8] C. Hoppe, M. Klopschitz, M. Rumpler, A. Wendel, S. Kluckner, H. Bischof, and G. Reitmayr. Online feedback for structure-from-motion image acquisition. In BMVC, 2012.
[9] Alexander Hornung, Boyi Zeng, and Leif Kobbelt. Image selection for improved multi-view stereo. In CVPR, 2008.
[10] Y. Ioanou, B. Taati, R. Harrap, and M. Greenspan. Difference of normals as a multi-scale operator in unorganized point clouds. In 3DPVT, 2012.
[11] Michael Kazhdan, Matthew Bolitho, and Hugues Hoppe. Poisson surface reconstruction. In Proceedings of the fourth Eurographics symposium on Geometry processing, 2006.
[12] Massimo Mauro, Hayko Riemenschneider, Luc Van Gool, and Riccardo Leonardi. Overlapping camera clustering through dominant sets for scalable 3d reconstruction. In BMVC, 2013. [13] Qi Pan, Gerhard Reitmayr, and Tom W Drummond. Interactive model reconstruction with user
guidance. In ISMAR, 2009.
[14] Sunando Sengupta, Paul Sturgess, Philip HS Torr, et al. Automatic dense visual semantic map-ping from street-level imagery. In Intelligent Robots and Systems (IROS), 2012 IEEE/RSJ Inter-national Conference on, pages 857–862. IEEE, 2012.
[15] E. Shtrom, G. Leifman, and A. Tal. Saliency Detection in Large Point Sets. In ICCV, 2013. [16] Noah Snavely, Steven M Seitz, and Richard Szeliski. Photo tourism: exploring photo collections
in 3d. In ACM transactions on graphics (TOG), volume 25, pages 835–846. ACM, 2006. [17] C. Strecha, W. von Hansen, L. Van Gool, P. Fua, and U. Thoennessen. On benchmarking camera
calibration and multi-view stereo for high resolution imagery. In CVPR, 2008.
[18] David Tingdahl and Luc Van Gool. A public system for image based 3d model generation. In Computer Vision/Computer Graphics Collaboration Techniques, pages 262–273. Springer, 2011. [19] Stefan Wenhardt, Benjamin Deutsch, Elli Angelopoulou, and Heinrich Niemann. Active visual
![Figure 3: Best and worst views on Fraumunster [ 12 ] (1 st row), Hall [ 3 ] (2 nd row), Notre](https://thumb-eu.123doks.com/thumbv2/123dokorg/5518720.64216/6.612.29.578.43.454/figure-best-worst-views-fraumunster-row-hall-notre.webp)