ЯДЕРНА ФІЗИКА NUCLEAR PHYSICS
УДК 539.1.074.3, 524.8 https://doi.org/10.15407/jnpae2018.04.307 R. Bernabei1,2,*, P. Belli1,2, A. Bussolotti2, F. Cappella3,4, V. Caracciolo5, R. Cerulli1,2, C. J. Dai6,
A. d’Angelo3,4, A. Di Marco2, H. L. He6, A. Incicchitti3,4, X. H. Ma6, A. Mattei4, V. Merlo1,2, F. Montecchia2,7, X. D. Sheng6, Z. P. Ye6,8
1 Dipartimento di Fisica, Università di Roma “Tor Vergata”, Rome, Italy
2 INFN, sez. Roma “Tor Vergata”, Rome, Italy
3 Dipartimento di Fisica, Università di Roma “La Sapienza”, Rome, Italy
4 INFN, Sezione di Roma, Rome, Italy
5 INFN Laboratori Nazionali del Gran Sasso, Assergi, Italy
6 Key Laboratory of Particle Astrophysics, Institute of High Energy Physics,
Chinese Academy of Sciences, Beijing, P.R. China
7 Dipartimento Ingegneria Civile e Ingegneria Informatica, Università di Roma “Tor Vergata”, Rome, Italy
8 University of Jinggangshan, Ji’an, Jiangxi, P.R. China
*Corresponding author: [email protected]
FIRST MODEL INDEPENDENT RESULTS FROM DAMA/LIBRA-PHASE2
The first model independent results obtained by the DAMA/LIBRA-phase2 experiment are presented. The data have been collected over 6 annual cycles corresponding to a total exposure of 1.13 t yr, deep underground at the Gran Sasso National Laboratory (LNGS) of the I.N.F.N. The DAMA/LIBRA-phase2 apparatus, ≃ 250 kg highly radio-pure NaI(Tl), profits from a second generation high quantum efficiency photomultipliers and of new electronics with respect to DAMA/LIBRA-phase1. The improved experimental configuration has also allowed to lower the software energy threshold. New data analysis strategies are presented. The DAMA/LIBRA-phase2 data confirm the evidence of a signal that meets all the requirements of the model independent Dark Matter (DM) annual modulation signature, at 9.5 C.L. in the energy region (1 - 6) keV. In the energy region between 2 and 6 keV, where data are also available from DAMA/NaI and DAMA/LIBRA-phase1 (exposure 1.33 t yr, collected over 14 annual cycles), the achieved C.L. for the full exposure (2.46 t yr) is 12.9 ; the modulation amplitude of the single-hit scintillation events is: (0.0103 ± ± 0.0008) cpd/kg/keV, the measured phase is (145 ± 5) d and the measured period is (0.999 ± 0.001) yr, all these values are well in agreement with those expected for DM particles. No systematics or side reaction able to mimic the exploited DM signature (i.e. to account for the whole measured modulation amplitude and to simultaneously satisfy all the requirements of the signature), has been found or suggested by anyone throughout some decades thus far.
Keywords: scintillation detectors, elementary particle processes, Dark Matter. PACS numbers: 29.40.Mc; 95.30.Cq; 95.35.+d.
1. Introduction
DAMA/LIBRA [1 - 20] experiment, as the pioneer DAMA/NaI [21 - 48], has the main aim to investigate the presence of DM particles in the galactic halo by exploiting the DM annual modulation signature (originally suggested in Refs. [49, 50]). In addition, the developed highly radio-pure NaI(Tl) target-detectors [1, 6, 9, 51] ensure sensitivity to a wide range of DM candidates, interaction types and astrophysical scenarios (see e.g. Refs. [2, 14, 16 - 18, 22 - 29, 32 - 39], and in literature).
The origin of the DM annual modulation signature and of its peculiar features is due to the Earth motion with respect to the DM particles constituting the Galactic Dark Halo, so it is not related to terrestrial seasons. In fact, as a consequence of the Earth's revolution around the Sun, which is moving in the Galaxy with respect to
the Local Standard of Rest towards the star Vega near the constellation of Hercules, the Earth should be crossed by a larger flux of DM particles around ≃ 2 June and by a smaller one around ≃ 2 December. In the former case, the Earth orbital velocity is summed to that of the solar system with respect to the Galaxy, while in the latter the two velocities are subtracted. The DM annual modulation signature is very distinctive since the effect induced by DM particles must simultaneously satisfy all the following requirements: the rate must contain a component modulated according to a cosine function (1) with 1 yr period (2) and a phase that peaks roughly ≃ 2 June (3); this modulation must only be found in a well-defined low energy range, where DM particle induced events can be present (4); it must apply only to those events in which just one detector of many actually “fires” (single-hit events), since the DM particle multi-© R. Bernabei, P. Belli, A. Bussolotti, F. Cappella, V. Caracciolo, R. Cerulli, C. J. Dai, A. D’Angelo, A. Di Marco, H. L. He, A. Incicchitti, X. H. Ma, A. Mattei, V. Merlo, F. Montecchia, X. D. Sheng, Z. P. Ye, 2018
R. BERNABEI, P. BELLI, A. BUSSOLOTTI ET AL.
interaction probability is negligible (5); the modulation amplitude in the region of maximal sensitivity must be ≲ 7 % of the constant part of the signal for usually adopted halo distributions (6), but it can be larger in case of some proposed scenarios such as e.g. those in Refs. [52 - 56] (even up to ≃ 30 %). Thus this signature is not dependent on the nature of the DM particle, has many peculiarities and, in addition, it allows to test a wide range of parameters in many possible astrophysical, nuclear and particle physics scenarios.
This DM signature might be mimicked only by systematic effects or side reactions able to account for the whole observed modulation amplitude and to simultaneously satisfy all the requirements given above; none able to do that has been found or suggested by anyone throughout some decades thus far (see e.g. Refs. [1 - 5, 7, 8, 19, 31 - 33].
The full description of the DAMA/LIBRA set-up and the adopted procedures during the phase1 and other related arguments have been discussed in details e.g. in Refs. [1 - 5].
At the end of 2010 the upgrade of DAMA/LIBRA-phase2 started. All the photo-multipliers (PMTs) were replaced by a second generation PMTs Hamamatsu R6233MOD, with higher quantum efficiency (Q.E.) and with lower background with respect to those used in phase1; they were produced after a dedicated R&D in the company, and tests and selections [6, 51]. The new PMTs have Q.E. in the range 33 - 39 % at 420 nm, wavelength of NaI(Tl) emission, and in the range 36 - 44 % at peak. The commissioning of the experiment was successfully performed in 2011, allowing the achievement of the software energy threshold at 1 keV, and the improvement of some detector's features such as energy resolution and acceptance efficiency near software energy threshold [6].
The adopted procedure for noise rejection near software energy threshold is discussed in several papers by DAMA collaboration along the years and data releases; in particular, as regards the data collected in the DAMA/LIBRA-phase2 configu-ration a dedicated discussion is presented in section 7 of Ref. [6]. The procedure and, in particular, the acceptance windows are the same unchanged as described there along all the DAMA/LIBRA-phase2 data taking, throughout the months and the annual cycles. The typical behaviour of the overall efficiency for single-hit events as a function of the energy is also shown in section 7 of Ref. [6], while in Ref. [20] the percentage variations of the efficiency are shown, considering all the DAMA/LIBRA-phase2 annual cycles presented here; they follow a gaussian distribution with = 0.3 % and do not show any modulation with
period and phase as expected for the DM signal [20]. The investigation of the DM annual modulation at lower energy threshold with respect to DAMA/LIBRA-phase1 has been deeply supported by the interest in studying the nature of the DM candidate particles, the features of related astrophysical, nuclear and particle physics aspects and by the potentiality of an improved sensitivity in future to investigate both DM annual and diurnal signatures. Detailed studies will be presented in following papers.
At the end of 2012 new preamplifiers and special developed trigger modules were installed and the apparatus was equipped with more compact electronic modules [57]. Here we just remind that the sensitive part of DAMA/LIBRA-phase2 set-up is made of 25 highly radio-pure NaI(Tl) crystal scintillators (5-rows by 5-columns matrix) having 9.70 kg mass each one; quantitative analyses of residual contaminants are given in Ref. [1]. In each detector two 10 cm long UV light guides (made of Suprasil B quartz) act also as optical windows on the two end faces of the crystal, and are coupled to two low background PMTs working in coincidence at single photoelectron level. The detectors are housed in a sealed low-radioactive copper box installed in the center of a low-radioactive Cu/Pb/Cd-foils/polyethylene/paraffin shield; more-over, about 1 m concrete (made from the Gran Sasso rock material) almost fully surrounds (mostly outside the barrack) this passive shield, acting as a further neutron moderator. The shield is decoupled from the ground by a metallic structure mounted above a concrete basement; a neoprene layer separates the concrete basement and the floor of the laboratory. The space between this basement and the metallic structure is filled by paraffin for several tens cm in height.
A threefold-level sealing system prevents the detectors from contact with the environmental air of the underground laboratory and continuously maintains them in HP (high-purity) Nitrogen atmosphere. The whole installation is under air conditioning to ensure a suitable and stable working temperature. The huge heat capacity of the multi-tons passive shield ( 106 cal/oC) guarantees further relevant stability of the detectors' operating temperature. In particular, two independent systems of air conditioning are available for redundancy: one cooled by water refrigerated by a dedicated chiller and the other operating with cooling gas. A hardware/software monitoring system provides data on the operating conditions. In particular, several probes are read out and the results are stored with the production data. Moreover, self-controlled computer based processes automatically monitor several parameters, including those from DAQ, and
manage the alarms system. All these procedures, already experienced during DAMA/LIBRA-phase1 [1 - 5], allow us to control and to maintain the running conditions stable at a level better than 1 % also in DAMA/LIBRA-phase2 (see e.g. Ref. [20]).
The light response of the detectors during phase2 typically ranges from 6 to 10 photoelectrons/keV, depending on the detector. Energy calibration with X-rays/ sources are regularly carried out in the same running condition down to few keV (for details see e.g. Ref. [1]; in particular, double coincidences due to internal X-rays from 40K (which is at ppt levels in the crystals) provide (when summing the data over long periods) a calibration point at 3.2 keV close to the software energy threshold. The DAQ system records both single-hit events (where just one of the detectors fires) and multiple-hit events (where more than one detector fires) up to the MeV region despite the optimization is performed for the lowest energy.
The radio-purity and details are discussed e.g. in Refs. [1 - 5, 51] and references therein. The adopted procedures provide sensitivity to large and low mass DM candidates inducing nuclear recoils and/or electromagnetic signals.
The data of the former DAMA/NaI setup and, later, those of the DAMA/LIBRA-phase1 have already given (with high confidence level) positive evidence for the presence of a signal that satisfies all the requirements of the exploited DM annual modulation signature [2 - 5, 32, 33]. Moreover, no systematic or side processes able to simultaneously
satisfy all the many peculiarities of the signature and to account for the whole measured modulation amplitude has been found or suggested by anyone throughout some decades thus far.
In this paper the model independent result of six annual cycles of DAMA/LIBRA-phase2 is presented. The total exposure of DAMA/LIBRA-phase2 is: 1.13 t yr with an energy threshold at 1 keV; when including also that of the first generation DAMA/NaI experiment and DAMA/LIBRA-phase1 the cumulative exposure is 2.46 t yr, corresponding to twenty independent annual cycles.
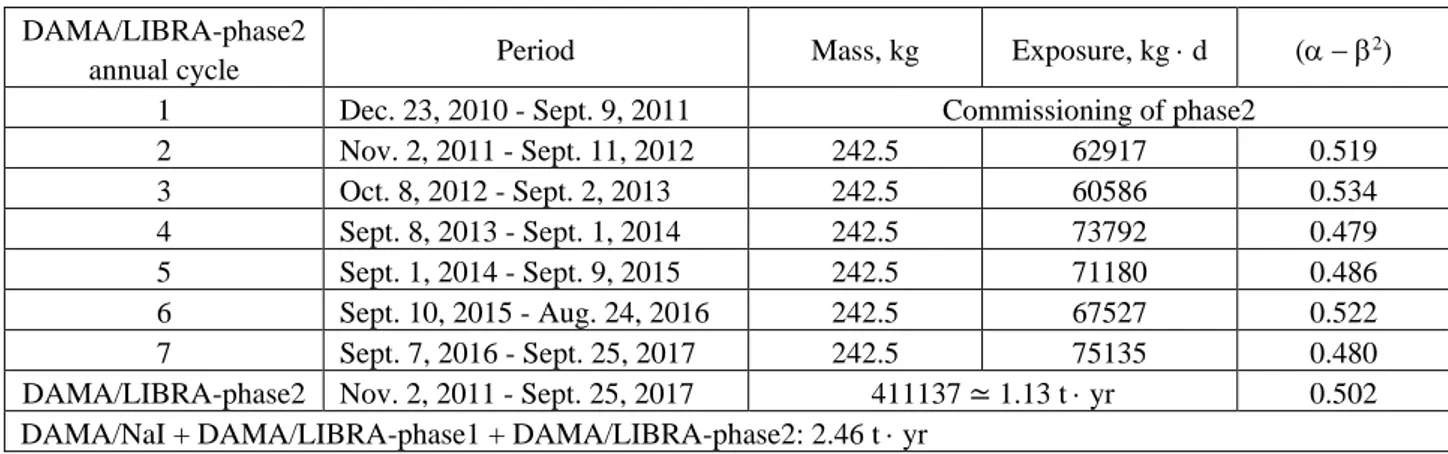
2. The DAMA/LIBRA-phase2 annual cycles The details of the annual cycles of DAMA/LIBRA-phase2 are reported in Table 1. The first annual cycle was dedicated to the commissioning and to the optimizations towards the achievement of the 1 keV software energy threshold [6]. This period has: i) no data before/near Dec. 2, 2010; ii) data sets with some set-up modifications; iii) ( 2) = 0.355 well different from 0.5 (i.e. the detectors were not being operational evenly throughout the year). Thus, this period cannot be used for the annual modulation studies; however, it has been used for other purposes [6, 13]. Therefore, as shown in Table 1 the considered annual cycles of DAMA/LIBRA-phase2 are six (exposure of 1.13 t yr). The cumulative exposure, also consi-dering the former DAMA/NaI and DAMA/LIBRA-phase1, is 2.46 t yr.
Table 1 DAMA/LIBRA-phase2
annual cycle Period Mass, kg Exposure, kg d (
2)
1 Dec. 23, 2010 - Sept. 9, 2011 Commissioning of phase2
2 Nov. 2, 2011 - Sept. 11, 2012 242.5 62917 0.519 3 Oct. 8, 2012 - Sept. 2, 2013 242.5 60586 0.534 4 Sept. 8, 2013 - Sept. 1, 2014 242.5 73792 0.479 5 Sept. 1, 2014 - Sept. 9, 2015 242.5 71180 0.486 6 Sept. 10, 2015 - Aug. 24, 2016 242.5 67527 0.522 7 Sept. 7, 2016 - Sept. 25, 2017 242.5 75135 0.480
DAMA/LIBRA-phase2 Nov. 2, 2011 - Sept. 25, 2017 411137 ≃ 1.13 t yr 0.502 DAMA/NaI + DAMA/LIBRA-phase1 + DAMA/LIBRA-phase2: 2.46 t yr
N o t e. Details about the annual cycles of DAMA/LIBRA-phase2. The mean value of the squared cosine is = cos2 (t t
0) and the mean value of the cosine is = cos (t t0) (the averages are taken over the live time of
the data taking and t0 = 152.5 d, i.e. June 2nd); thus, the variance of the cosine, ( 2), is ≃ 0,5 for a detector being
operational evenly throughout the year.
The total number of events collected for the energy calibrations during DAMA/LIBRA-phase2 is about 1.3 108, while about 3.4 106 events/keV have been collected for the evaluation of the acceptance window efficiency for noise rejection near the software energy threshold [1, 6].
As it can be inferred from Table 1, the duty cycle of the experiment is high, ranging between 76 and 85 %. The routine calibrations and, in particular, the data collection for the acceptance windows efficiency mainly affect it.
R. BERNABEI, P. BELLI, A. BUSSOLOTTI ET AL.
Energy, keV
Fig. 1. Cumulative low-energy distribution of the single-hit scintillation events (that is each detector has all the others as veto), as measured by the DAMA/LIBRA-phase2 in an exposure of 1.13 t yr.
Finally, Fig. 1 shows the low energy distribution of the DAMA/LIBRA-phase2 single-hit scintillation events. It is worth noting that, while DAMA/LIBRA-phase1 showed a very good linearity between the calibration with the 59.5 keV line of 241Am and the tagged 3.2 keV line of 40K [1], in DAMA/LIBRA-phase2 a slight non-linearity is observed (it gives a shift of about 0.2 keV at the software energy threshold and vanishes above 15 keV). This is taken into account in Fig. 1 and following analyses1.
3. The annual modulation of the residual rate
The same procedures already adopted for the DAMA/LIBRA-phase1 [1 - 5] have been exploited in the analysis of DAMA/LIBRA-phase2.
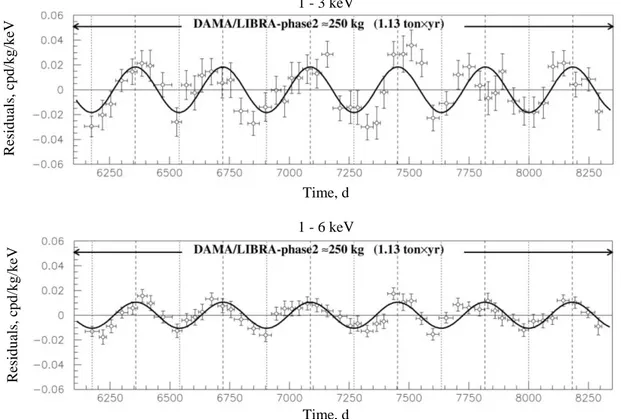
1 - 3 keV
Time, d 1 - 6 keV
Time, d
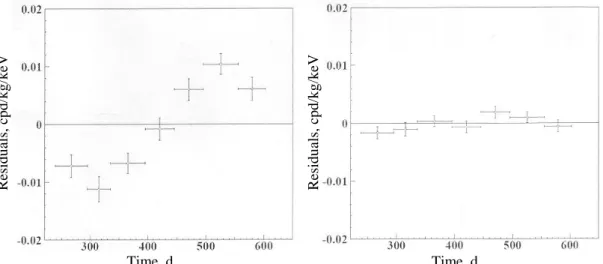
Fig. 2. Experimental residual rate of the single-hit scintillation events measured by DAMA/LIBRA-phase2 in the (1 - 3), (1 - 6) keV energy intervals as a function of the time. The time scale is maintained the same of the previous DAMA papers for consistency. The data points present the experimental errors as vertical bars and the associated time bin width as horizontal bars. The superimposed curves are the cosinusoidal functional forms A cos (t t0) with a
period T = 2/ = 1 yr, a phase t0 = 152.5 d (June 2nd) and modulation amplitudes, A, equal to the central values
obtained by best fit on the data points of the entire DAMA/LIBRA-phase2. The dashed vertical lines correspond to the maximum expected for the DM signal (June 2nd), while the dotted vertical lines correspond to the minimum.
1 Similar non-linear effects cannot be highlighted in experiments where the energy scale is extrapolated from
calibrations to much higher energies or estimated through Monte Carlo modeling.
Ra te , cp d/kg/k eV R esi du al s, cp d/ kg /keV R esi du al s, cp d/ kg /keV
Fig. 2 shows the time behaviour of the experi-mental residual rates of the single-hit scintillation events in the (1 - 3), and (1 - 6) keV energy intervals for the DAMA/LIBRA-phase2 period. The residual rates are calculated from the measured rate of the
single-hit events after subtracting the constant part, as
described in Refs. [2 - 5, 32, 33]. The null modulation hypothesis is rejected at very high C.L. by 2 test: 2
/d.o.f. = 127.3/52 and 150.3/52, respectively. The P-values are P = 3.0 108 and P = 1.7 1011, respectively. The residuals of the DAMA/NaI data
(0.29 t yr) are given in Refs. [2, 5, 32, 33], while those of DAMA/LIBRA-phase1 (1.04 t yr) in Refs. [2 - 5].
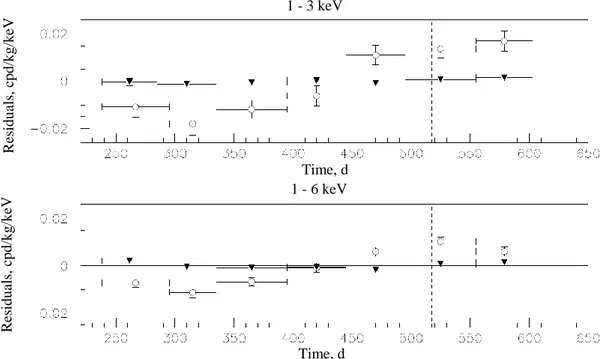
The former DAMA/LIBRA-phase1 and the new DAMA/LIBRA-phase2 residual rates of the
single-hit scintillation events are reported in Fig. 3. The
energy interval is from 2 keV, the software energy threshold of DAMA/LIBRA-phase1, up to 6 keV. The null modulation hypothesis is rejected at very high C.L. by 2 test: 2/d.o.f. = 199.3/102, corres-ponding to P-value = 2.9 108.
2 - 6 keV
Time, d
Fig. 3. Experimental residual rate of the single-hit scintillation events measured by DAMA/LIBRA-phase1 and DAMA/LIBRA-phase2 in the (2 - 6) keV energy intervals as a function of the time. The superimposed curve is the cosinusoidal functional forms A cos (t t0) with a period T = 2/ = 1 yr, a phase t0 = 152.5 d (June 2nd) and
modulation amplitude, A, equal to the central value obtained by best fit on the data points of DAMA/LIBRA-phase1 and DAMA/LIBRA-phase2. For details see Fig. 2.
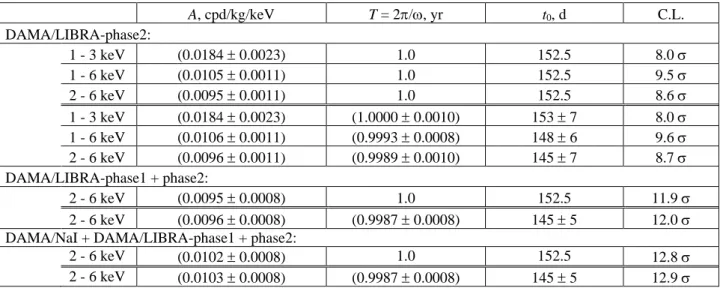
Table 2 A, cpd/kg/keV T = 2/, yr t0, d C.L. DAMA/LIBRA-phase2: 1 - 3 keV (0.0184 0.0023) 1.0 152.5 8.0 1 - 6 keV (0.0105 0.0011) 1.0 152.5 9.5 2 - 6 keV (0.0095 0.0011) 1.0 152.5 8.6 1 - 3 keV (0.0184 0.0023) (1.0000 0.0010) 153 7 8.0 1 - 6 keV (0.0106 0.0011) (0.9993 0.0008) 148 6 9.6 2 - 6 keV (0.0096 0.0011) (0.9989 0.0010) 145 7 8.7 DAMA/LIBRA-phase1 + phase2: 2 - 6 keV (0.0095 0.0008) 1.0 152.5 11.9 2 - 6 keV (0.0096 0.0008) (0.9987 0.0008) 145 5 12.0 DAMA/NaI + DAMA/LIBRA-phase1 + phase2:
2 - 6 keV (0.0102 0.0008) 1.0 152.5 12.8
2 - 6 keV (0.0103 0.0008) (0.9987 0.0008) 145 5 12.9 N o t e. Modulation amplitudes, A, obtained by fitting the single-hit residual rate of DAMA/LIBRA-phase2, as reported in Fig. 2, and also including the residual rates of the former DAMA/NaI and DAMA/LIBRA-phase1. It was obtained by fitting the data with the formula: A cos (t t0). The period T = 2/ and the phase t0 are kept fixed at 1 yr
and at 152.5 d (June 2nd), respectively, as expected by the DM annual modulation signature, and alternatively kept free.
The results are well compatible with expectations for a signal in the DM annual modulation signature.
The single-hit residual rates of the
DAMA/LIBRA-phase2 (see Fig. 2) have been fitted with the function: A cos (t t0), considering a period T = 2/ = 1 yr and a phase t0 = 152.5 d (June 2nd) as expected by the DM annual modulation signature; this can be repeated for the only case of (2 - 6) keV energy interval also including the former
DAMA/NaI and DAMA/LIBRA-phase1 data. The goodness of the fits is well supported by the 2 test; for example, 2/d.o.f. = 61.3/51; 50.0/51; 113.8/138 are obtained for the (1 - 3) keV and (1 - 6) keV cases of DAMA/LIBRA-phase2, and for the (2 - 6) keV case of DAMA/NaI, DAMA/LIBRA-phase1 and DAMA/LIBRA-phase2, respectively. The results of
R esidua ls, cpd/ k g/ke V
R. BERNABEI, P. BELLI, A. BUSSOLOTTI ET AL.
the best fits are summarized in Table 2. Table 2 also shows the results of the fit obtained for DAMA/LIBRA-phase2 either including or not DAMA/NaI and DAMA/LIBRA-phase1, when the period and the phase are kept free in the fitting procedure. As reported in the table, the period and the phase are well compatible with expectations for a DM annual modulation signal. In particular, the phase is consistent with about June 2nd and is fully consistent with the value independently determined by Maximum Likelihood analysis (see later). For completeness, we recall that a slight energy dependence of the phase could be expected (see e.g. Refs. [35, 55, 56, 58 - 60]), providing intriguing information on the nature of Dark Matter candidate and related aspects.
4. Absence of modulation of the background Careful investigations on absence of any systematics or side reaction able to account for the measured modulation amplitude and to simulta-neously satisfy all the requirements of the signature have been quantitatively carried out also in the past (see e.g. Ref. [5], and references therein); none is available. In particular, the cases of muons, neutrons and neutrinos have also been carefully investigated, as reported in Refs. [7, 8].
As done in previous data releases, absence of any significant background modulation in the energy spectrum has also been verified in the present data taking for energy regions not of interest for DM. In fact, the background in the lowest energy region is essentially due to “Compton” electrons, X-rays and/or Auger electrons, muon induced events, etc., which are strictly correlated with the events in the higher energy region of the spectrum. Thus, if a modulation detected in the lowest energy region were due to a modulation of the background (rather than to a signal), an equal or larger modulation in the higher energy regions should be present.
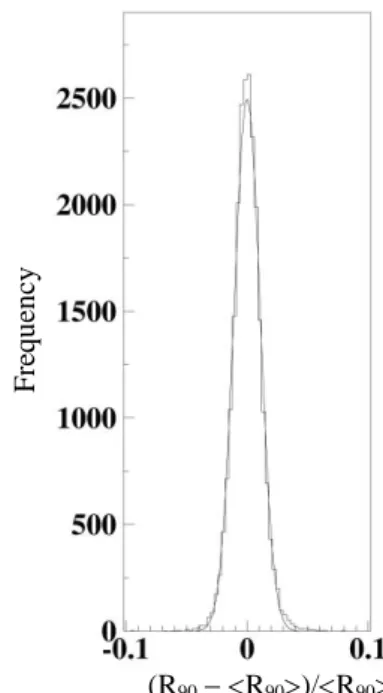
For example, the measured rate integrated above 90 keV, R90, as a function of the time has been analyzed. Fig. 4 shows the distribution of the percentage variations of R90 with respect to the mean values for all the detectors in DAMA/LIBRA-phase2. It shows a cumulative Gaussian behaviour with ≃ 1 %, well accounted for by the statistical spread expected from the used sampling time.
Moreover, fitting the time behaviour of R90 including a term with phase and period as for DM particles, a modulation amplitude AR90 compatible with zero has been found for all the annual cycles (Table 3). This also excludes the presence of any background modulation in the whole energy spectrum at a level much lower than the effect found in the lowest energy region for the single-hit scintillation events. In fact, otherwise considering the R90 mean values a modulation amplitude of order of tens cpd/kg would be present for each annual cycle, that is ≃ 100 far away from the measured values.
(R90 R90)/R90
Fig. 4. Distribution of the percentage variations of R90
with respect to the mean values for all the detectors in the DAMA/LIBRA-phase2 (histogram); the superimposed curve is a Gaussian fit.
Table 3 DAMA/LIBRA-phase2 annual cycle AR90, cpd/kg A(614), cpd/kg
2 (0.12 0.14) (0.0032 0.0017) 3 (0.08 0.14) (0.0016 0.0017) 4 (0.07 0.15) (0.0024 0.0015) 5 (0.05 0.14) 0.0004 0.0015) 6 (0.03 0.13) (0.0001 0.0015) 7 (0.09 0.14) (0.0015 0.0014)
N o t e. Modulation amplitudes, AR90, (second column) obtained by fitting the time behaviour of R90 for the six
annual cycles of DAMA/LIBRA-phase2, including a term with a cosine function having phase and period as expected for a DM signal. The obtained amplitudes are compatible with zero, and incompatible (≃ 100 ) with modulation amplitudes of tens cpd/kg. Modulation amplitudes, A(614), (third column) obtained by fitting the time behaviour of the
residual rates of the single-hit scintillation events in the (6 - 14) keV energy interval. In the fit the phase and the period are at the values expected for a DM signal. The obtained amplitudes are compatible with zero.
Fr
equ
enc
Similar results are obtained when comparing the
single-hit residuals in the (1 - 6) keV with those in
other energy intervals; for example Fig. 5 shows the
single-hit residuals in the (1 - 6) keV and in the (10 -
20) keV energy regions for DAMA/LIBRA-phase2 as if they were collected in a single annual cycle (i.e. binning in the variable time from the January 1st of each annual cycle).
Moreover, Table 3 shows the modulation amplitudes obtained by fitting the time behaviour of the residual rates of the single-hit scintillation events in the (6 - 14) keV energy interval for the DAMA/LIBRA-phase2 annual cycles. In the fit the phase and the period are at the values expected for a DM signal. The obtained amplitudes are compatible
with zero.
A further relevant investigation on DAMA/LIBRA-phase2 data has been performed by applying the same hardware and software procedures, used to acquire and to analyze the
single-hit residual rate, to the multiple-hit one. Since
the probability that a DM particle interacts in more than one detector is negligible, a DM signal can be present just in the single-hit residual rate. Thus, the comparison of the results of the single-hit events with those of the multiple-hit ones corresponds to compare the cases of DM particles beam-on and beam-off. This procedure also allows an additional test of the background behaviour in the same energy interval where the positive effect is observed.
Time, d Time, d
Fig. 5. Experimental single-hit residuals in the (1 - 6) keV and in the (10 - 20) keV energy regions for DAMA/LIBRA-phase2 as if they were collected in a single annual cycle (i.e. binning in the variable time from the January 1st of each
annual cycle). The data points present the experimental errors as vertical bars and the associated time bin width as horizontal bars. The initial time of the figures is taken at August 7th. A clear modulation satisfying all the peculiarities
of the DM annual modulation signature is present in the lowest energy interval with A = (0.0106 0.0011) cpd/kg/keV, while it is absent just above: A = (0.0010 0.0006) cpd/kg/keV.
We note that an event is considered multiple when there is a deposition of energy in coincidence in more than one detector of the set-up. The multiplicity can, in principle, range from 2 to 25. A multiple event in a given energy interval, say 1 - 6 keV is given by an energy deposition between 1 and 6 keV in one detector and other deposition(s) in other detector(s). The residual rate of events with multiplicity equal or greater than 2 with an energy deposition in the range 1 - 6 keV is shown in Fig. 6; the only procedure applied to multiple events is that used to reject noise events near software energy threshold and is the same used for single-hit events.
In particular, in Fig. 6 the residual rates of the
single-hit scintillation events collected during
DAMA/LIBRA-phase2 are reported, as collected in a single cycle, together with the residual rates of the
multiple-hit events, in the considered energy
intervals. While, as already observed, a clear modulation, satisfying all the peculiarities of the DM
annual modulation signature, is present in the
single-hit events, the fitted modulation amplitudes for the multiple-hit residual rate are well compatible with
zero: (0.0007 0.0006) cpd/kg/keV, and (0.0004 0.0004) cpd/kg/keV, in the energy regions (1 - 3) keV, and (1 - 6) keV, respectively. Thus, again evidence of annual modulation with proper features as required by the DM annual modulation signature is present in the single-hit residuals (events class to which the DM particle induced events belong), while it is absent in the multiple-hit residual rate (event class to which only background events belong). Similar results were also obtained for the two last annual cycles of DAMA/NaI [33] and for DAMA/LIBRA-phase1 [2 - 5]. Since the same iden-tical hardware and the same ideniden-tical software procedures have been used to analyze the two classes of events, the obtained result offers an additional strong support for the presence of a DM particle component in the galactic halo.
R esi du al s, cp d/ kg /keV R esi du al s, cp d/ kg /keV
R. BERNABEI, P. BELLI, A. BUSSOLOTTI ET AL.
Fig. 6. Experimental residual rates of DAMA/LIBRA-phase2 single-hit events (open circles), class of events to which DM events belong, and for multiple-hit events (filled triangles), class of events to which DM events do not belong. They have been obtained by considering for each class of events the data as collected in a single annual cycle and by using in both cases the same identical hardware and the same identical software procedures. The initial time of the figure is taken on August 7th. The experimental points present the errors as vertical bars and the associated time bin width as horizontal bars.
Analogous results were obtained for DAMA/NaI (two last annual cycles) and DAMA/LIBRA-phase1 [2 - 5, 33]. In conclusion, no background process able to
mimic the DM annual modulation signature (that is, able to simultaneously satisfy all the peculiarities of the signature and to account for the measured modulation amplitude) has been found or suggested by anyone throughout some decades thus far (see also discussions e.g. in Refs. [1 - 5, 7, 8, 19]).
5. The analysis in frequency
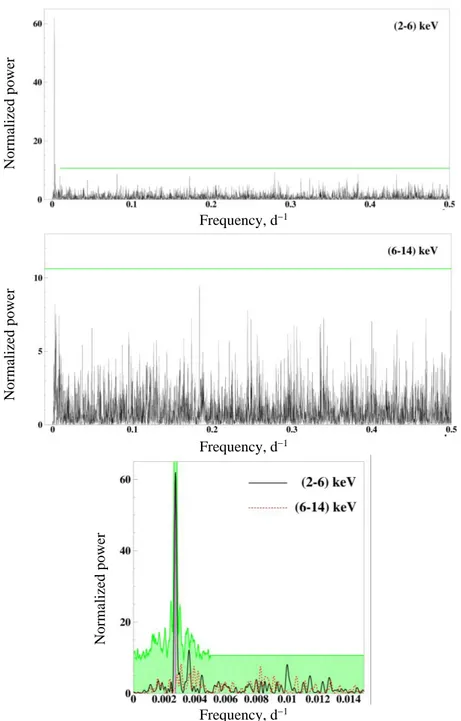
To perform the Fourier analysis of the DAMA/LIBRA-phase1 and phase2 data in a wider region of considered frequency, the single-hit events have been grouped in 1 d bins. Due to the low statistics in each time bin, a procedure detailed in Ref. [61] has been followed. The whole power spectra up to the Nyquist frequency and the zoomed ones are reported in Fig. 7. A clear peak corres-ponding to a period of 1 yr is evident for the lowest energy interval; the same analysis in the (6 - 14) keV energy region shows only aliasing peaks instead. Neither other structure at different frequencies has been observed.
As to the significance of the peaks present in the periodogram, we remind that the periodogram ordinate, z, at each frequency follows a simple exponential distribution ez in the case of the null hypothesis or white noise [62]. Therefore, if M independent frequencies are scanned, the probability to obtain values larger than z is:
P( z) = 1 (1 ez)M.
In general M depends on the number of sampled frequencies, the number of data points N, and their detailed spacing. It turns out that M is very nearly equal to N when the data points are approximately equally spaced, and when the sampled frequencies cover the frequency range from 0 to the Nyquist frequency [63, 64].
The number of data points used to obtain the spectra in Fig. 7 is N = 4341 (days measured over the 4748 d of the 13 DAMA/LIBRA-phase1 and phase2 annual cycles) and the full frequencies region up to Nyquist frequency has been scanned. Therefore, assuming M = N, the significance levels
P = 0.10, 0.05 and 0.01, correspond to peaks with
heights larger than z = 10.6, 11.3 and 13.0, respectively, in the spectra of Fig. 7.
In the case below 6 keV, a signal is present; thus, to properly evaluate the C.L. the signal must be included. This has been done by a dedicated Monte Carlo procedure where a large number of similar experiments has been simulated. The 90 % C.L. region (shaded, green on-line) where all the peaks are expected to fall for the (2 - 6) keV energy interval is reported in Fig 7. Several peaks, satellite of the 1 yr period frequency, are present.
In conclusion, apart from the peak corresponding to a 1 yr period, no other peak is statistically significant either in the low and high energy regions.
1 - 3 keV 1 - 6 keV Time, d Time, d R esi du al s, cp d/ kg /keV R esi du al s, cp d/ kg /keV
Frequency, d1
Frequency, d1
Frequency, d1
Fig. 7. Power spectra of the time sequence of the measured single-hit events for DAMA/LIBRA-phase1 and DAMA/LIBRA-phase2 grouped in 1 d bins. From top to bottom: spectra up to the Nyquist frequency for (2 - 6) keV and (6 - 14) keV energy intervals and their zoom around the 1 yr1 peak, for (2 - 6) keV (solid line) and (6 - 14) keV (dotted line) energy intervals. The main mode present at the lowest energy interval corresponds to a frequency of 2.74 103 d1 (vertical line, purple on-line). It corresponds to a period of ≃ 1 yr. A similar peak is not present in the (6 - 14) keV energy interval. The shaded (green on-line) area in the bottom figure calculated by Monte Carlo procedure represents the 90 % C.L. region where all the peaks are expected to fall for the (2 - 6) keV energy interval. In the frequency range far from the signal for the (2 - 6) keV energy region and for the whole (6 - 14) keV spectrum, the upper limit of the shaded region (90 % C.L.) can be calculated to be 10.6 (continuous lines, green on-line).
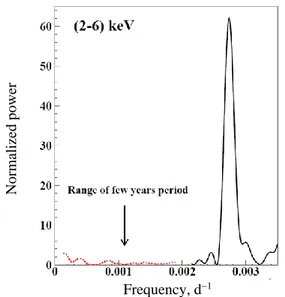
Moreover, for each annual cycle of DAMA/LIBRA-phase1 and phase2, the annual baseline counting rates have been calculated for the (2 - 6) keV energy interval. Their power spectrum in the frequency range 0.0002 0.0018 d1 (corres-ponding to a period range 13.7 - 1.5 yr) is reported in Fig. 8. The power spectrum (solid black line)
above 0.0022 d1 of Fig. 7 is reported for comparison. The calculation has been performed according to Ref. [5]. No statistically-significant peak is present at frequencies lower than 1 yr1. This implies that no evidence for a long term modulation in the counting rate is present.
Normali zed po wer Normali zed po wer Normali zed po wer
R. BERNABEI, P. BELLI, A. BUSSOLOTTI ET AL.
Frequency, d1 Frequency, d1
Fig. 8. Power spectrum of the annual baseline counting rates for the single-hit events of DAMA/LIBRA-phase1 and DAMA/LIBRA-phase2 in the (2 - 6) keV energy interval (dotted line, red on-line). Also shown for comparison is the power spectrum reported in Fig. 7 (solid line). The calculation has been performed according to Ref. [5]. As can be seen, a principal mode is present at a frequency of 2.74 103 d1, that corresponds to a period of ≃ 1 yr. No statistically-significant peak is present at lower frequencies. This implies that no evidence for a long term modulation is present in the single-hit scintillation event in the low energy range.
Fig. 9. Power spectrum of the time sequence of the measured single-hit events in the (1 - 6) keV energy interval for DAMA/LIBRA-phase2 grouped in 1 d bin. The main mode present at the lowest energy interval corresponds to a frequency of 2.79 103 d1 (vertical line, purple on-line). It corresponds to a period of ≃ 1 yr. The shaded (green on-line) area calculated by Monte Carlo procedure represents the 90 % C.L. region where all the peaks are expected to fall for the (1 - 6) keV energy interval.
Finally, the case of the (1 - 6) keV energy interval of the DAMA/LIBRA-phase2 data is reported in Fig. 9. As previously the only significant peak is the one corresponding to 1 yr period. No other peak is statistically significant being below the shaded (green on-line) area obtained by Monte Carlo procedure.
6. The modulation amplitudes by the maximum likelihood approach The annual modulation present at low energy can also be pointed out by depicting the energy dependence of the modulation amplitude, Sm(E), obtained by maximum likelihood method considering fixed period and phase: T = 1 yr and
t0 = 152.5 d. For such purpose the likelihood function of the single-hit experimental data in the k-th energy bin is defined as:
, ! ijk ijk N ijk k ij ijk L e N
where Nijk is the number of events collected in the i-th time interval (hereafter 1 d), by i-the j-i-th detector and in the k-th energy bin. Nijk follows a Poisson’s distribution with expectation value ijk = [bjk + + Si(Ek)]MjtiEjk. The bjk are the background contributions, Mj is the mass of the j-th detector, ti is the detector running time during the i-th time
interval, E is the chosen energy bin, jk is the overall efficiency. The signal can be written as:
Si(E) = S0(E) + Sm(E)cos (ti t0),
where S0(E) is the constant part of the signal and
Sm(E) is the modulation amplitude. The usual procedure is to minimize the function
yk = 2ln(Lk) const for each energy bin; the free parameters of the fit are the (bjk + S0) contributions and the Sm parameter.
In Fig. 10 the modulation amplitudes obtained considering the DAMA/LIBRA-phase2 data are reported as full triangles (blue points on-line) from the energy threshold of 1 keV up to 20 keV. Superimposed to the picture as open squared (red on-line) data points are the modulation amplitudes of the former DAMA/NaI and DAMA/LIBRA-phase1 [4]. The modulation amplitudes obtained in the two data sets are consistent in the (2 - 20) keV, since the 2 is 32.7 for 36 d.o.f. corresponding to P-value = 63 %. In the (2 - 6) keV energy region, where the signal is present, the 2 / d.o.f. is 10.7/8 (P-value = 22 %).
As shown in Fig. 10, positive signal is present below 6 keV also in the case of DAMA/LIBRA-phase2. Above 6 keV the Sm values are compatible with zero; actually, they have random fluctuations around zero, since the 2 in the (6 - 20) keV energy
Normali zed po wer Normali zed po wer
interval for the DAMA/LIBRA-phase2 data is equal to 29.8 for 28 d.o.f. (upper tail probability of 37 %). Similar considerations have been done for
DAMA/NaI and DAMA/LIBRA-phase1 where the 2 in the (6 - 20) keV energy interval is 35.8 for 28
d.o.f. (upper tail probability of 15 %) [4].
Energy, keV
Fig. 10. Modulation amplitudes, Sm, for DAMA/LIBRA-phase2 (exposure 1.13 t yr) from the energy threshold of 1 keV up to 20 keV (full triangles, blue data points on-line) and for DAMA/NaI and DAMA/LIBRA-phase1 (exposure 1.33 t yr) [4] (open squares, red data points on-line). The energy bin E is 0.5 keV. The modulation amplitudes obtained in the two data sets are consistent in the (2 - 20) keV: the 2 is 32.7 for 36 d.o.f., and the
corresponding P-value is 63 %. In the (2 - 6) keV energy region, where the signal is present, the 2 / d.o.f. is 10.7/8
(P-value = 22 %).
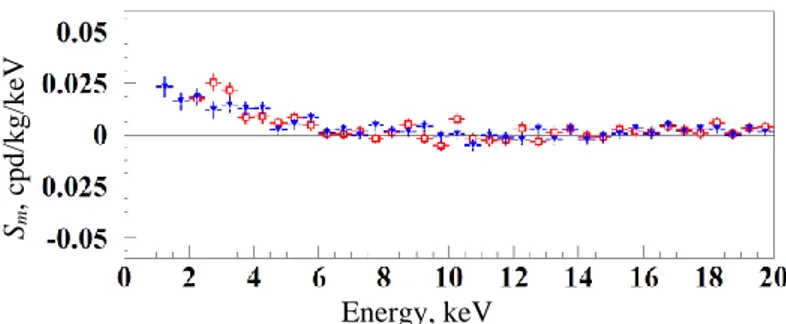
The modulation amplitudes for the whole data sets: DAMA/NaI, DAMA/LIBRA-phase1 and DAMA/LIBRA-phase2 (total exposure 2.46 t yr) are plotted in Fig. 11; the data below 2 keV refer only to the DAMA/LIBRA-phase2 exposure (1.13 t yr). It can be inferred that positive signal is present in the (1 - 6) keV energy interval, while Sm values compatible with zero are present just above.
All this confirms the previous analyses. In Table 4 the values of the modulation amplitudes of the (1 - 12) keV energy region are also reported. The test of the hypothesis that the Sm values in the (6 - 14) keV energy interval have random fluctuations around zero yields 2 equal to 19.0 for 16 d.o.f. (upper tail probability of 27 %).
Energy, keV
Fig. 11. Modulation amplitudes, Sm, for the whole data sets: DAMA/NaI, phase1 and DAMA/LIBRA-phase2 (total exposure 2.46 t yr) above 2 keV; below 2 keV only the DAMA/LIBRA-DAMA/LIBRA-phase2 exposure (1.13 t yr) is available and used. The energy bin E is 0.5 keV. A clear modulation is present in the lowest energy region, while Sm values compatible with zero are present just above. In fact, the Sm values in the (6 - 20) keV energy interval have random fluctuations around zero with 2 equal to 42.6 for 28 d.o.f. (upper tail probability of 4 %).
For the case of (6 - 20) keV energy interval 2
/ d.o.f. = 42.6/28 (upper tail probability of 4 %). The obtained 2 value is rather large due mainly to two data points, whose centroids are at 16.75 and 18.25 keV, far away from the (1 - 6) keV energy interval. The P-values obtained by excluding only the first and either the points are 11 and 25 %.
It is worth noting that in the DAMA experiments the exploited DM model-independent annual modulation signature does not require any identifi-cation of the constant part of the signal S0 from the
single-hit counting rate, in order to establish the
presence of a signal (Sm); in fact, the modulation amplitudes, Sm, are the experimental observables. No
background subtraction is applied since the exploited signature itself acts as an effective background rejection, as pointed out since the early papers by Freese et al.2
2 Anyhow, the S
m / S0 ratio is of interest in the corollary
model dependent analyses in the framework of specific astrophysical, nuclear and particle physics scenarios (not discussed in the present paper). Thus, exploiting a simple
and safe approach, the lower limit on the Sm / S0 ratio has
been given for DAMA/LIBRA-phase1 e.g. in Refs. [16, 65].
In DAMA/LIBRA-phase2 the upper limit on S0 is estimated
with the same procedure to be about 0.80 cpd/kg/keV, and 0.24 cpd/kg/keV, in the (1 - 2) keV and (2 - 3) keV energy
intervals, corresponding to the Sm / S0 ratio 2.4 %, and
6.3 %, respectively. Sm , cpd /kg/ke V Sm , cpd /k g/k eV
R. BERNABEI, P. BELLI, A. BUSSOLOTTI ET AL.
Table 4 Energy, keV Sm, cpd/kg/ keV Energy, keV Sm, cpd/kg/ keV
(1.0 - 1.5) (0.0232 0.0052) (6.5 - 7.0) (0.0016 0.0018) (1.5 - 2.0) (0.0164 0.0043) (7.0 - 7.5) (0.0007 0.0018) (2.0 - 2.5) (0.0178 0.0028) (7.5 - 8.0) (0.0016 0.0018) (2.5 - 3.0) (0.0190 0.0029) (8.0 - 8.5) (0.0014 0.0018) (3.0 - 3.5) (0.0178 0.0028) (8.5 - 9.0) (0.0029 0.0018) (3.5 - 4.0) (0.0109 0.0025) (9.0 - 9.5) (0.0014 0.0018) (4.0 - 4.5) (0.0110 0.0022) (9.5 - 10.0) (0.0029 0.0019) (4.5 - 5.0) (0.0040 0.0020) (10.0 - 10.5) (0.0035 0.0019) (5.0 - 5.5) (0.0065 0.0020) (10.5 - 11.0) (0.0038 0.0019) (5.5 - 6.0) (0.0066 0.0019) (11.0 - 11.5) (0.0013 0.0019) (6.0 - 6.5) (0.0009 0.0018) (11.5 - 12.0) (0.0019 0.0019) N o t e. Modulation amplitudes, Sm, for the whole data sets: DAMA/NaI, DAMA/LIBRA-phase1 and DAMA/LIBRA-phase2 (total exposure 2.46 t yr); data below 2 keV refer instead only to the DAMA/LIBRA-phase2 exposure (1.13 t yr).
6.1. The Sm distributions
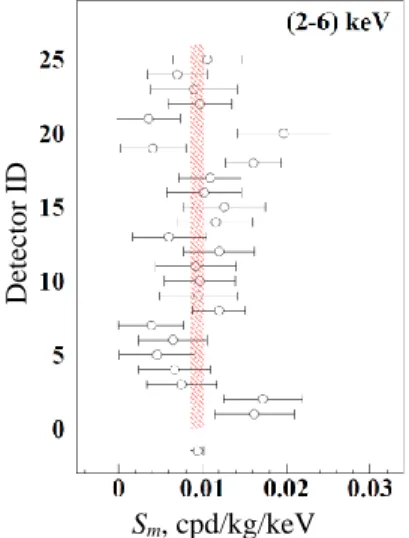
The method also allows the extraction of the Sm values for each detector. In particular, the modulation amplitudes Sm integrated in the range (2 - 6) keV for each of the 25 detectors for the DAMA/LIBRA-phase1 and DAMA/LIBRA-phase2 periods are reported in Fig. 12. They have random fluctuations around the weighted averaged value (shaded band) confirmed by the 2 / d.o.f. equal to 23.9/24. Thus, the hypothesis that the signal is well distributed over all the 25 detectors is accepted.
Sm, cpd/kg/keV
Fig. 12. Modulation amplitudes Sm integrated in the range (2 - 6) keV for each of the 25 detectors for the DAMA/LIBRA-phase1 and DAMA/LIBRA-phase2 periods. The errors are at 1 confidence level. The weighted averaged point and 1 band (shaded area) are also reported. The 2 is 23.9 over 24 d.o.f., supporting the
hypothesis that the signal is well distributed over all the 25 detectors.
As previously done for the other data releases [2 - 5], the Sm values for each detector for each annual cycle and for each energy bin have been obtained.
(Sm <Sm>)/
Fig. 13. Histograms of the variable (Sm Sm)/, where are the errors associated to the Sm values and Sm are the mean values of the modulation amplitudes averaged over the detectors and the annual cycles for each considered energy bin (here E = 0.25 keV). Each panel refers to a single DAMA/LIBRA detector. The entries of each histogram are 232 (the 16 energy bins in the (2 - 6) keV energy interval of the seven DAMA/LIBRA-phase1 annual cycles and the 20 energy bins in the (1 - 6) keV energy interval of the six DAMA/LIBRA-phase2 annual cycles), but 152 for the 16th detector (see Ref. [4]).
The superimposed curves are Gaussian fits.
The Sm are expected to follow a normal distribution in absence of any systematic effects. Therefore, the variable x = (Sm Sm) / has been considered to verify that the Sm are statistically well distributed in the 16 energy bins (E = 0.25 keV) in
Detect or ID Fr equ enc y
the (2 - 6) keV energy interval of the seven DAMA/LIBRA-phase1 annual cycles and in the 20 energy bins in the (1 - 6) keV energy interval of the six DAMA/LIBRA-phase2 annual cycles and in each detector. Here, are the errors associated to Sm and Sm are the mean values of the Sm averaged over the detectors and the annual cycles for each considered energy bin. The distributions and their Gaussian fits obtained for the detectors are shown in Fig. 13.
Defining 2 = x2, where the sum is extended over all the 232 (152 for the 16th detector [4]) x values, 2 / d.o.f. values ranging from 0.69 to 1.95 are obtained.
The mean value of the 25 2 / d.o.f. is 1.07. This value is slightly larger than 1. Although this can be still ascribed to statistical fluctuations, let us ascribe it to a possible systematics. In this case, one would derive an additional error to the modulation amplitude measured below 6 keV: 2.1 104 cpd/kg/keV, if combining quadratically the errors, or 3.0
105 cpd/kg/keV, if linearly combining them. This possible additional error: 2 % or 0.3 %, respectively, on the DAMA/LIBRA-phase1 and DAMA/LIBRA-phase2 modulation amplitudes is an upper limit of possible systematic effects coming from the detector to detector differences.
Among further additional tests, the analysis of the modulation amplitudes as a function of the energy separately for the nine inner detectors and the remaining external ones has been carried out for DAMA/LIBRA-phase2, as already done for the other data sets [2 - 5]. The obtained values are fully in agreement; in fact, the hypothesis that the two sets of modulation amplitudes as a function of the energy belong to same distribution has been verified by 2 test, obtaining e.g.: 2 / d.o.f. = 2.5/6 and 40.8/38 for the energy intervals (1 - 4) and (1 - 20) keV, respectively (E = 0.5 keV). This shows that the effect is also well shared between inner and outer detectors.
Annual Cycle
Fig. 14. Modulation amplitudes of each single annual cycle of DAMA/LIBRA-phase1 and DAMA/LIBRA-phase2. The error bars are the 1 errors. The dashed horizontal lines show the central values obtained by best fit over the whole data set. The 2 test and the run test accept the hypothesis at 95 % C.L. that the modulation amplitudes are normally
fluctuating around the best fit values.
In Fig. 14 the modulation amplitudes singularly calculated for each annual cycle of DAMA/LIBRA-phase1 and DAMA/LIBRA-phase2 are shown. To test the hypothesis that the amplitudes are
compatible and normally fluctuating around their mean values the 2 test has been performed. The 2
/ d.o.f. values are also shown in Fig. 14; they correspond to upper tail probability of 5.2, 97, 25, 67
A
,
cpd
/kg
R. BERNABEI, P. BELLI, A. BUSSOLOTTI ET AL.
and 72 %, respectively. In addition to the 2 test, another independent statistical test has been applied: the run test (see e.g. Ref. [66]); it verifies the hypothesis that the positive (above the mean value) and negative (under the mean value) data points are randomly distributed. The lower (upper) tail probabilities obtained by the run test are: 70(70), 50(73), 85(35), 88(30) and 88(30) %, respectively. This analysis confirms that the data collected in all the annual cycles with DAMA/LIBRA-phase1 and phase2 are statistically compatible and can be considered together.
7. Investigation of the annual modulation phase Let us, finally, release the assumption of the phase t0 = 152.5 d in the procedure to evaluate the modulation amplitudes. In this case the signal can be alternatively written as:
Si(E) = S0(E) + Sm(E) cos (ti t0) + Zm(E) sin (ti t0) = = S0(E) + Ym(E) cos (ti t*). (1)
For signals induced by DM particles one should expect: i) Zm ~ 0 (because of the orthogonality between the cosine and the sine functions); ii)
Sm ≃ Ym; iii) t* ≃ t0 = 152.5 d. In fact, these condi-tions hold for most of the dark halo models; how-ever, as mentioned above, slight differences can be expected in case of possible contributions from non-thermalized DM components (see e.g. Refs. [35, 55, 56, 58 - 60]).
Considering cumulatively the data of DAMA/NaI, DAMA/LIBRA-phase1 and DAMA/LIBRA-phase2 the obtained 2 contours in the plane (Sm, Zm) for the (2 - 6) keV and (6 - 14) keV energy intervals are shown in Fig. 15-left while in Fig. 15-right the obtained 2 contours in the plane (Ym, t*) are depicted. Moreover, Fig. 15 also shows only for DAMA/LIBRA-phase2 the 2 contours in the (1 - 6) keV energy interval.
The best fit values in the considered cases (1 errors) for Sm versus Zm and Ym versus t* are reported in Table 5.
Sm, cpd/kg/keV Ym, cpd/kg/keV
Fig. 15. 2 contours in the plane (Sm, Zm) (left) and in the plane (Ym, t*) (right) for: i) DAMA/NaI, DAMA/LIBRA-phase1 and DAMA/LIBRA-phase2 in the (2 - 6) keV and (6 - 14) keV energy intervals (light areas, green on-line); ii) only DAMA/LIBRA-phase2 in the (1 - 6) keV energy interval (dark areas, blue on-line). The contours have been obtained by the maximum likelihood method. A modulation amplitude is present in the lower energy intervals and the phase agrees with that expected for DM induced signals.
Table 5
E, keV Sm, cpd/kg/keV Zm, cpd/kg/keV Ym, cpd/kg/keV t*, d
DAMA/NaI + DAMA/LIBRA-phase1 + DAMA/LIBRA-phase2:
2 - 6 (0.0100 0.0008) (0.0003 0.0008) (0.0100 0.0008) (150.5 5.0) 6 - 14 (0.0003 0.0005) (0.0009 0.0006) (0.0010 0.0013) undefined DAMA/LIBRA-phase2:
1 - 6 (0.0105 0.0011) (0.0009 0.0010) (0.0105 0.0011) (157.5 5.0) N o t e. Best fit values (1 errors) for Sm versus Zm and Ym versus t*, considering: i) DAMA/NaI, DAMA/LIBRA-phase1 and DAMA/LIBRA-phase2 in the (2 - 6) keV and (6 - 14) keV energy intervals; ii) only DAMA/LIBRA-phase2 in the (1 - 6) keV energy interval. See also Fig. 15.
A , cpd /kg /keV t * , d
Finally, setting Sm in Eq. (1) to zero, the Zm values as function of the energy have also been determined by using the same procedure. The Zm values as a function of the energy are reported for DAMA/NaI, DAMA/LIBRA-phase1, and DAMA/LIBRA-phase2
data sets in Fig. 16; they are expected to be zero. The 2
test applied to the data supports the hypothesis that the Zm values are simply fluctuating around zero; in fact, in the (1 - 20) keV energy region the 2 / d.o.f. is equal to 44.5/38 corresponding to a P-value = 22 %.
Energy, keV
Fig. 16. Energy distribution of the Zm variable for the cumulative exposure of DAMA/NaI, DAMA/LIBRA-phase1, and DAMA/LIBRA-phase2 once setting Sm in Eq. (1) to zero. The energy bin E is 0.5 keV. The 2 test applied to the data supports the hypothesis that the Zm values are simply fluctuating around zero, as expected.
The energy behaviors of the Ym and of the phase
t* are shown in Fig. 17 for the cumulative exposure of DAMA/NaI, DAMA/LIBRA-phase1, and DAMA/LIBRA-phase2. The Ym are superimposed with the Sm values with 1 keV energy bin (unlike Fig. 11 where the energy bin is 0.5 keV). As in the
previous analyses, an annual modulation effect is present in the lower energy intervals and the phase agrees with that expected for DM induced signals. No modulation is present above 6 keV and the phase is undetermined.
Energy, keV
Fig. 17. Top: Energy distributions of the Ym variable (light data points; red color on-line) and of the Sm variable (solid data points; black on-line) for the cumulative exposure of DAMA/NaI, phase1, and DAMA/LIBRA-phase2. Here, unlike the data of Fig. 11, the energy bin is 1 keV. Bottom: Energy distribution of the phase t* for the
cumulative exposure of DAMA/NaI, DAMA/LIBRA-phase1, and DAMA/LIBRA-phase2; here the errors are at 2. The vertical scale spans over a quarter of period around 2nd June; other intervals are replica of it. An annual
modulation effect is present in the lower energy intervals up to 6 keV and the phase agrees with that expected for DM induced signals. No modulation is present above 6 keV and thus the phase is undetermined.
8. Conclusions
The data of the new DAMA/LIBRA-phase2 confirm a peculiar annual modulation of the single-hit scintillation events in the (1 - 6) keV energy region satisfying all the many requirements of the DM
annual modulation signature; the cumulative exposure by the former DAMA/NaI, DAMA/LIBRA-phase1 and DAMA/LIBRA-phase2 is 2.46 t yr.
As required by the exploited DM annual modulation signature: 1) the single-hit events show a clear cosine-like modulation as expected for the DM
Zm , cp d/kg/ ke V Ym , S m , cpd /kg /keV t *, d Energy, keV
R. BERNABEI, P. BELLI, A. BUSSOLOTTI ET AL.
signal; 2) the measured period is equal to (0.999 0.001) yr well compatible with the 1 yr period as expected for the DM signal; 3) the measured phase (145 5) d is compatible with the roughly ≃ 152.5 d expected for the DM signal; 4) the modulation is present only in the low energy (1 - 6) keV interval and not in other higher energy regions, consistently with expectation for the DM signal; 5) the modulation is present only in the
single-hit events, while it is absent in the multiple-hit
ones as expected for the DM signal; 6) the measured modulation amplitude in NaI(Tl) target of the
single-hit scintillation events in the (2 - 6) keV energy
interval, for which data are also available by DAMA/NaI and DAMA/LIBRA-phase1, is: (0.0103 0.0008) cpd/kg/keV (12.9 C.L.). No systematic or side processes able to mimic the signature, i.e. able to simultaneously satisfy all the many peculiarities of the signature and to account for the whole measured modulation amplitude, has been found or suggested by anyone throughout some decades thus far. In particular, arguments related to any possible role of some natural periodical phenomena have been discussed and quantitatively demonstrated to be unable to mimic the signature (see references; e.g. Refs. [7, 8]). Thus, on the basis of the exploited signature, the model independent DAMA results give evidence at 12.9 C.L. (over 20 independent annual cycles and in various experi-mental configurations) for the presence of DM particles in the galactic halo.
In order to perform corollary investigation on the nature of the DM particles in given scenarios, model-dependent analyses are necessary3; thus, many theoretical and experimental parameters and models are possible and many hypotheses must also
be exploited. In particular, the DAMA model independent evidence is compatible with a wide set of astrophysical, nuclear and particle physics scena-rios for high and low mass candidates inducing nuclear recoil and/or electromagnetic radiation, as also shown in various literature. Moreover, both the negative results and all the possible positive hints, achieved so-far in the field, can be compatible with the DAMA model independent DM annual modulation results in many scenarios considering also the existing experimental and theoretical uncertainties; the same holds for indirect appro-aches. For a discussion see e.g. Ref. [5] and references therein. Updated/new corollary analyses on various possible DM scenarios will be addressed in the next dedicated works. Finally, we stress that to efficiently disentangle among at least some of the many possible candidates and scenarios an increase of exposure in the new lowest energy bin is important. The experiment is collecting data and related R&D is under way.
This paper is dedicated to the memory of Prof. L. Paoluzi, Director of the INFN-Roma2 at time of starting the DAMA project, of Prof. D. Prosperi, one of the main proponents of this project, and of Prof. S. d'Angelo who worked in some DAMA activities, and always gave us fruitful scientific and personal support.
The authors also gratefully acknowledge the presidents of the Scientific Committee II of the I.N.F.N. and the referees of the DAMA project there, along various periods. They also wish to thank all the technical staffs who supported the works, and all the colleagues who contribute to the various searches on rare processes with the DAMA low-background set-ups.
REFERENCES 1. R. Bernabei et al. The DAMA/LIBRA apparatus.
Nucl. Instr. Meth. A 592 (2008) 297.
2. R. Bernabei et al., First results from DAMA/LIBRA and the combined results with DAMA/NaI. Eur. Phys. J. C 56 (2008) 333.
3. R. Bernabei et al. New results from DAMA/LIBRA. Eur. Phys. J. C 67 (2010) 39.
4. R. Bernabei et al. Final model independent result of DAMA/LIBRA-phase1. Eur. Phys. J. C 73 (2013) 2648.
5. R. Bernabei et al. Dark matter investigation by DAMA at Gran Sasso. Int. J. Mod. Phys. A 28 (2013) 1330022.
3 It is worth noting that it does not exist in direct and
indirect DM detection experiments approaches, which can offer such information independently on assumed models.
6. R. Bernabei et al. Performances of the new high quantum efficiency PMTs in DAMA/LIBRA. J. Instrum. 7 (2012) P03009.
7. R. Bernabei et al. No role for muons in the DAMA annual modulation results. Eur. Phys. J. C 72 (2012) 2064.
8. R. Bernabei et al. No role for neutrons, muons and solar neutrinos in the DAMA annual modulation results. Eur. Phys. J. C 74 (2014) 3196.
9. DAMA coll. issue dedicated to DAMA. Int. J. Mod. Phys. A 31 (2016) and Refs. therein.
10. R. Bernabei et al. Model independent result on possible diurnal effect in DAMA/LIBRA-phase1. Eur. Phys. J. C 74 (2014) 2827.
11. R. Bernabei et al. New search for processes violating the Pauli exclusion principle in sodium and in
iodine. Eur. Phys. J. C 62 (2009) 327.
12. R. Bernabei et al. Search for charge non-conserving processes in 127I by coincidence technique. Eur.
Phys. J. C 72 (2012) 1920.
13. R. Bernabei et al. New search for correlated e+e
pairs in the decay of 241Am. Eur. Phys. J. A 49
(2013) 64.
14. R. Bernabei et al. Investigating Earth shadowing effect with DAMA/LIBRA-phase1. Eur. Phys. J. C 75 (2015) 239.
15. P. Belli et al. Observations of annual modulation in direct detection of relic particles and light neutralinos. Phys. Rev. D 84 (2011) 055014.
16. A. Addazi et al. DAMA annual modulation effect and asymmetric mirror matter. Eur. Phys. J. C 75 (2015) 400.
17. R. Bernabei et al. On corollary model-dependent analyses and comparisons. Int. J. Mod. Phys. A 31 (2016) 1642009.
18. R. Cerulli et al. DAMA annual modulation and mirror dark matter. Eur. Phys. J. C 77 (2017) 83. 19. R. Bernabei et al. First model independent results
from DAMA/LIBRA-phase2. Universe 4 (2018) 116.
20. R. Bernabei et al. New model independent results from the first six full annual cycles of DAMA/LIBRA-phase2. Bled Workshops in Physics 19(2) (2018) 27.
21. P. Belli et al. DAMA proposal to INFN Scientific Committee II, April 24th 1990.
22. R. Bernabei et al. New limits on WIMP search with large-mass low-radioactivity NaI(Tl) set-up at Gran Sasso. Phys. Lett. B 389 (1996) 757.
23. R. Bernabei et al. Searching for WIMPs by the annual modulation signature. Phys. Lett. B 424 (1998) 195.
24. R. Bernabei et al. On a further search for a yearly modulation of the rate in particle Dark Matter direct search. Phys. Lett. B 450 (1999) 448.
25. P. Belli et al. Extending the DAMA annual-modulation region by inclusion of the uncertainties in astrophysical velocities. Phys. Rev. D 61 (2000) 023512.
26. R. Bernabei et al. Search for WIMP annual modulation signature: results from DAMA/NaI-3 and DAMA/NaI-4 and the global combined analysis. Phys. Lett. B 480 (2000) 23.
27. R. Bernabei et al. Investigating the DAMA annual modulation data in a mixed coupling framework. Phys. Lett. B 509 (2001) 197.
28. R. Bernabei et al. Investigating the DAMA annual modulation data in the framework of inelastic dark matter. Eur. Phys. J. C 23 (2002) 61.
29. P. Belli et al. Effect of the galactic halo modeling on
the DAMA-NaI annual modulation result: An extended analysis of the data for weakly interacting massive particles with a purely spin-independent coupling. Phys. Rev. D 66 (2002) 043503.
30. R. Bernabei et al. Performances of the ≃ 100 kg NaI(Tl) set-up of the DAMA experiment at Gran Sasso. Il Nuovo Cim. A 112 (1999) 545.
31. R. Bernabei et al. On the investigation of possible systematics in WIMP annual modulation search. Eur. Phys. J. C 18 (2000) 283.
32. R. Bernabei el al. Dark matter search. La Rivista del Nuovo Cimento 26(1) (2003) 1 and Refs. therein. 33. R. Bernabei et al. Dark matter particles in the
galactic halo: Results and implications from DAMA/NaI. Int. J. Mod. Phys. D 13 (2004) 2127 and Refs. therein.
34. R. Bernabei et al. Investigating pseudoscalar and scalar dark matter. Int. J. Mod. Phys. A 21 (2006) 1445.
35. R. Bernabei et al. Investigating halo substructures with annual modulation signature. Eur. Phys. J. C 47 (2006) 263.
36. R. Bernabei et al. On electromagnetic contributions in WIMP quests. Int. J. Mod. Phys. A 22 (2007) 3155.
37. R. Bernabei et al. Possible implications of the channeling effect in NaI(Tl) crystals. Eur. Phys. J. C 53 (2008) 205.
38. R. Bernabei et al. Investigating electron interacting dark matter. Phys. Rev. D 77 (2008) 023506.
39. R. Bernabei et al. Investigation on light dark matter. Mod. Phys. Lett. A 23 (2008) 2125.
40. R. Bernabei et al. Search for non-paulian transitions in 23Na and 127I. Phys. Lett. B 408 (1997) 439.
41. P. Belli et al. New experimental limit on the electron stability and non-paulian transitions in Iodine atoms. Phys. Lett. B 460 (1999) 236.
42. R. Bernabei et al. Extended limits on neutral strongly interacting massive particles and nuclearites from NaI(Tl) scintillators. Phys. Rev. Lett. 83 (1999) 4918.
43. P. Belli et al. New limits on the nuclear levels excitation of 127I and 23Na during charge
nonconservation. Phys. Rev. C 60 (1999) 065501. 44. R. Bernabei et al. Investigation on possible diurnal
effects induced by dark matter particles. Il Nuovo Cimento A 112 (1999) 1541.
45. R. Bernabei et al. Search for solar axions by Primakoff effect in NaI crystals. Phys. Lett. B 515 (2001) 6.
46. F. Cappella et al. A preliminary search for Q-balls by delayed coincidences in NaI(Tl). Eur. Phys. J.-direct C 14 (2002) 1.