On the Reduction of Complexity Problem on Driving
of Human Hand Prosthesis
Giovanni Saggio, Daniele Casali, Giovanni Costantini
Department of Electronic EngineeringUniversity of Rome "Tor Vergata" Rome, Italy ([email protected]) Abstract— In this paper, a statistical analysis had been carried
out on the measured joint angles of the human hand’s fingers while performing some common tasks. By exploiting the correlation existing on some couples of joints, we can reduce the number of myoelectric sensors necessary to drive a (virtual or real) hand prosthesis, while still maintaining an acceptable hand’s Degree of Freedom (DoF). In order to do such kind of analysis we measured the common hand tasks by means of our HITEG data glove we developed. The results of this analysis shows that the number of sensors can be halved, extrapolating the value of remaining sensors by means of linear regression, with an error which for most applications can result acceptable. This method will allow the subject, who has to drive an hand prosthesis, to perform all common hand actions and gestures with only few, not severe, limitations.
Hand prosthesis, complexity reduction, data glove. I. INTRODUCTION
Current technology allows us to deal with robotic hands that have a very high number of joints and actuators, which bring up to 20 Degrees of Freedom (DoF): almost the same as a real hand [1]. This high number of DoF grants potentially the reproduction of any natural movement of the hand. Unfortunately, this great potential cannot be fully exploited by current hand prosthesis. The main limitation regards the sensor system that allows to control the robotic hand: a set of myoelectric sensors is placed above the attachment of the prosthesis to the arm: every joint with an own degree of freedom of the hand needs a specific myoelectric sensor, but placing 20 different myoelectric sensors is not only practically difficult: it also increments the possibility of a rejection. This means that using such kind of robotic hands as hand prosthesis by associating one sensor to every DoF of the hand is practically impossible. Because only few myoelectric sensors can be used, actual prosthetic hands are much more limited, like the ones described in [2-4], having very few DOF.
The objective of this work is finding correlations on joint angles while performing most common and useful movements of the hand, in order to achieve a reduction of the complexity of the system. Once we have discovered that some joint position can reasonably be extrapolated by other joint position, we can reduce the DoF without affecting too much the actual movement possibilities.
In order to study this kind of correlation, we worked with the data glove developed by Health Involved Technical Engineering Group (HITEG), at the University "Tor Vergata"
[5-6]. With the aim of the HITEG-Glove, we were able to measure and record a set of movements that we supposed to represent some of the more useful practical tasks that an impaired person may aim to perform. Later we looked for correlations among different finger joints during the performance of each task. We took the couple of joints that showed the best correlation and calculated, by means of linear regression, the best approximation that allow to infer the position of some joints in function of another joints.
The paper is structured as follow: in Section II we will describe the data glove that we used, in Section III the set of movements performed will be described, in Section IV we will discuss the correlation. In Section V the reduction process and error caused by this reduction will be examined. Finally, the conclusion will be on Section VI.
II. THE DATA GLOVE
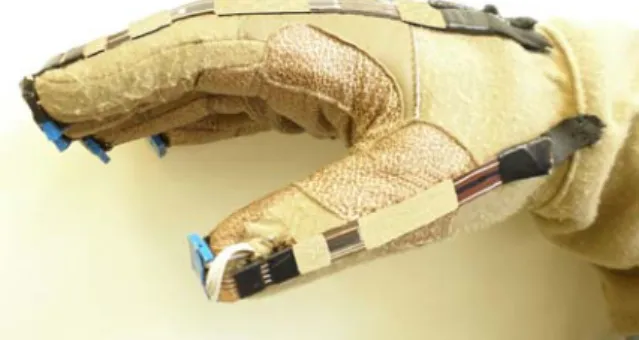
In order to study the correlation between of all possible combinations of joints in hand movements we need to measure these values by means of a data glove. The data glove developed by the HITEG at University of Rome “Tor Vergata” [5-6] and shown in Fig. 1 is perfect to this aim because it has all sensors that we need, to measure with a precision less than 4° the flex-extension finger joint movements.
Figure 1. HITEG Data Glove.
Actually, the version that we used has 18 sensors, identified by numbers from 1 to 18 and shown on Fig. 2: two sensors for the thumb (1-2), three sensors for every finger (3-14) and three sensors for the angle between the fingers (15-17, abdu-adduction movements). Actually we are only interested in sensors 1-14: angles between fingers are discarded for the purpose of this paper. For every finger we have three sensors to
measure the three following angles: Distal Interpahlangeal (DIP) angle, Proximal Interphalangeal angle, and Metacarpo Phalangeal angle, as shown in Fig. 2.
III. SET OF MOVEMENTS
The choice of the movements to be performed and analyzed is very important, because the correlations that will be found strongly depend on the movements that are acquired on this phase: spurious correlations could be found if we miss some important movement. All movements that are not in included in this set risk to be not possible when we apply our reduction. On the other hand, if we include useless movements that have no practical utilization we could unintentionally prevent some reduction possibility.
Figure 2. Name of the articulations and position identification number of the sensors.
Keeping in mind this concept and considering that all transition movements from a position to the next are recorded and included in the analyzed dataset, we selected the positions discussed in the following paragraphs. Note that we excluded positions implying third and fourth finger moving independently: these positions are notoriously uncomfortable, usually avoided also by healthy people, and have no practical utility. This exclusion will bring an obvious correlation between last two fingers: if we want to give the possibility to control separately these two fingers we just have to discard this correlation, which in our experiment is expressed by the couple 9-12: we will just need eight sensors in spite of seven.
A. Open hand
This is the basic position, shown on Fig. 3, we use it often when we want to press against something, and its transition to position B is what we ordinarily do, for example, when we take a handle or pick up any object of the same size of the hand, or greater.
Figure 3. Position A: open hand.
B. Fist
More or less closed, this position, shown on Fig. 4, is adopted any time we want to keep something in our hand, so it is one of the very basic hand positions.
Figure 4. Position B: fist.
C. Index finger up
This position is the main gesture of the hand: shown on Fig. 5, it is used every time we want to point somewhere, it is also used to press buttons.
Figure 5. Position C: index finger up.
D. Index and middle finger upwith thumb closed
This position is shown in Fig. 6. Transition from D to E, which means moving together index and middle finger with possible opposition of the thumb that moves independently, is what we do when we want to accurately manipulate something like a pen. Distal InterPhalangeal (DIP) Proximal InterPhalangeal (PIP) Metacarpo Phalangeal (MCP) 4 1 3 2 5 6 7 8 9 10 11 12 13 14 15 16 17 18
Figure 6. Position D: index and middle finger up, with thumb closed.
E. Index and middle finger upwith thumb open This position is shown on Fig. 7.
Figure 7. Position E: index and middle finger up, with thumb open.
F. Hand open, with thumb down
This position, shown in Fig. 8, represents the motion of thumb independently, while all fingers remain together: this is also useful when taking an object, together with A and B.
Figure 8. Position F: hand open, thumb down.
G. OK sign
This position, shown on Fig. 9, represents movements that we do when taking something very little, with thumb and index fingers, while other fingers are open.
Figure 9. Position G: OK sign.
IV. STUDY OF CORRELATION
In order to have the possibility of a statistical analysis, we performed 4 sessions, for every session the subject performed the whole sequence A-G repeated 2 times, sensor data was sampled at a rate of 100 Hz, so we had a dataset of 16691 x 14 sensors.
For every couple of the 14 angles, we measured the Pearson product-moment correlation coefficient, which is expressed by the following formula:
(X,Y)=cov(X,Y)/(XY)
where cov(X,Y) is the covariance of the two random variables that we are comparing and is the standard deviation.
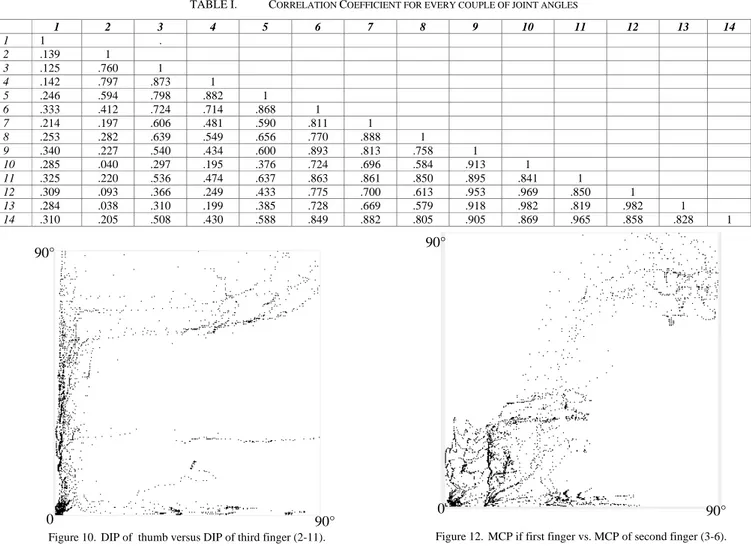
In table I we reported all the correlation coefficients. Numbers indicate the joints as shown in Fig 2.
The first observation that we can do is that all joints from last two fingers are very highly correlated: this clearly due to the fact that last two fingers always move together, in particular, MCP, PIP and DIP of third finger (9, 10, 11) are correlated respectively with MCP, PIP and DIP of fourth finger (12, 13, 14): correlation indices are 0.953, 0.982, 0.965.
Moreover, different articulations of the same finger are apparently correlated: MCP is correlated with PIP: this is valid for the third finger (0.913) and fourth finger (0.982), but correlation seems less strong in first finger (0.873) and second finger (0.811).
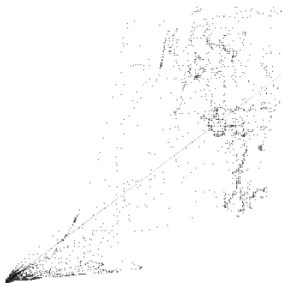
A visual representation of the correlation can be seen in Fig. 10-13, where the horizontal position of every point represents the value of the first angle considered (which, in the considered positions, is from 0° to 90° for all joints, even if for some joints it could potentially go up to 120°) and the vertical position represents the value of the second angle.
Fig. 10 represents a case of no correlation: angle 2 vs. 11 (DIP of the thumb vs. DIP of third finger). Fig. 11 represents a case of high correlation (MCP vs. PIP of fourth finger). Fig. 12 represents a case where there is a little correlation (0.724) but not enough to justify a reduction.
TABLE I. CORRELATION COEFFICIENT FOR EVERY COUPLE OF JOINT ANGLES 1 2 3 4 5 6 7 8 9 10 11 12 13 14 1 1 . 2 .139 1 3 .125 .760 1 4 .142 .797 .873 1 5 .246 .594 .798 .882 1 6 .333 .412 .724 .714 .868 1 7 .214 .197 .606 .481 .590 .811 1 8 .253 .282 .639 .549 .656 .770 .888 1 9 .340 .227 .540 .434 .600 .893 .813 .758 1 10 .285 .040 .297 .195 .376 .724 .696 .584 .913 1 11 .325 .220 .536 .474 .637 .863 .861 .850 .895 .841 1 12 .309 .093 .366 .249 .433 .775 .700 .613 .953 .969 .850 1 13 .284 .038 .310 .199 .385 .728 .669 .579 .918 .982 .819 .982 1 14 .310 .205 .508 .430 .588 .849 .882 .805 .905 .869 .965 .858 .828 1
Figure 10. DIP of thumb versus DIP of third finger (2-11).
Figure 11. MCP vs. PIP of fourth finger (12-13).
Figure 12. MCP if first finger vs. MCP of second finger (3-6).
However, another interesting observation that we can point out from an analysis of this table is a correlation that appears to bee almost constant on all fingers, hence it is arguably independent on the particular set of movements that we analyzed: PIP of every finger has always a correlation around 0.83 – 0.89 with DIP of the same finger (4-5, 7-8, 10-11, 13-14). This correlation is not very high, but is apparently present with some regularity in the same way in all fingers.
For the first and second fingers, the correlation is shown in Fig. 13-14.
V. REDUCTIONS
Basing on the study of the correlation on the previous section, we identified seven couple of variables that could be considered related, hence we could express one in function of the other.
A high correlation means that a graph like Fig. 11 is very near to be a line. Hence, it can be approximated by a line, and expressed by the following equation
yi = a xi + b + i 0 90° 90° 0 90° 90° 0 90° 90°
where xi and yi is any of the couples of variables that we
considered, i is the observation while a and b are coefficients that have to be chosen in order to have the best fit, finally is the error.
By means of the linear regression [7], we can minimize the quadratic error, and obtaining the values for a and b:
b = cov(X,Y)/X2 ; a = Y – b X
where cov(X,Y) is the covariance between X and Y, X2 is the
variance of X, X is the mean value of X and X is the mean value of Y.
Figure 13. PIP vs. DIP first finger (4-5) with regression line.
In table II we reported, for every couple of variables, coefficients a and b, as well as the mean quadratic error that we obtain by substituting the real value with the value extrapolated with this function. In Fig 13-14 an example of the regression line is shown superimposed to the graph for 4-5 and 7-8 joints respectively, using the a and b coefficients in table II.
TABLE II. LINEAR REGRESSION COEFFICIENTS AND MEAN ERROR
Figure 14. PIP vs. DIP second finger (7-8) with regression line.
VI. CONCLUSIONS
A statistical analysis has been performed in this paper in order to find correlations among 14 joint angles in the hand, and we found that the values of seven joints can be computed basing on the values of the remaining seven, with an error of about 9 to 17 degrees, which means an error of 10-19% if we consider a range of 90° for all the joints. This means that we can reduce the number of myoelectric sensors from to 14 to 7 without affecting too much the effective possibility of manipulation. Future work will include a more broaden study of PIP-DIP correlation, which appears to be almost constant on all fingers: Fig 13-14 shows that the relation between the two variables is non linear and maybe a function like y = a x + b x2 could give a lower error.
REFERENCES
[1] Shadow Robot Company, "Design of a Dextrous Hand for Advanced CLAWAR applications", CLAWAR Conference 2003 Catania. [2] M.C. Carrozza, F. Vecchi, F. Sebastiani, G. Cappiello, S. Roccella, M.
Zecca, R. Lazzarini and P. Dario, “Experimental analysis of an innovative prosthetic hand with proprioceptive sensors” Proceedings of the 2003 IEEE International Conference on Robotics & Automation Taipei, Taiwan, September 14-19, 2003, pages 2230-2235.
[3] S. Micera, M. C. Carrozza, B. Massa, R. Lazzarini, M. Zecca , P. Dario “The development of a novel prosthetic hand - Ongoing research and preliminary results”, IEEE/ASME Transactions on Mechatronics - 7 : 108 - 114 (2002).
[4] W. Craelius, R. L. Abboudi, N. A. Newby, “Control Of A Multi-Finger Prosthetic Hand” ICORR '99: International Conference on Rehabilitation Robotics, Page 1 – 255.
[5] G. Saggio, S. Bocchetti, C. A. Pinto, G. Orengo, F. Giannini, “A novel application method for wearable bend sensors”, ISABEL2009, 2nd International Symposium on Applied Sciences in Biomedical and Communication Technologies, Bratislava, Slovak Republic, November 24-27, 2009.
[6] G. Saggio, M. De Sanctis, E. Cianca, G. Latessa, F. De Santis, F. Giannini, “Long Term Measurement of Human Joint Movements for Health Care and Rehabilitation Purposes”, Wireless Vitae09 - Wireless Communications, Vehicular Technology, Information Theory and Aerospace & Electronic Systems Technology, Aalborg (Denmark), 17-20 May, 17-2009 – pp. 674-678.
[7] Ronald Fisher, “Statistical Methods for Research Workers “, 1925.
Joint
couple a b mean error [°]
4-5 -.024 .767 10.8 7-8 .0105 .7542 11.8 10-11 .0228 .659 13.8 13-14 .0157 .744 17.3 9-10 .10537 1.1331 13.3 12-13 .033903 1.0974 6.4 9-12 .047218 1.1119 9.3 0 90° 90°