1
POLITECNICO DI MILANO
School of Industrial and Information Engineering
Master of Science in Mechanical Engineering
A technology-oriented framework to characterize
energy efficiency measures in compressed air systems
Supervisor: Prof. Enrico Cagno Co-Supervisor: Ing. Andrea Trianni
Candidate: Marco Nicosia ID 842479
2
Sommario
L’efficienza energetica è riconosciuta come un elemento di fondamentale importanza nel panorama internazionale e politiche sempre più stringenti in termini di consumi e sostenibilità sono state varate dopo gli accordi di Kyoto. L’interesse generale, è volto alla diminuzione del consumo totale di energia tramite misure di efficientamento energetico ed in particolare al settore industriale, che assorbe più del 30% della produzione totale. Facendo riferimento alla situazione italiana si è deciso di investigare il mondo delle piccole medie imprese per due motivi fondamentali: il primo è che esse costituiscono l’ossatura portante del settore, con una percentuale del 98% nel contesto nazionale, la seconda ragione le vede portate più difficilmente ad investire in misure di efficienza energetica, frenate da mancanza di conoscenza e di pratiche sulla gestione dell’energia. Lo scopo del lavoro di ricerca è un’analisi che abbia una validità multi-settoriale e per questo motivo si è pensato ad un focus sulle tecnologie di servizio, cioè indipendenti dal processo di produzione. Nel dettaglio si analizzerà l’adozione degli interventi di efficienza energetica nei sistemi di aria compressa, mettendo in luce i fattori, legati alla tecnologia ed al funzionamento, che ne influenzano il tasso di implementazione.
In una prima fase si caratterizzano gli interventi di efficienza energetica. Lo studio si concentra poi sullo sviluppo di un framework orientato alla tecnologia, composto da tutti fattori da mettere in luce quando si adotta una misura di efficienza energetica nei sistemi di aria compressa, con le rispettive implicazioni che conseguono l’esecuzione dell’intervento nel contesto operativo. La validazione del modello consta di tre parti separate: (i) una è puramente teorica ed analizza ognuna delle implicazioni che una misura di efficienza comporta, (ii) segue la validazione sul campo del framework e degli elementi che lo compongono, in ultimo (iii) l’applicazione del modello proposta ad alcune aziende campione sulle misure di efficienza per valutarne lo sforzo e la facilità di utilizzo.
Abstract
Energy efficiency, is globally recognized as an element of utmost importance: as consequence, intensive policies in terms of consumption and sustainability have been launched after the Kyoto agreements. The general interest, is directed toward the total energy consumption reduction through energy efficiency measures, and in particular to the industrial sector, who takes up more than the 30% of the total production. Referring to the Italian situation, we decided to investigate the SMEs for two major reasons: firstly, they are composing the backbone of the sector, with a percentage of 98% of the total; secondly, they are less oriented in investing in energy efficiency measures, hindered by the lacking knowledge and practices on energy management. The objective of the research study is a multi-sectorial validity analysis, and for this reason we thought on a focus toward service technologies i.e. the ones independent to the production process. In detail, we are going to analyze the adoption of compressed air system energy efficiency interventions, to shed the light on technology and working process linked factors that have an influence on the implementation rate.
In a first step, the energy efficiency interventions are fully characterized. The study is then moved toward the development of a technology-oriented framework, composed by all factors to consider when a compressed air system energy efficiency measure is going to be adopted, with the corresponding implications of executing it in an operative context. The model validation is composed by three different parts: (i) the first, being purely theoretical, analyzes each of the implications coming from the efficiency measures adoption, followed by (ii) the on-field validation of the framework and of the elements composing it; lastly (iii) the model application is proposed to sample companies to evaluate the effort and user-friendliness in using the tool on single energy efficiency measures.
3
Table of contents
CHAPTER 1 Introduction: General outlook and reasons for investigation ... 12
1.1 Energy consumption ... 12
1.2 The importance of energy efficiency ... 15
1.3 The importance of the industrial sector ... 17
1.3.1 The industrial sector in Italy ... 17
1.3.2 Process and cross cutting technologies ... 21
1.3.3 The relevance of Compressed Air Systems ... 22
1.4 Efficiency and consumption of selected technology ... 23
1.5 Objective of the research study ... 24
CHAPTER 2 Compressed air system: technology overview ... 26
2.1 Generation of compressed air ... 27
2.1.1 Dynamic compressors ... 28
2.1.2 Positive displacement ... 29
2.2 Control and regulation modes ... 32
2.2.1 Start/stop ... 33
2.2.2 Online/offline ... 33
2.2.3 Modulating control... 33
2.2.4 Variable displacement ... 33
2.2.5 Variable Speed Drive ... 34
2.3 Air treatment units ... 34
2.3.1 Dryers ... 35
2.3.2 Filters ... 37
2.4 Heat reduction units ... 37
2.4.1 Pre-cooler and inter-cooler ... 37
2.4.2 After-cooler ... 38
2.4.3 Heat recovery on compressors ... 38
4 2.5.1 Primary receiver ... 39 2.5.2 Secondary receiver ... 40 2.5.3 Separators ... 40 2.6 Distribution network ... 40 2.6.1 Piping ... 41
2.6.2 Fittings & Hoses ... 41
2.7 Point-of-use equipment ... 42
2.7.1 Pneumatics ... 42
2.7.2 Motors ... 42
2.7.3 Uses of compressed air ... 43
CHAPTER 3 Analyzing the efficiency measures in compressed air systems: an overview ... 44
3.1 Efficiency measure definition ... 44
3.2 Efficiency measures in compressed air systems ... 45
3.3 Overview of the measures in compressed air systems ... 47
3.3.1 ARC database ... 47
3.3.2 Approaching the compressed air systems ... 47
3.3.3 Install compressor air intakes in coolest location ... 48
3.3.4 Install adequate dryers on air lines to eliminate blowdown (36) ... 52
3.3.5 Upgrade controls on compressors... 54
3.3.6 Install common header on compressors ... 60
3.3.7 Use or purchase optimum sized compressors ... 65
3.3.8 Use compressor air filters ... 71
3.3.9 Reduce the pressure of compressed air to the minimum required ... 73
3.3.10 Eliminate or reduce compressed air used for cooling, agitating liquids, moving product or drying; Eliminate permanently the use of compressed air ... 78
3.3.11 Abandoned equipment ... 82
3.3.12 Cool compressor air intake with heat exchanger ... 83
3.3.13 Eliminate leaks in inert gas and compressed air lines/valves ... 86
5
3.3.15 Heat recovery in compressor and other equipment ... 95
CHAPTER 4 Model for characterization of interventions in compressed air systems ... 101
4.1 Importance of the decision-making process ... 102
4.2 Working perspective ... 105
4.3 the literature reviews ... 105
4.3.1 Mere list of attributes ... 106
4.3.2 Categories of factors ... 107
4.3.3 Compressed air literature ... 108
4.3.4 Critics ... 109
4.3.5 Needs ... 111
4.3.6 Bottom-up Approach... 112
4.4 Framework introduction ... 114
4.4.1 Operational parameters ... 115
4.4.2 Economic and energetic parameters ... 115
4.5 Characterization of EEMs, contextual parameters ... 116
4.5.1 Complexity ... 117
4.5.2 Compatibility ... 120
4.5.3 Observability. ... 124
4.6 Identification in the time span ... 128
CHAPTER 5 Research methodology ... 129
5.1 Research objective ... 129
5.2 Rationale for the case study methodology ... 129
5.3 Research design ... 131
5.3.1 Unit of analysis ... 131
5.3.2 Boundaries: theoretical and empirical ... 132
5.4 Development of the case-study protocol for data collection ... 134
5.4.1 Data collection protocol: the interview ... 135
5.4.2 Validation of the framework ... 137
6
CHAPTER 6 Theoretical and empirical validation. Discussion of findings ... 140
6.1 Theoretical validation ... 140 6.1.1 Complexity factors ... 140 6.1.2 Compatibility factors ... 143 6.1.1 Observability factors ... 146 6.2 Empirical validation ... 148 6.2.1 Blue company ... 148 6.2.2 Green company ... 156 6.2.3 Orange company ... 161 6.2.4 Red company ... 166 6.2.5 Violet company ... 170
6.3 Discussion of findings: framework ... 175
6.3.1 Top-level analysis: framework structure and categories ... 176
6.3.2 Bottom-level analysis: evaluation of single macro-categories, axes and factors ... 177
6.4 Application of the framework: trial on single efficiency measures ... 181
6.4.1 Blue company ... 182 6.4.2 Brown company ... 188 6.4.3 Violet company ... 192 6.4.4 Orange company ... 195 6.4.5 Grey company ... 199 6.4.6 Green company ... 203
6.4.7 Light blue company ... 206
6.4.8 Red company ... 209
6.4.9 Indigo company ... 210
6.4.10 Yellow company ... 216
6.4.11 Pink Company... 219
6.5 Discussion of findings: application of the framework ... 224
6.5.1 Discussion on past efficiency measures ... 224
7
6.5.3 Discussion on potential efficiency measures ... 227
CHAPTER 7 ... 233
7.1 Final considerations ... 233
7.2 Limitations and suggestions for future research ... 237
8
List of tables
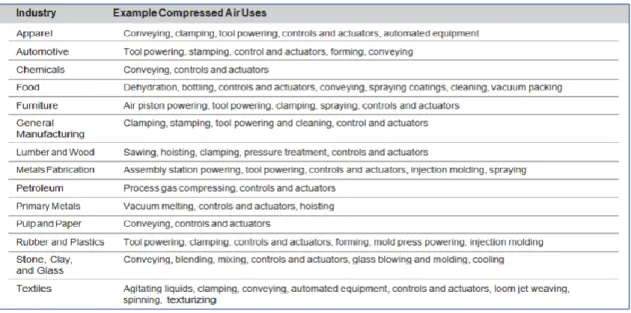
Table 1: sectorial uses of compressed air ... 43
Table 2: recap on pros and cons of the major controls of compressors ... 60
Table 3: Recap on pros and cons of the measure installation... 70
Table 4: Performances indicators for the framework validation ... 137
Table 5: Details of performances indicators for framework validation ... 138
Table 6: Details of performances indicators for framework application ... 138
Table 7: synoptic of the most recommended EEMs, that will be analyzed for the framework application ... 138
Table 8: recap on compressors, blue company ... 150
Table 9: recap on last efficiency measures adopted, blue company ... 150
Table 10: synoptic on framework validation, blue company ... 155
Table 11: recap on last efficiency measures adopted, green company ... 157
Table 12: recap on compressors, green company ... 157
Table 13: synoptic on framework validation, green company ... 160
Table 14:recap on compressors, orange company ... 162
Table 15: synoptic on framework validation, orange company ... 165
Table 16:recap on compressors, red company ... 167
Table 17:recap on last efficiency measures adopted, red company... 167
Table 18: synoptic on framework validation, red company ... 169
Table 19:recap on compressors, violet company ... 171
Table 20:recap on last efficiency measures adopted, violet company ... 171
9
Table 22: heterogeneity of the sample for the framework structure validation ... 176
Table 23: average ratings on the top-level items of the framework ... 177
Table 24: synoptic, framework validation ... 180
Table 25: recap on last efficiency measures adopted, light blue company ... 206
Table 26:recap on compressors, light blue company ... 207
Table 27: recap on compressors, indigo company ... 211
Table 28: recap on last efficiency measures adopted, indigo company ... 212
Table 29: recap on last efficiency measures adopted, yellow company ... 216
Table 30: recap on compressors, yellow company ... 217
Table 31: recap on last efficiency measures adopted, pink company ... 220
Table 32recap on compressors, pink company ... 221
Table 33: synoptic on the potential efficiency measures not adopted in the system ... 227
Table 34: synoptic of attributes belonging to firms subjected to the study on potential efficiency measures adoption ... 228
10
List of figures
Figure 1: World total final consumption from 1974 to 2014 by region ... 13
Figure 2: 1974 and 2014 regional shares of total final consumption ... 14
Figure 3: Simplified world energy balance table... 14
Figure 4: IEA shares of energy consumption by sectors ... 15
Figure 5: Shares of consumption of Italian SMEs. Evidence of sectors and energetic source ... 19
Figure 6: How energy efficiency measures are dependent on whether they apply to a support process ... 21
Figure 7: Reciprocating compressor components ... 29
Figure 8: Screw compressor components ... 30
Figure 9: Schematic of the refrigerant dryer ... 35
Figure 10: Heated desiccant dryer schematic ... 36
Figure 11: compressed air energy flows ... 38
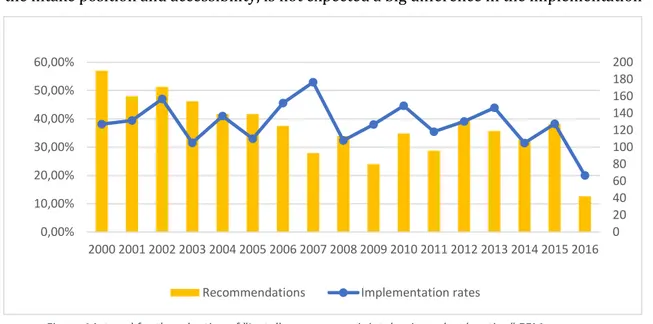
Figure 12: trend for the adoption of "Install compressor air intakes in coolest location" EEM ... 51
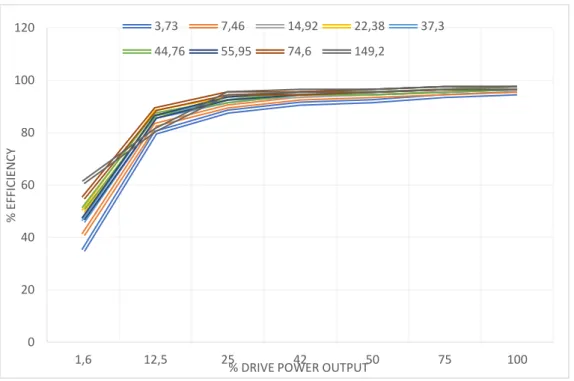
Figure 13: Part load efficiencies for different powers of compressors ... 56
Figure 14: demand load variations; base load, peak load and mean loads can be easily identified ... 68
Figure 15: Capacity of the most common compressed air end-uses ... 68
Figure 16: trend for the adoption of "Use/purchase optimum sized compressors" EEM ... 70
Figure 17: trend for the adoption of "Reduce the pressure of compressed air to the minimum required" EEM ... 76
Figure 18: trend for the adoption of "eliminate leaks in inert gas and compressed air lines/valves" EEM ... 91
Figure 19: Upgrade controls on compressors, blue company ... 184
11
Figure 21: Eliminate leaks in compressed air lines/valves, brown company... 191
Figure 22: Eliminate or reduce compressed air used for vacuum applications, violet company ... 194
Figure 23: Use/purchase optimum sized compressors, orange company ... 197
Figure 24: Eliminate or reduce compressed air used for vacuum applications, orange company ... 198
Figure 25: heat recovery from compression unit, grey company ... 202
Figure 26: Reduce the pressure to the minimum required, green company... 205
Figure 27:Eliminate leaks in compressed air lines/valves, light blue company ... 208
Figure 28: Install compressor air intakes in coolest location, red company ... 210
Figure 29: Eliminate or reduce compressed air used for dense phase transport, indigo company ... 213
Figure 30: Upgrade controls on compressors, indigo company ... 215
Figure 31: install compressor air intakes in coolest location, yellow company... 218
Figure 32: eliminate leaks in compressed air lines/valves, yellow company ... 219
12
CHAPTER 1
Introduction: General outlook and reasons for investigation
The Paris agreement in December 2015 dramatically change the way we cope with the consumption and production of energy. Anyway, in many national realities, such a step forward requires a political before than a technical effort. In the modern times, a more and more dynamic and growing picture of the world stands in front of our eyes; a point of paramount importance is the growing of the population and the growing of services to deliver to that population, that is happening thanks to the reduction of the poverty. This automatically lead to a more energy demand and consumption in a global scale that from an emission perspective can seem harmful for the world itself.
The trade-off that arises in this situation is trivial to see but tricky to solve: a much more “energetic” world, that at the same time look for a lowering of the emissions and pollutants producing the same energy. The solution, despite not universal, but in some sense the starting point, is the concept of efficiency applied to the energy world; energy efficiency can help to move toward the right direction in terms of a sound and wise economic development.
1.1 Energy consumption
Generally, when taking about countries, the concepts of energy efficiency and consumption are related: the energetic intensity of a country is often used as a proxy indicator of energy efficiency. This is an approximative measurement of the energy required to satisfy energy services demanded, and moreover, this indicator is easily available and can represent a comparative measure across countries (1). This does not imply a perfect correspondence between an efficient use of energy and a low consumption of the same, but all in all, is the best measure as a first estimate to compare international and national situations.
13 To clarify what is the situation about the final consumption of energy all around the world and the paramount importance of the industrial sector in the global sectors scenario, two key statistic follows. First of all, the global trend of consumption is going to increase by 49%
in the horizon 2011-2035.
Dealing with the consumption, the IEA statistics gives a primary classification of OECD countries and non-OECD ones. The former are members of the international organization of economic studies, that are developed countries with a common democratic government system and a market economy. In this sense, there is a network they are embedded in, for the ongoing development of policies (both local and international), commercial practices and resolution of common problems. For the statistics, tons of oil equivalent are used as unity of measure.
As the pictures below show, OECD countries were responsible for most consumption until 1974. In the 2015 the situation is deeply changed: despite a higher consumption of OECD countries, (2810 Mtoe vs 3619 in 2014) their share in a global perspective is lowered by a 21,9%, mainly due to the industrialization of the China and other Asian countries (mostly India, with the only negative trend of Japan).
14 Generally, classifying energy by sectors, provide four main groups:
• Transport; • Residential; • Services; • Industry;
In this sense, the second key statistic to note, is the consumption trends on the perspective of the sectors involved: a sectorial consumption gives a comprehensive review of how the energy is delivered and what is the consumption by fuels. On a global perspective, the industrial sector owns the 29.2% of the total consumption, with coal having the biggest share, being comprehensive of peat and oil shale; shares of natural gas and other types of fuel are very high for this sector as well (others comprise heat, solar, wind, trade electricity and geothermal sources).
Figure 2: 1974 and 2014 regional shares of total final consumption
15 More interesting in our perspective, are the shares
among the IEA counties1. IEA members should have
some prerequisite, aiming at the easy coordination of members’ energy policies to ensure stability of energetic sources procurement to sustain economic development. In the last years, efforts are being made
also for sustainability goals.
On this scenario the global industry shares are higher and reach the 30% of the total consumption, being outclassed only by the transport sector.
In parallel with the energy consumption, the world is going to became more and more efficient: the energy intensity (that, by definition, is the consumed energy for a GDP unit) trend is going to decrease by 1,8% on average each year in the next 20 years. The first reason behind this trend, is the increasing of many resources price level, running towards market logic aiming the adoption of innovative solutions for the efficiency. The prices in the last years have been influenced a lot by many regions in the world, giving much more importance to solutions in substitution or reduction of consumption (2).
1.2 The importance of energy efficiency
Efficiency is quantified as the output delivered by a process over the input needed to produce it; a lot of terms influence these values, that can be expressed in purely economic terms or in heat equivalent units with reference to energy measures. In this latter case, the problem of quality of energy arises, since not all forms of energy perform in the same way (3).
1 To be a IEA member country, is necessary being part of OECD nations. However, membership of OECD
does not automatically result in membership in IEA: Iceland, Slovenia, Israel, Chile and Mexico are OECD currently non being part of the IEA (the last two are candidates for the membership).
16 Energy efficiency, as defined by IEA (4), is the thrust for changing in policies and practices approaching the energy world. In the 450 scenario2, indeed, is necessary the change in the
decarburization and in the level of energy efficiency improvements implementation velocity.
Subsidies for the fossil fuels are a smaller fraction of the total energy research funds in the planned 2015-2030 horizon, giving the signal that the policy is shifting the objective in a future perspective, investing in research and development plans. The new allocation of investments has a cumulative amount of investments for procurement of energy reaching 44k billions of US dollars, which shares are 60% in extraction and production of oil, gas, carbon, and the 20% dispatched in renewables. An additional amount of 23k billion dollars is necessary for the enhancement of energy efficiency. Just thinking on the 2000-2015 period, where more of the 70% was accrued by fossil fuels, this represent a net reallocation of capital, moreover considering that for the renewables cost, is expected an ongoing decrease along years (4).
Step forwards for a faster spread diffusion of energetic goals was also planned in the Junker plan in EU28 (EFSI), that aims to overcome the present market barriers in energetic terms by addressing market gaps and mobilizing the commitment private investments. To cope with sustainability goals, low carbon competitive economy is set up for the economic development, since it leads to lower energy consumption, lower material consumption,
lower pollution and emissions as well.
Pushing frontiers of technology and knowledge put the contact between the energy consumption and efficiency with the industrial sector that will be the one of our interest, for the high potential of savings that, at the present, can widely be improved.
To clarify the concepts, in the next two paragraph the attention is moved on on the
importance of considering the industrial sector.
Moreover, dealing with energy efficiency concepts, they are supposed to be crucial to the strategic governance of any country or region; this implies a deep knowledge and
2 which assumes that strong policy measures are implemented to keep long-term greenhouse-gas-induced
17 application of policies tending to stimulate the technical progress and speed up the technological learning processes (5).
1.3 The importance of the industrial sector
Heterogeneity of industrial sectors is a key factor to analyze when thinking on the common solutions for the diffusion of Energy Efficiency Measures, especially in that enterprises that face problems of low adoption. The medium-small enterprises, face the lack of standard procedures and have the additional problem of misfits in internal competences to walkthrough a sound decision-making process. The light, nowadays, is not shed enough towards the energy efficiency measures; this happens for the difficulties in quantifying in real terms what energy efficiency is potentially able to provide. Many studies have been performed along the years for the energy efficiency potential adoption and actual use, giving attention on the gap between the two (3), and as consequence, in the last years, the attention has been given to the need for a new taxonomy in defining the market barriers of energy efficiency and main drivers to focus on for the spread diffusion of such measures.
Energy is the “air” for industries, whose lungs are the indoor processes of the enterprise itself, that through transformations can generate goods or services, but anyway a tangible output that ensure its survival or success on the market. Markets are extremely dynamic worlds, where the needs of end-users are drivers for a facility, and not the other way, both in technological and in energy efficiency use terms. This reversal of perspective from a facility to a consumer point of view was clarified more than 20 years ago from Eric Von Hippel, that gave a new framework for the development of innovations.
1.3.1 The industrial sector in Italy
Industrial sector in Italy is highly diversified and the presence of Small Medium Enterprises is spread all along the Peninsula, whose share exceeds the 99% of the total, employing more of two thirds of the workers in the non-financial business economy (6).
In the international energy efficiency picture, Italy represents a good example, having -14% of primary energy intensity with respect to the average in Europe in 2010; this led to the
18 recognition by the ACEEE3 as the third country in the national effort for the enhancement
of energy efficiency levels (7). These data are in conflict with actual problems faced by the country in in economic terms, because of the scarce competitiveness due to high energy prices and the high dependence on importations (7).
Let’s now take a look on the Italian energetic consumption and on the SMEs characteristics.
1.3.1.1 General outlook of Italy consumption
Italy objectives in terms of energetic goal are to exceed the EU 2020 environmental and decarbonization objectives and to have a leading role in implementing the EU roadmap 2050 (2).
Step forwards in the energy policies have been established since 2013, when the development of the National Energy Strategy was the result of a debate between the energy sector and the interested stakeholders. The NES set the goals in terms of reduction of energy costs, meeting of environmental targets for the emission reduction, increasing of renewable sources and energy efficiency.
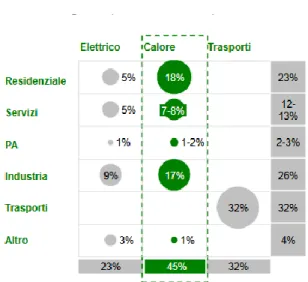
The actual consumption, in terms of total final consumption for energetic use is 116.6 Mtoe (7). The major share is given by the heat consumption (final use of energy for environmental heating and cooling) which represent the 45% of the total, followed by the transportation with the 32%. From the sectoral point of view the transport represents the highest part of the total being followed by the industrial sector, with a share exceeding the 25%. In the picture, the cross-diagram with sectoral and gross final use of energy in Italy.
The Small Medium Enterprises consumptions, which specific features are showed in 1.3.1.2 section, are showed in the following table.
19 From an energy efficiency point of view, the Italian situation is quite comfortable, being one of the first countries for energy intensity in Europe, with a level 14% lower than the average consumption. Consider also, that these results are obtained even though the manufacturing sector has a higher weight with respect to the Europe average.
The macroeconomic indicator of energy efficiency is the energy intensity, which has a very good value for the nation. Indeed, is one of the lowest among the IEA members with a value of 0.08 Toe/USD PPP4.
The attention to the energy efficiency topics has been increased in the last five years, also thanks to the energetic audit diffusion, compulsory for big enterprises and high energetic consumers. The 80% of enterprises prefer to undergo with internal intervention in 2016; the low percentage to external investment origin from mistrust of external experts and willingness to protect the internal know-how, when the efficiency measure is related to the core processes and may threaten critical processes (8).
1.3.1.2 Small medium enterprises
What is clear from general insights about industrial world, but sometimes is not taken into account at all, is that the majority of the enterprises are Small or Medium in size. They
4 The energy intensity is measured as the ratio between the Total Primary energy Supply by real GDP
adjusted taking into account the purchasing power value.
Figure 5: Shares of consumption of Italian SMEs. Evidence of sectors and energetic source
20 involve more of the 99% of the total of enterprises both in the global perspective but in the majority of the national frameworks as well, being Italy one of them. As consequence, this sheds the light on the energy use perspective, but also for economics terms and as drivers for innovation.
From the high amount of enterprises embedded in the national panorama, some diversifying characteristics of SME are advised, and a prior classification can be performed on the energy-use: ranging from non-energy intensive companies to the energy-intensive ones (usually manufacturing plants fall in this category), which threshold is defined as the energy costs not above the 3% of the added value. The SMEs are, by the definition provided from the EU Commission, enterprises employing less than 250 people and with an annual turnover that is not exceeding 50 million €. A classification based on the number of people involved ranges from 10-49 for the small enterprises, 50-249 for the medium.
In the analysis, the focus will be towards the SMEs, basically because industrial SMEs face extensive challenge in improving their energy efficiency, due to the lack of knowledge and deep structural practices of energy management, as well as a lack of resources. On our perspective, we can argue that the SMEs are an easier target for industrial energy program rather than wider industrial contexts, just because most of the energy consumed by SMEs and in non-energy intensive industries will be probably used in support processes.
The steps for an effective change in the way of facing energy problems in an industrial contest, especially in these smaller realities, is to implement energy audit programs (5). These programs are systematic, documented and periodic procedures to undergo for the improvement of organizational procedures, that can be performed by internal and external figures to the firm adopting them. Along with being the means for achieving the UNI ISO 50001:2011 certification, the results on adoption of sound engineering procedures with the audit permits the individuation of intervention for technological retrofits, and a preliminary technical-economic feasibility study. This means that the audit is of utmost importance for the SMEs in understanding and overcoming some of the barriers hindering the measures for their improvement in energetic terms.
What is lacking usually the SME is not the energetic audits information source, but the continuity of their communication process; simple methods as reminding of simple routines or energy use procedures can produce good results in the long-term run (5).
21 1.3.2 Process and cross cutting technologies
Since the industrial world is widespread and heterogeneous, a comprehensive view on energy efficiency in the Italian industrial sector seems impossible to outline. Remaining in the industrial sector, the only way to cope with this methodological issue, is to arouse the interest toward homogeneous sources of energy (that are common to the most of industries): the solution was found in the cross-cutting technologies, that are not directly linked to the production process (or at least not exclusively) but on the surrounding services.
As consequence, an analogy may be found on the consumption in non-residential sector, in which are encompassed the buildings providing services, commercial area and public administration.
One may think that this is worst solution, since this method is not comprehensive for the major part of the intensity used in energy; this is even worse talking about energy intensive industries5, where a high amount of energy is used to feed production processes. So, why to
undergo with such analysis, considering only some percentage of the energy produced by companies? The answer is that, being the core processes part of the production, is quite obvious that the energy efficiency efforts are already done, leaving very few potential enhancements of the current situation. In reality, the support processes may be implemented at an operational level, while the production process related are more dealing with a strategic activity, thus a different type of effort is required, as highlighted by the study of Thollander (5).
As evidenced by literature studies (6) (5) a thorough energy management procedure should encompass the usage of energy that is not linked to the core processes but that, in any case
5 Energy-intensive are defined as companies in which energy costs exceed the 2% of the turnover Figure 6: How energy efficiency measures are dependent on whether they apply to a support process
22 have an influence in terms of energy consumption and for which one may find the greatest potential for energy savings.
The most common support processes are revealed to be: • Electric motors;
• Compressed air system; • Lightning;
• HVAC Systems
The spread of such EEM depends on the type of industry and is revealed to be easier in the non-energy intensive ones.
1.3.3 The relevance of Compressed Air Systems
Among the four aforementioned systems, the electric motors are of course the major source of potential since the electric power is widespread in industry and a very high amount of electric power is used to fed motors. In any case, the literature has many studies that give a comprehensive view of the situation, being defined the efficiency classes under an international standard (IEC 60034-30:2008), for the substitution of all national systems (9) as well as studies on efficiency measures and policies to apply (10) and a development of a framework to understand the factors hindering measures of energy efficiency in that systems (11). On the other hand, the HVAC systems were approached both by simulation tools studies (12), (13) and theoretical manuals (14). Lightning systems does not need a comprehensive systemic view because, despite owing high potential for energy savings, the reasons for low implementation are not related to the low awareness towards the technology.
For this reason, the work aims to give attention to cross-cutting technologies that have high potential for savings and low adoption rate. Compressed air systems have electric driven power6, and have the highest potential for the implementation of efficiency measures,
because they are not implemented as expected. The low adoption rate is investigated in the
6 The driver of the air compressor is electric, as well as the pumps and refrigerant compressor used to the
heating and cooling cycle for a comfortable environment, or the centrifugal fan’s source. Refer to Chapter 2 25for further details.
23 study of Cagno and Trianni on the barriers hindering the adoption of energy efficiency measures. This exploratory study in cross-cutting technologies barriers (6), gives a strong connotation to some barriers for the compressed air. This system seems to have slightly less investment problems with respect to electric motors, but the issue of implementing the interventions without any external support is the most influential problem arose. The awareness and investment costs are revealed to be the second and third in importance.
1.4 Efficiency and consumption of selected technology
After the introduction of the selected system under the scope of this study, is important to clarify the importance of efficiency opportunities for the retrofit/substitution of equipment, as well as organizational and best energy practices. Energy efficiency measures are an ongoing effort in the industrial contest because of the dynamic nature of the technology, because of the lesson learnt from previous efficiency measures and last but not least for the price changing in time.
Compressed air machines can be characterized basically with the introduction of 3 indexes, that are:
• FAD (free air delivery) that gives information about the flow rate at reference conditions of 20° and 0,1 MPa for the pressure;
• Power of the compressor, that indicates the nameplate rating of the driving electric motor;
• Relative pressure (difference) with respect to a reference usually indicated as the atmospheric pressure; the pressure ratio from output to the input is used in some cases, though.
The second index of course is the one used for the consumption information, referring to the electric power taken from an electric source.
The estimates give a total compressed air consumption of approximately 80 TWh in EU (15), and the potential savings coming from an EU study were supposed to be more than 30%. The market of compressed air systems is almost stable in Europe with a growth from 1 to 2% per year and Italy have the third higher stock in Europe with a total amount of more or less 200 thousand machines (excluding piston compressors of little dimensions) with a total energy consumption of 16 TWh/year (16).
24 Compressed air is chosen for a series of reasons, but owns a high not exploited efficiency potential in the industrial context. The compressed air, known as the fourth utility, owns some characteristics that may, at least partially, explain the low adoption rate:
1. It is used mainly as a service; 2. It’s not a productive output;
3. It’s present in almost all the production industries (17);
Radgen and Blaustein (18) recognize the importance of the subject. The energy saving interventions are considered as more convenient with respect to others industrial investment, but compressed air related measures have low rates of adoption for organizational and cultural reasons; this are mainly three for the authors:
1. Lack of a specific cost item for compressed air, that makes invisible to the eyes of top management the share of compressed air consumption over the total amount;
2. Lack of awareness on the available savings because the top management is usually not aware of the possible saving in compressed air systems, despite the investment decisions are in charge of him;
3. The complex management structure, or the lack of enough fit for a decision to be taken on optimization measures, even though this problem can be reconducted to the first one, because of the responsibilities that are not clear for a low-priority item as compressed air.
Summarizing, the fact that the compressed air is usually a low interest utility, not being part of the production process, influence a lot the behavior towards its efficiency potential, further lowered by the lack of a specific cost item for compressed air services. The fact that some firms have no idea of the impact of the utility over the total energy expenditure, is a clear synthesis of how much attention is revealed to this item.
1.5 Objective of the research study
Since the importance of the energy use and consumption in industrial sector, the compressed air systems are a major source of potential efficiency, attractive for the high potential with relative low effort. The low adoption rate of efficiency measures spread all over the industrial sector for this utility is mainly attributable to the three characteristics mentioned in 1.4. The problem that arises at this point is related to the reason why the
25 interventions are not implemented, and how, through literature and empirical research, is possible to cope with this problem, creating an ad-hoc tool.
The solution is a thorough analysis of intervention with respect to contextual and industrial characteristics, to see how they work; this implies:
• Analysis of singular efficiency measures (Chapter 3);
• Giving a relationship with all the possible outcomes in an industrial system and implications on and of the surrounding environment, with the creation of a framework, useful to approach easily the adoption of compressed air related efficiency measures.
To obtain this final result, all this information is brought together in a synthesis tool, able to shed the light to all the factors to take into account when a decision for the enhancement of efficiency in the CAS is going to be implemented. This tool will be able to make the awareness rise on possible criticalities and primary elements that are consequences of the implementation, as well as to trade-off the informative gap with technology suppliers or external experts in charge of installation of efficiency measures.
System description in Chapter 2, explains how and why the components of a compressed air system are present, to understand how they are interrelated and connected to each other. The following chapter is about the analysis of the single efficiency measures and how they affect the system once implemented. The fourth chapter explain the reasons behind the building-up of the model and the framework characteristics, with a brief introduction on decision-making process, followed by the literature review to understand how the reasons behind the factors choice and the complete description of the framework. The last two chapters are oriented towards the explanation of the research methodology and the validation/application of the model. The theoretical validation of the model is performed thanks to the industrial literature, the empirical part of the research study is addressed thanks to the case-study methodology, with personal and phones interviews. The discussion of findings outlines all the emerging aspects and final results of the research, both with a theoretical and the on-field validation.
26
CHAPTER 2
Compressed air system: technology overview
Thinking on compressed air, it’s very difficult to find a product or task, for which has not been involved at some stage; some typical application in industries (manufacturing) are the supplying semi-finished raw materials, both for heavy products and light products, approaching the side of industries for end-user products, as well as in the packaging and processing of consumer goods (19).
Being the air freely available and due to its easy procurement, is usually treated as cost-free. Despite this belief, usually, most of energy costs in an industrial environment comes from the compressed air systems. This widespread misconception about inexpensiveness, most of times is translated to a poor focus on the efficiency practices and on the optimization of compressed air systems i.e. energy savings aspects are seldom considered in the design phase.
One typical situation concerning problems with the optimization, is showed up immediately in a decision for the purchase of a compressed air system7. In the design phase, one should look for
the best compressors to install depending on the actual capacity of a system, nor more, neither less. This seems quite obvious, but most of the time, one firm can install a higher capacity with respect to the one required by the actual demand needs, just as a proactive measure from the possible future expanding capacity of the firm itself. Unless the expansion in not already designed and truly planned, this lead to a present part-load utilization of the machines, that has the consequence of higher energy consumption. Energy consumption is indeed of utmost importance in this kind of system, classified as “energy intensive”, because of the high power required for the output provided. In these processes, the major cost of the system along its lifetime is the energy use (73% of the total cost during the mean lifetime) (20).
The widespread diffusion of the technology is brought by a series of factors: the ease of handling, the great safety, being sometimes preferred to hazardous environments for their low
flammability, and the relative ease maintenance procedures.
27 As indicated from data available in industry facilities (21), such systems should be used only if there are some additional benefits, such as safety enhancements, productivity gains or reduction of labor due to high energy delivery cost.
The costs from air compressors but also dryers and support equipment, can represent up to the 90% of the total electric bill (in process industries, the percentage are significantly smaller in companies in which compressed air is solely used as service).
2.1 Generation of compressed air
Compressors are the principal components of the system. They are operating machines; this means they receive a mechanical work from the crankshaft and they provide a positive work on the fluid inside a compression ambient (can be a chamber or a different path). This work is needed to pump up the pressure level from the inlet value to the outlet one.
Two different types of fluid compressors exist: dynamic and positive displacement.
The compression is dynamic when the air is introduced on an impeller of the compressor for its acceleration, and then is performed the energy transformation from kinetic to pressure through the diffusor component. These systems are known as axial or radial turboblowers, depending on the pattern of the fluid inside the chambers. Positive displacement compressors include different types of compressors, whose utilization is for different field of applications; they usually are used for service in industrial sectors. The air is initially drawn in one compression chamber (single chamber compressor), which is insulated from the inlet through the aid of a valve. The volume of the closed chamber is then decreased (the method for compression determines the type of compressor) and the air is compressed. The pressure must overcome a limit to permit the triggering of the outlet valve, ejecting the compressed fluid thanks to the reduction of the chamber’s volume.
The key characteristic of a general compressor is the pressure ratio, defined as the quantity that relates the absolute pressure on the inlet and outlet side. Commonly, the air aspiration
28 occurs at atmospheric pressure (1 bar), so the pressure ratio is basically the outlet pressure itself8.
2.1.1 Dynamic compressors
These compressors generally are in the radial or axial configuration. The latter, in reality, can be classified as a sort of mix of them: the air arrives axially and then the flow within the compressor is radial. Axial compressor has more stages in series; on the other hand, the radial and centrifugal can be mono-stage. These types of compressors are treated for the sake of completeness, but notice that no any application for services entail this configuration, used for process industries and in general high-power applications.
2.1.1.1 Axial
This compressor works thanks to the air passage along the compressor shaft through a sequence of rotating and static vanes. The internal rotor is longitudinally extended depending on the number of stages, with decreasing dimensions in the horizontal direction thanks to the higher air density in the internal stages. The axial stress is counterbalanced thanks to a cylindric part that equilibrate the stress distributing it.
With respect to their centrifugal counterpart, these compressors are generally more compact in dimensions and lightweight, and their rotational speed is much higher. The volumetric flow rates are large but constant, but the pressure ratio is maintained to a quite low level e.g. in ventilation plants. Since the rotational speed is that high, they are usually combined with gas turbines for the generation of electric energy or as propellers of aircrafts. Typical values for the flow rate go from some m3/sec up to 600 m3/sec. The number if stages
can be very high, reaching a total compression ratio of 16/18 (22).
2.1.1.2 Centrifugal
The air is accelerated by stages of impellors; more stages are required to work at the right operating pressures. Despite the low installation costs, they are expensive for the tight
tolerances required in the mechanics.
8 This is simply a rule of thumb; in reality, the intake pressure depends on the drops by the passage through
29 These compressors generally have a lower stage pressure ratio (no more than 3) for the maintenance of a quite high stage efficiency that otherwise will drop dramatically; for this reason, in high-pressure appliances there is the presence of more radial stages or, more commonly, multiple single-stage compressors set in series. In this compressor, is advisable a very high rotating speed of the shaft compared with the one of other types of compressors, up to more than 100.000 rpm.
This lead to very high axial dynamic forces, that are balanced mounting two different impellors at the sides of the shaft, whose rotation is allowed with plain oil bearings (or air film is they are oil-free).
Application example: single stage application for the centrifugal is the one in the wastewater treatment plants. Multi-stage applications of the same compressor allow the possibility of inter-cooling to reduce the power requirements from the crankshaft. Single stage compressors in series are present in the oil and gas process industry.
2.1.2 Positive displacement
Different types of positive displacement air systems exist, and their characteristics influence the energy consumption, the efficiency of the compressed air and the potential
global efficiency of interconnected systems.
Analyzing the types of compressors, we will focus on the piston compressors (reciprocating ones), one single rotor and one double rotor, and one type of dynamic compressor.
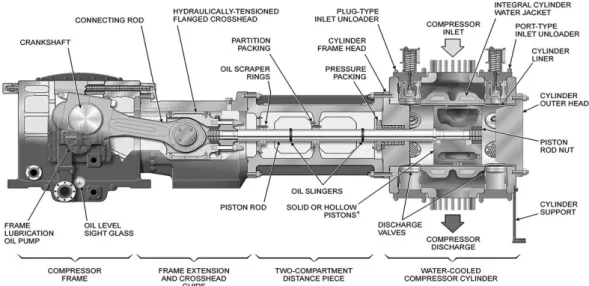
2.1.2.1 Reciprocating (piston compressor)
30 This compressor is the most common as well as oldest compressor commercially available. Generally, the configuration can be single-acting or double-acting depending on the active strokes of the piston. The V configuration is the most common although not the unique configuration for small compressors. The large double-acting compressors have an L-configuration design. Oil-lubrication might be present, and the valves on the compressor are usually self-acting i.e. they activate automatically when the valve ends feel different pressures.
By means of an electric motor, there is the movement of a crankshaft, leading the piston stroke of the reciprocating compressor. They are used for general purposes and they’re commercially available in a range if powers from 0,7 to more than 22 kW (1-30 HP). They are not so used in industrial sectors with the exception of automation systems and large reciprocating compressors in specialized processes such as high-pressure application. The major use of this type of compressor is for the supplying of air to the building control.
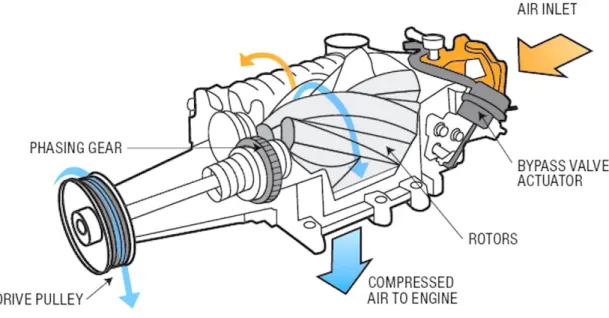
2.1.2.2 Screw
They are the main alternative of reciprocating compressors, having gained from the 80’s a gradually increasing popularity. Nowadays are the leader compressors in the industrial market.
The first screw compressor was designed in 30’s, when there was the requirement of high flow rate and stable outlet flow under different pressure conditions. Their main use is the industrial sector (general purposes), since their compactness and the steady-state running, that in general involves little vibrations, avoiding the use of one or more spring suspensions.
31 Basically, there are two parallel counter-rotating rotors, a male and a female one, that are independent from the point of view of the build-in pressure ratio (depends on the shape, length and discharge gate). Of course, from an efficiency perspective the required working pressure should be maintained in the discharge of the compressor. No any valve is present, and the only support force is needed by the bearings in axial direction.
Depending on the characteristic rotational speed, the higher frequencies vibrations are absorbed by rubber mounts. The size of the system ranges from 280 l/min up to several dozens of thousands l/min. The flow rates involved are the compromise between the
reciprocating compressors and the centrifugal ones.
The most common type is the helical twin, screw compressor, where the two parallel rotors turn the helical screws, trapping the air in a decreasing size channel, enhancing the fluid pressure. Depending on the requirements of the final use in terms of air clearance, this type of compressor is available as lubricated or oil free type.
Lubricant injected rotary screw: This type of rotary screw compressor is the most used in industrial applications because of the compactness and versatility.
The main purposes of the fluid injection are basically two: the sealing of the compression chamber to the rotating parts and the provision of a sink for the cooling of the flowing fluid. The lubricating fluid is separated from the discharge stream, then cooled, filtered and recycled along a fixed guide. Most of the separation of lubricant and air are directional and speed changes, the remaining part are dropped out thanks to the coalescer or filter vessel that permits the separation from the gas (oil absorbs non-polar particulates of the gas). Despite not perfect, the mechanism permits the reduction of lubricant presence in the compressed air to few ppm9. Despite the lion’s share is composed by oil-lubricated
compressors, there is also the presence of water or polymers. Since the sealing and cooling are increased, this permits high compression ratio from this type of compressors: a single stage can withstand to 14/17 bars in most extreme situations (at the expenses of the efficiency), but 8 or 10 bars are not infrequent.
Dry Type Rotary Screw: in this case the oil is not present at all within the mechanism. The main drawback here, is the possibility of handling lower maximum discharge pressures. On
32 the other hand, there is the possibility of putting a series of compressors, giving as result the so called “multi-stage oil-free compressors”, where the pressure reaches 10,13 bars (10 atm) and a maximum output flow rate that can reach 57 m3/min. The main usage of this
type of systems are atmosphere where is not permitted at all the air contamination (manufacturing of semiconductors or medical field). In any case some filters are present as well, due to the presence of contaminants in the environmental air itself.
2.1.2.3 Vane
This compressor is composed by a stator and a rotor, where the latter has an eccentric housing. The vanes are mobile and thrust the air all around the space within the mobile and fixed parts, forcing it to be compressed. When the distance between the rotor and stator is increased, air is drawn into the volume and then captured different compression chambers created from alternating moving vanes. The rotation makes air to be compressed until the
way out is reached.
This type of compressor has not a very high air quality10 but anyway better than the screw
compressor. The major problem associated here is the limited range of capacity, so the compressor is not indicated for fluctuating air demand.
2.2 Control and regulation modes
Air requirements are quite variable during the time and for this reason there is the necessity to operate not always at full load, in order to vary compressed air production depending on needs. The efficiency of the system is determined on the quantity of air saved when not needed and on the promptness of changing of load over time i.e. an efficient control flow at part-load is required.
Based on the system took in place and on the control selection we can deeply affect the overall system performances, and the energy efficiency as direct consequence. The strategies for the control of flow are plenty, depending on the compressor type, acceptable pressure variations, air consumption variation and acceptable energy losses. The most common types of control follow.
33 2.2.1 Start/stop
This is the simplest way of control for compressors. This method cannot be applied on vane compressors. Basically, the electric motor driving the compressor is turned on or off in response to the downstream pressure (discharge pressure) of the machine. For large compressors, problems in managing the pressure fluctuations may arise. Moreover, if the starts and stops are too frequent and repeated, the motor tends to overheat; this lead to issues as well, but above all the stricter maintenance need on components. For this reason, the method requires a large receiver or large pressure difference between threshold limits, for the minimization of the heat load on the electric motor. Due to transient problem for the running up period, the compressors involved usually range between 5-10 kW.
2.2.2 Online/offline
Often known also load/unload, keeps the motor running, but unloads the compressor only when the discharge pressure is high enough; this result in a discontinuous pattern in the pressure within the compressor. They consume in the range between 15 and 35 % of their full power load, while producing no useful compressed air output. The storage of the associated receivers should have a capacity high enough to permit an efficient part-load operation.
Pressure variations depend on the number of load/unload allowed, but in most of cases they address a range between 0,3 and 1 bar.
2.2.3 Modulating control
Modulating control is a variation of the output to meet the flow rate requirements by adjusting the position of the inlet valve, resulting in air restrictions to the compressor. The drawback with this type of control is that the full modulation leads to high consumption even for zero flow conditions. To reduce the amount of energy, the control can be activated
or not.
This control is allowable uniquely for oil-lubricated screw compressors, and is the least efficient way to control compressors, for this reason is today out of use.
2.2.4 Variable displacement
Variates the output capacity thanks to valves, acting with their displacement in the variation of control volume. These valves are called spiral valves and are acted on the rotary, oil-lubricated, screw compressor. In this case is not necessary a variation of load or the
34 starting/stopping of the compressor and the efficiency is high over the 60% load. Below this value a proper unloading control can reduce significantly the power consumption.
2.2.5 Variable Speed Drive
This control method responds to changes in air demand with the speed variation of the electric motor (read compressor shaft), changing, as consequence, the flow rate.
A normal AC electric motor works with a fixed speed, obtained from the frequency of supplied energy. The VSD technology addresses the conversion from fixed voltage, fixed frequency AC in variable voltage, variable frequency AC. The converter, filter and inverter boxes operate this transformation, with very little energy losses; the efficiency is in the 92-95%.
The integration of the VSD with an existing motor has revealed to be a very important recent evolution of the technology, with more affordable installation costs and elimination of problems connected to electromagnetic interferences.
Is usually implemented in packaged rotary screw machines, allowing the perfect matching of variation by demand side. When the air load drops out to a minimum value that will require a too low speed, other types of control such as load/unload or start/stop activate. This control mode is usually the most efficient way of reacting to a change in demand, despite the high purchasing price (of the overall equipment). A strategy to cope with a highly varying demand is to use multiple compressors, where one or more fixed speed supplies the base load, and a VSD will help in matching the variations in time. The energy consumption of this device is usually directly proportional to the speed of the compressor itself; this means more energy savings for partial load situations. The only drawback in terms of energy consumption is on full load situations, with a slight higher consumption with respect to the traditional fixed speed drives.
2.3 Air treatment units
A lot of auxiliary equipment is needed for such systems, constraining the application in situations where there are no space problems. Indeed, we have the presence of compressor aftercoolers, filters, separators, dryers, heat recovery equipment, lubricators, pressure regulators, air receivers and drains.
35 2.3.1 Dryers
Downstream the compressor, the air is normally at higher temperature with respect to the ambient, and the after-cooler gives a very high relative humidity. If such air enters in the distribution pipes, likely, will happen the condensation throughout the line with related problems of corrosion and contamination at the point-of-use. To avoid this annoying situation, the presence of an air dryer is the minimum requirement for every compressed
air system.
The temperature and the degree of humidity of air depend on operating conditions, as consequence different dryers have different characteristics. For instance, operating in a very cold environment, we need the dew point of air being lower than the ambient conditions to avoid any ice formation. In a warm environment (higher than air flowing away the aftercooler) since the dew point increase, we have not such issues. Throughout the dryer we have a pressure drop from 0,2 to 0,35 atm and higher drying degree entail a higher pressure drop, so from an energy efficiency perspective the ability to drying up and no more than the required dew point is necessary.
2.3.1.1 Refrigerant
The goal of the dryer is to reach a low humidity in the air stream. To do this, the air is cooled down by a closed-circuit refrigerant. Basically, the energy required for the cycle working principle is that of a compressor driving the fluid. The air can be pre-cooled eventually with the outlet of the dryer air, that is cooler; this gives two different benefits: the amount of
36 cooling power by refrigerant is less and the outlet air is increased to room temperature, avoiding risk of condensate formation outside the tubes of the end-use-point. Refrigerant coolers are of different types: as an example, there is the glycol-water mix that own some advantage with respect to the use of pure water as a coolant. Indeed, the mix is able to cool down its temperature to 0°C without freezing, but we have a tradeoff because the thermal capacity is lower than the water-cooled; for this reason, the thermal capacity of the mix is lowered. Variable speed refrigerant dryers use electronic devices to adjust the drying capacity on the system demand; this entail a good part load efficiency.
2.3.1.2 Desiccant (adsorption)
This type of dyers uses a porous material to dry the air. Once this material is saturated, it must be regenerated; depending on the type of material it can be used different types of regeneration. The desiccant needs to be regenerated regularly to regain the drying capacity. There are more type of dryers depending on regeneration strategy:
• Heatless: use the dried compressed air to regenerate the desiccant material, this air is called “purged air”. The ongoing use of the 15-20% of the nameplate rating, is an additional cost (3-4 kW per 100cfm); for this reason, this drying method is not used for high flow rates.
• Exhaust purge: this uses a lower amount of dried air for the membrane regeneration, because of the passage through an electric heater (2.25 kW per 100 cfm). This limit the purge flow of something like the 8%, guaranteeing a 25% less energy than the heatless. • Blower purge: a blower that blows ambient air is used instead of the compressed air, so the entire output is available for the system (2.5 kW per 100 cfm). The energy consumption as consequence is pretty lower than the heatless dryers.
Figure 10: schematic of an exhaust purge desiccant dryer
37 • Heat of compression dryers (HOC dryers): the desiccant is regenerated thanks to the heat of compression generated during the compressor’s work. Instead of heading the air to the after-cooler, in this case the air is used to regenerate the desiccant. This dryer can be used only with oil-free compressors since the lubricated one has no so high temperature to guarantee the regeneration.
2.3.1.3 Absorption
Also known as deliquescent-type dryers, these devices use the drying medium that changes its physical state, passing from solid to liquid, and as consequence, cannot be regenerated. Despite nowadays this technology is in disuse, there are a lot of chemicals that can be used for drying, the most common are: sodium, potassium, calcium and those with a urea base. 2.3.2 Filters
2.3.2.1 Intake filters
Inlet filters are of paramount importance as shield from airborne atmospheric particles, insects and other impurities. Should be replaced periodically. One may ensure the pressure differential to be low, for the efficiency of the air compressor as well as its output capacity.
2.3.2.2 After filters
These filters are placed downstream the compressor and their primary scope is to drop out the excess lubricant in lubricant-injected air compressors. Different filter types exist, depending on cleanliness of air required. Thin filters have the higher pressure drop on its edges; the one that ensure a minor pressure differential is the particulate filter; take care of the fact that pressure drop downstream the compressor should be avoided, because this mean the loss of part of compression work made by the unit. Pressure losses reduction are proportional to the double of increasing capacity of the filter. When pressure differential causes an excessive energy consumption, one may think on maintenance and replacement at the right time, applying some gauge for an ongoing system performances monitoring.
2.4 Heat reduction units
2.4.1 Pre-cooler and inter-cooler
The coolers unit can be placed at the intake of the compressor, between stages or immediately before the dryers. Intercooling effects have the same of the intake compressor
38 Shaft power 100% Recoverable energy 94% Radiant losses 2% Remaining in CA 4%
position since they place before the next step of compression; the place of the intake cooler lowers the air temperature entering the compressor, increasing the efficiency since the air density is higher at lower temperatures, permitting more air particles entering the compressor for each rotation of the rotor. The need for other types of compressor is, thus, lowered.
2.4.2 After-cooler
The downstream cooling by after-cooler instead has the final objective of decreasing the content of moisture in the air, allowing the dryers to work at them best. The aim is to decrease the dry bulb temperature (wet) to condense water vapor, which must be separated and drained from the system. At this point the air has an optimal value of T, and despite the specific humidity is lowered, the relative one is nearly to the maximum value. The need for a dryer after the after-cooler is necessary to have a low relative humidity of the air. IT should be located in the vicinity of the compression unit and can be water or air driven; in both cases should own an automatic drainer. The drain water is almost all (from 80 to 90%) cached in a water separator. Compressed air Temperature outside the after-cooler is highly variable but is generally in the range of 10°C over the refrigerator temperature. Most of compressors have an after cooler included in the packaged units.
2.4.3 Heat recovery on compressors
From an energy efficiency point of view, defined as the output delivered on the total amount of energy consumed, the compressed air system has basically a very low ratio. In the figure is shown the strict dependence of air being compressed and the contemporary conversion of the supplied energy by the shaft of the electric motor in heat. Moreover, the system has end point applications that on average requires quite low pressure, making calculation of
39 the overall efficiency even lower (23). As suggested again by the figure, the energy is free of being recovered, usually in the form of hot air or water for the auxiliary services. In this situation problems arises when the point of use of compressed air, that is the same of the potential energy recovery, is far away from the possible point-of-use of the heated fluid. So, an alternative, is to sell the amount of energy produced as a consequence of the compression
process to some energy supplier, when possible.
Basically there can be the presence of the air-cooled compressor system, with the hot air flow distributed by a fan and headed to a pre-heating battery or for building heating. The alternative is a water-cooled system to give a help as supplement for an existing hot water system.
From an economic perspective, the energy recovery in the compressed air installations are real and the ROI is as short as 1 to 3 years (24). Moreover, the use of energy recovery practices by means of a closed cooling system, enhances the compressor operating conditions, reliability and service life because of the lower rise of temperature inside the compressor rooms and high cooling water quality (24). A higher quality means higher temperature for the heating from the water. Depending on the enthalpic level, the air can be used for various purposes, from the heating of boiler return (60°-80°) to the hot tap water (40°-60°).
2.5 Ancillary equipment: receivers and separators
A capacity storage is required for maintaining the system stability over time, but also to maintain the required efficiency and the highest possible quality of air. Here a classification is operated between the primary or secondary type, depending on the task performed. Please, notice that the size is not unique and depends over the compression capacity, regulation system and consumer’s air requirement.
2.5.1 Primary receiver
this acts as a general system storage of air, and its location is close to the main compressor in case of multiple compressors layout, but the exact location depends on the need upstream or downstream the clean-up equipment.
Major tasks of this components are: