Biometric Walk Recognizer
Research and results on wearable sensor-based gait recognition
PhD School in Information Science
Dottorato di Ricerca in Information Science – XXXI Ciclo
Candidate Alessio Mecca ID number 1392443
Thesis Advisor
Prof. Maria De Marsico
A thesis submitted in partial fulfillment of the requirements for the degree of Doctor of Philosophy in Information Science October 2018
Thesis defended on 28 February 2019
in front of a Board of Examiners composed by: Prof. Nome Cognome (chairman)
Prof. Nome Cognome Dr. Nome Cognome
Biometric Walk RecognizerResearch and results on wearable sensor-based gait recognition
Ph.D. thesis. Sapienza – University of Rome ISBN: 000000000-0
© 2018 Alessio Mecca. All rights reserved
This thesis has been typeset by LATEX and the Sapthesis class. Version: January 30, 2019
Dedicated to: who never gives up and keeps going on walking
and
to my grandmother who supported and putted on with me throughout the university course
iii
Abstract
Gait is a biometric trait that can allow continuous user authentication, though being classified as a "soft" one due to a certain lack in permanence, and to sensibility to specific conditions. The earliest research in the domain on gait recognition relies on computer vision-based approaches, especially applied in video surveillance. More recently, the spread of wearable sensors, especially those embedded in mobile devices, which are able to capture the dynamics of the walking pattern through simpler 1D signals, has spurred a different research line. This capture methodology can avoid some problems related to computer vision-based techniques, but suffers from specific limitations. Related research is still in a less advanced phase with respect to other biometric traits. However, the promising results achieved so far, the increasing accuracy of sensors, the ubiquitous presence of mobile devices, and the low cost of related techniques, make this biometrics attractive and suggest to continue the investigations in this field. The first Chapters of this thesis deal with an introduction to biometrics, and more specifically to gait trait. A comprehensive review of technologies, approaches and strategies exploited by gait recognition proposals in the state-of-the-art is also provided. After such introduction, the contributions of this work are presented in details. The research deals with different strategies for gait biometrics, including preprocessing and recognition techniques, in order to allow both an automatic recognition and an improvement of the system accuracy.
iv
Contents
1 Introduction 1 2 Biometrics 4 2.1 Biometric Applications 4 2.1.1 Verification (VER) 5 2.1.2 Identification 73 Gait as a Biometric Trait 10
3.1 General Gait Physiology and Individual Characteristics 10
3.2 Approaches to gait recognition 12
3.2.1 Machine Vision-based Approaches 13
3.2.2 Floor Sensor-based Approach 15
3.2.3 Wearable Sensor-based Approach 16
4 Related Work 17
4.1 Wearable Sensors for Gait Recognition 17 4.1.1 Standard Sensors Embedded in Smartphones 17 4.1.2 Other Kinds of Wearable Sensors used in Gait Recognition 21 4.2 Gait Datasets Acquired by Wearable Sensors 22
4.3 Preprocessing Techniques 26
4.4 Recognition Methods 28
4.4.1 Step/Cycle Segmentation Procedures 30
4.4.2 Dynamic Time Warping 31
4.4.3 Systems comparing step/cycle-segmented signals 32 4.4.4 Systems Comparing Timed Chunks of Signal 37 4.4.5 Systems Comparing Unsegmented Signals 39 4.4.6 Summary tables of state-of-the-art proposals 40 4.5 Gait Recognition in less controlled conditions 41 4.5.1 An alternative to smartphones: smartwatches 41 4.5.2 Device Orientation and Phase Changes 49
4.6 Less investigated topics 49
4.6.1 Optimizations for Gait Recognition Systems 49
4.6.2 Gender Recognition by Gait 50
4.6.3 Wearable Sensors Capturing Different Kind of Physical
Contents v
4.6.4 Multibiometric Systems including wearable sensor-based gait
recognition 53
4.7 Robustness to Presentation Attacks 55
5 The Investigated Approaches To Wearable Sensor-based Gait
Recog-nition 57
5.1 Introductory Concepts 57
5.2 Biometric Walk Recognizer System 59
5.2.1 The Evolution of the Biometric Walk Recognizer Approach 64 5.2.2 Study on the Benefits of Gaussian Kernel Convolution 69 5.2.3 Study on the Impact of Gait Stabilization 71 5.2.4 The Use of Beacon Technology in a Gait Recognition Scenario 76 5.2.5 Feature Based Gait Recognition 77
5.3 Other Attempts 83
5.3.1 Preprocessing Strategies 84
5.3.2 Step Segmentation Procedures 85
5.3.3 Strategies for the Comparison Subsystem 85 5.4 Accelerometer Data Normalization and Application to Gait Recognition 87
5.5 Other Works 92
5.6 List of Research Contributions 96
6 Conclusions and Future Work 98
1
Chapter 1
Introduction
Modern technologies facilitate everyday life, but also create unprecedented security issues. This observation become obvious thinking about modern smartphones and tablets: they are literally miniaturized computers that can access, modify and send documents (possibly private) from anywhere. More in general, a robust user authentication strategy can prevent unauthorized access to restricted physical areas (e.g., a bank caveau), remote services (e.g., home banking), or mobile devices (e.g., smartphones and tablets). The processes to authorize a user conventionally follow three different kinds of strategies: knowledge-based, token-based, and biometrics-based [1].
The knowledge-based approach relies on a secret that the user has to know/re-member, e.g., the well-known username/password pairs or the PIN codes. Some studies investigated the habits of the users in managing their passwords, highlighting some usability limitations associated with them. For instance, to remember multiple usernames, passwords and PIN codes is not an easy task, especially if they are very complex or long. According to old literature, a heavy information technology user has to remember on average 21 passwords, and some of them even more than 70. From these studies, it comes out that 49% of the users write down or store their passwords in a file, and 67% never change them. More than ten years ago, Gaw and Felten [2] found that even undergraduate students had an average of about 12 accounts, and they found that password reuse was commonplace. Just some time later, Florencio and Herley [3] conducted a large scale study by collecting data on password use from more than 250000 users, during a six-month deployment of a Microsoft toolbar. They found that an average user had 6.5 passwords. However, users accessed 25 accounts over the six-month period, and logged into 8 accounts per day. Therefore, each password was shared across 3.9 websites. Finally, a 2011 diary study of password use by Hayashi and Hong [4] collected detailed records of password entries over a two-week period. They found that users accessed a mean of 8.6 accounts over two weeks, and estimated that most participants had about 11 accounts in total. In practice, all of their participants reported password reusing. In these studies the majority of the participants mentioned memorability as a reason for password reuse. Of course, the use of the same password for all services causes a possible security breach. The same happens for too short, or too obvious and/or easy-to-guess passwords.
2
The token-based authentication approach is characterized by the possession of physical objects, e.g., physical key(s)/card(s). Of course, as material objects, they can be stolen/lost by the user or duplicated by an attacker with enough time aiming at reusing the victim privileges (e.g., to access a secure zone more than one time).
When a higher level of security is required, these two approaches can be combined as, e.g., in the case of the well-known pairs of bank card and related PIN code.
The biometrics-based approach exploits either physical or behavioral charac-teristics of an individual, or a combination of them. This approach differs from the two mentioned above because it is not related to memory or possession but rather to the way an individual behaves. This is something that cannot be forgot, lost, or stolen, even if it is still possible, for an attacker, to try to imitate or forge it. Moreover, biometric traits have a more direct and explicit link with humans than passwords or tokens, since biometrics use physiological and behavioral features of human beings. Even thanks to this fact, nowadays the request for biometrics-based systems is continuously increasing.
Of course, also the biometrics strategies can be combined with the approaches in the other two categories, e.g., in a PIN code/fingerprint authentication strategy.
From the biological point of view, a number of human traits can be used as biometrics, including the popular fingerprints and face, the iris, the hand geometry, and so on. These traits must obey a number of conditions, especially universality (the trait must be owned by all subjects), uniqueness (the trait must present some unique/discriminative characteristics), and permanence (the trait must remain stable for a sufficient time), but also ubiquitousness (the trait can be collected anywhere) is quite desirable. Given the presence/absence of these properties, biometric traits are classified as either strong or soft [5]. Strong traits are generally related to physical/appearance characteristics and allow the recognition of individuals with a sufficient accuracy, though suffering from trait-specific problems. For example, face recognition suffers, at different extents, from modifications in Age, Pose, Illumination and/or Expression (A-PIE). Some soft biometrics are related to high level users’ appearance characteristics and can be used to identify groups of individuals (e.g., the hair or the skin colors, and the height). Some others are related to user behavior and consequently lack in permanence, especially in long term analysis (e.g., most behavioral traits can be conditioned by both physical and/or emotional factors differing from time to time). It is also possible to find some traits that can be classified in the middle of these two "soft" biometric subcategories. For example, the way a person walks (gait) is both related to physical characteristics (such as the body conformation) and behavioral factors (e.g., energy saving strategies, see Section 3.1 below) of an individual. It is worth observing that literature has often demonstrated that behavioral traits are generally difficult to spoof (maliciously reproduce). For this reason, they can represent interesting candidates to be used in conjunction with strong traits, that are more accurate but generally less robust to this kind of attack. Even if the gait is included into the soft traits, several studies are still investigating its discriminative power with interesting results. Gait recognition can exploit computer vision techniques (by processing video acquisitions), the analysis of signals from floors equipped with pressure/weight sensors, and/or the data coming from wearable sensors (especially accelerometers).
3
on data coming from accelerometers. This choice is mostly due to the nowadays widespread of smartphones (all including an accelerometer sensor) which allows to perform gait recognition practically anywhere. Moreover, mobile biometrics are becoming increasingly relevant in different scenarios during the last years.
The main goals of this research are the following ones:
• to investigate the best preprocessing techniques in order to enhance the quality of gait signals collected by worn sensors;
• to investigate the best way to compare gait signals in order to increase the recognition capability.
• to prototype different real scenario settings to exploit gait biometrics in order to allow a transparent, continuous, and ubiquitous subject recognition. • to face interoperability problems, e.g., to recognize a subject using different
acquisition devices.
The thesis continues as follows: Chapter 2introduces the main concepts related to biometrics and defines both the different recognition modalities and the metrics used in order to evaluate the performances of a biometrics system. Chapter 3 describes the human gait, discussing the physiological characteristics that allow it to be considered as a biometric trait. It also presents in more details the possible approaches to gait recognition. Chapter 4deals with a comprehensive presentation of the state of the art on gait recognition based on wearable sensors. In particular, the thesis analyzes the available datasets, some commonly exploited preprocessing techniques and the recognition strategies adopted in literature. Chapter 5presents in details the original contributions of my PhD studies to the research community. Finally, Chapter 6 sketches some conclusions and possible future works.
4
Chapter 2
Biometrics
This Chapter aims at providing both general concepts related to biometrics and a common dictionary of the terms used in this research field.
Among the first definitions of biometric recognition, it is worth mentioning the one by Jain at al. in [5]: "Biometric recognition, or simply biometrics, is the science of establishing the identity of a person based on physical or behavioral attributes". Such definition has been further refined by ISO (International Organization of Standardization). According to ISO/IEC 2382-37 [6], biometric recognition is the "automated recognition of individuals based on their behavioural and biological
characteristics".
As already mentioned in Chapter 1, biometric traits are generally classified, according to their discriminative power and long term permanence, as strong or soft. The former traits present properties (i.e., universality, uniqueness, permanence) that allow accurate recognition, especially in controlled conditions, while the latter lack in one or more of such properties. Some physical traits in soft category, e.g., hair color, height, weight, age, do not identify a single user but an entire group. However, they can reduce the search space for recognition. The majority of behavioral traits fall in the soft category, due to the lack of sufficient permanence. For instance, the way of walking, writing or signing, or the keystroke dynamics, may be affected by either physical or emotional status, especially over the long term. Nevertheless, they can be used in the short term for reidentification, to assure, for example, that the person working with the keyboard does not change during a session. These traits, being not akin to physical characteristics but rather to user’s "way to be or behave", are more difficult to forge and spoof. For this reason, these traits can be also used as a further support for strong ones, in a multi-biometrics setting, in order to improve the global recognition accuracy. Among these soft biometrics, the people walking pattern and the related gait recognition, which is the main topic of this thesis, is increasing its popularity, especially due to the possibility to capture gait signals exploiting the built-in smartphones’ accelerometer.
2.1
Biometric Applications
In general, biometric recognition entails a (set of) known subject(s), enrolled with one or more biometric templates (gallery), and an incoming template to compare
2.1 Biometric Applications 5
against the reference (probe). According to the ISO/IEC 19795-1 standard [7], there are three kinds of biometric applications. Before start describing the biometric applications, it is worth to introduce the Failure to Acquire (FTA) error, that is used in some performance evaluation formulae.
Definition 2.1.1. Failure to Acquire (FTA) "The failure-to-acquire rate is the
proportion of verification or identification attempts for which the system fails to capture or locate a sample of sufficient quality" [7].
2.1.1 Verification (VER)
Definition 2.1.2. Verification. The verification is the "application in which the
user makes a positive claim to an identity, features derived from the submitted sample biometric measure are compared to the enrolled template for the claimed identity, and an accept or reject decision regarding the identity claim is returned" [7]. In other words, verification implies a 1:1 identity comparison between the probe and the gallery template(s) of the claimed identity.
Remark. A threshold value is chosen to regulate the acceptance/rejection of the claim.
Remark. "The claimed identity might be in the form of a name, personal identification number (PIN), swipe card, or other unique identifier provided to the system"[7]. In the case of wearable sensor-based gait recognition, this declaration can possibly be implicit, assuming that it corresponds to the identity of the smartphone’s owner.
The performance measures for verification applications take into account the possible system errors.
Definition 2.1.3. FMR The FMR is the "proportion of zero-effort impostor
at-tempt samples falsely declared to match the compared non-self template" [7]. Remark. "The measured/observed FMR is distinct from the predicted/expected FMR (the former may be used to estimate the latter)" [7].
Definition 2.1.4. FAR The FAR is the "proportion of verification transactions
with wrongful claims of identity that are incorrectly confirmed" [7]. The FRR is computed by using the following formula:
F AR= FMR ∗ (1–FT A) (2.1)
Remark. If the FTA is considered as 0 (i.e., no errors happens during the probe acquisition), the FAR is equal to the FMR.
Definition 2.1.5. FNMR The FNMR is the "proportion of genuine attempt
samples falsely declared not to match the template of the same characteristic from the same user supplying the sample" [7].
Remark. As for the FMR, the measured/observed FNMR is distinct from the predicted/expected FNMR (the former may be used to estimate the latter).
2.1 Biometric Applications 6
Definition 2.1.6. FRR The FRR is the "proportion of verification transactions
with truthful claims of identity that are incorrectly denied" [7]. The FRR is computed by using the following formula:
F RR= FT A + FN MR ∗ (1–FT A) (2.2) Remark. If the FTA is considered as 0 (i.e., no errors happens during the probe acquisition), the FRR is equal to the FNMR.
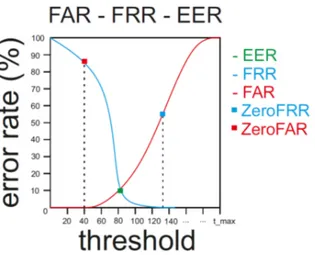
According to the standards, two curves are used to summarize verification performance: the one plotting False Acceptance Rate (FAR) at different thresholds, and the one plotting the False Rejection Rate (FRR) at different thresholds.
It is worth underlining that FAR and FRR are computed from time to time according to the same threshold t. This means that an attempt to reduce one of them unavoidably increases the other one (see Figure 2.1).
A summative measure used in order to describe the global accuracy of a verifica-tion system is the Equal Error Rate (EER). This value represents the intersecverifica-tion between the FAR and FRR curves.
A further possible evaluation parameter is the ZeroFAR, defined as the value of the FRR when the FAR is fixed at 0 (see Figure2.1). It is generally used when a very high level of security is required, e.g., in a military application.
Similarly, but in an opposite contest, it is possible to use the ZeroFRR parameter, defined as the value of the FAR when the FRR is fixed at 0 (see Figure 2.1). It is generally used when the security level is less important than the possible delays created by false rejections. An example is the reidentification in a playground in order to allow an already paying client to re-access the site.
In addition, it is possible to exploit the Receiver Operating Characteristic (ROC) curve and its related Area Under Curve (AUC). This curve is obtained by plotting Genuine Acceptance Rate (GAR=1-FRR) vs. FAR, and its AUC is computed as the percentage of the area covered by the ROC. An example of ROC curve is reported in Figure 2.2.
Figure 2.1. An example of FAR and FRR curves with the related EER, ZeroFAR and ZeroFRR points.
2.1 Biometric Applications 7
Figure 2.2. An example of ROC curves.
2.1.2 Identification
Definition 2.1.7. Identification. The identification is the "application in which
a search of the enrolled database is performed, and a candidate list of 0, 1 or more identifiers is returned" [7].
Remark. The result is a list of the gallery templates, ordered either by increasing distance or decreasing similarity with the probe.
Differently from verification, in this case the subject submitting the probe to recognize does not issue any identity claim. For this reason, a 1:N comparison of the probe with all gallery identities and pertaining templates is entailed. The identification applications can be further distinguished in Closed Set Identification and Open Set Identification.
2.1.2.1 Closed Set Identification (CSI)
Definition 2.1.8. Closed Set Identification. The closed set identification is the
"identification for which all potential users are enrolled in the system"[7]. One metric used for performance evaluation is the identification rate:
Definition 2.1.9. Identification Rate "The identification rate at rank r is the
probability that a transaction by a user enrolled in the system includes that user’s true identifier within the top r matches returned. When a single point identification rank is reported, it should be referenced directly to the database size" [7].
Even if not in the ISO/IEC 19795-1 standard, one of the most used metrics for performance evaluation is the Recognition Rate (RR), computed as the percentage of correct recognitions in the first position of the candidate ordered list returned by the system. A relaxed version of the RR is the Cumulative Match Score (CMS) at rank k. For each rank k, it represents the rate of correct recognitions within the first k positions (note that CMS(1)=RR). Generally used ks are 5 and 10. A comprehensive view of the recognition trend is given by plotting the Cumulative Match Curve (CMC). The points of this curve represent the achieved CMS values for each rank k, i.e., the rate of correct recognition within the first k positions.
2.1 Biometric Applications 8
Figure 2.3. An example of the CMC curves.
2.1.2.2 Open Set Identification (OSI)
Definition 2.1.10. Open Set Identification. The open set identification is the
"identification for which some potential users are not enrolled in the system"[7]. Remark. The acceptance must be regulated by a threshold, in order to allow a reject option.
In this application there are two possible kinds of errors: to accept a subject not enrolled into the system or to refuse a subject that is enrolled. It is worth noticing that in the latter case, the refusal of a subject can both depend on the fact that the correct identity is not in the returned list, or to the failure in the threshold test. The rate of this errors are used to estimate the performances of this kind of application.
Definition 2.1.11. (True-Positive) Identification Rate (TPIR). The
(true-positive) identification rate, or briefly identification rate or TPIR, is the "proportion of identification transactions by users enrolled in the system in which the user’s correct identifier is among those returned" [7].
Remark. "This identification rate is dependent on (a) the size of the enrolment database, and (b) a decision threshold for matching scores and/or the number of matching identifiers returned" [7].
According to this definition, in order to be accepted in an Open Set Identification application, a probe has to meet the threshold value and at the same time to be in the first k results in the returned ordered list.
Definition 2.1.12. False-Positive Identification-Error Rate (FPIR). The
FPIR is the "proportion of identification transactions by users not enrolled in the system, where an identifier is returned"[7].
Remark. "The false-positive identification-error rate is dependent on (a) the size of the enrolment database, and (b) a decision threshold for matching scores and/or the number of matching identifiers returned" [7].
2.1 Biometric Applications 9
Assuming N as the number of templates in the database, the FPIR is computed by using the following formula:
F PI R= (1 − FT A) ∗ (1 − (1 − FMR)N) (2.3) Remark. Of course, in closed set identification is not possible to have this kind of error since each probe surely belongs to an enrolled subject by assumption.
Definition 2.1.13. False-Negative Identification-Error Rate (FNIR). The
FNIR is the "proportion of identification transactions by users enrolled in the system in which the user’s correct identifier is not among those returned" [7]. The FNIR is computed by using the following formula:
F N I R= FT A + (1 − FT A) ∗ FN MR (2.4) It is worth noticing that, as for verification, the same threshold is used to determine both the FPIR and the FNIR, and therefore, trying to lower one of the two values consequently increases the other. At the same time, also the decided length for the returned list k is the same. Also in this case, the evaluation can rely on EER (defined as for verification, but using the FPIR and FNIR curves), ROC, and AUC, similarly to the verification applications.
Even if not mentioned in the ISO/IEC 19795-1 standard, it is possible to find in literature results presented in terms of the Detection and Identification Rate DIR(k,t). It represents the percentage of identification transactions in which, given the acceptance threshold t, the correct identity of the subject is returned within the first k positions of the returned ordered list of candidates. In a similar way of CSI, it is also possible to compute the DIR(1,t), which considers only the first identity returned in the ordered list. This is analogous to the RR for CSI but, of course, it takes into account the fact that an acceptance threshold is also required. Using this definition, it is possible to compute FRR=1-DIR(1,t) and the FAR as for verification.
In general, Open Set Identification is the biometric application raising more errors. Though being definitely more realistic than Closed Set Identification, it has been rarely reported in literature so far, but the U.S. NIST (National Institute of Standards and Technology) is encouraging its use.
10
Chapter 3
Gait as a Biometric Trait
This Chapter aims at presenting the main characteristics of human gait patterns. Moreover, it shows the motivations for which it is possible to consider the gait as a biometric trait. It also sketches the three possible categories of approaches exploited in gait recognition.
In the following, Section 3.1 presents the general physiological mechanisms underlying the gait, briefly describing how the idea of motion is converted into movement. Moreover, it introduces the concept of cycle and step used in the gait analysis (see Chapter 4) and shows the 8 gait phases that make up a gait cycle. Section 3.2 describes the 3 different research lines to approach gait recognition, aiming at highlighting the general pros and cons.
3.1
General Gait Physiology and Individual
Character-istics
A classical authoritative source for understanding bio-physiological rules governing human gait is [8]. The locomotor planning starts in the brain. As for any kind of movement, the "idea" (in this case the desired walking movement) must be converted into the corresponding pattern of muscle activity [9]. The next phase towards the concrete walking entails the transmission of the neural output. The final implementation of the command can be divided into task planning and plan execution. The muscles activation produces tension, that in turn generates the joints movement. As reported in [8], "the joint forces and moments cause the rigid skeletal links (segments such as the thigh, calf, foot, etc.) to move and to exert forces on the external environment". The gait action triggers reaction forces from the ground. These are applied through the feet and, when sufficient, support the body and avoid its displacement. These actions represent a basic requirement for walking, together with the familiar periodic movement of each foot between two support positions. Even in the case of underlying pathologies that can distort walking, this pattern can not be scattered significantly [10]. "This periodic leg movement is the essence of the cyclic nature of human gait"[8].
In general, a gait period begins from the movement of the first leg and ends when the second leg completely touches the ground. It is characterized by 2 phases and 8 configurations [8], as in Figure3.1, where arm swinging can also be observed.
3.1 General Gait Physiology and Individual Characteristics 11
Figure 3.1. Walk cycle dynamics. Inspired by: [8]
The entire gait period is generally called cycle, while the first four configurations and the next four ones compose the right step and the left step (or vice versa). Even if not always true, it is possible to observe that women generally present shorter steps and more pelvic movements. Moreover, intra-subject differences can be caused by ageing and by other physical conditions (such as painful events involving leg(s) and/or foot(feet)).
Given the above aspects, it is worth wondering at which extent this trait can be considered distinctive for different subjects. Biomedical literature studies answer this question. As underlined in [11], the basic walking characteristics are naturally stereotyped, and the basic kinematic patterns are invariant across the normal range of speeds (slow, normal, and fast pace). Moreover, the locomotion must preserve postural stability and dynamic equilibrium [12]. It is also worth noticing that possible changes in support conditions call for an anticipatory adaptation involving coordinated synergies of upper limb, trunk and lower limb movements [13]. Moreover, in normal posture and locomotion conditions, the head is stabilized in space allowing the monitoring of gravity direction [14]. Notwithstanding the common aspects, different personal energy saving strategies produce qualitative and quantitative features, that make individual walking styles unmistakably recognizable. For example, the experiments in [15] by electromyographic (EMG) signals show that "locomotion cannot be considered as a completely stereotyped function" since "despite the similar kinematics, the torque time courses of different subjects present significant differences in agreement with different temporal sequence of muscle activation. A later work [16] investigates sequences of muscle forces providing for coordinated gait. Overall, posture and locomotion can be considered as a dynamic, personal body signature [17]. The behavioral variations producing this effect can be partially explained by kinematic principles, which are investigated in [18]. Different kinematic strategies are found to be among the factors that produce inter-personal differences in walking patterns, and that can therefore be exploited for identification.
It is worth pointing out that gait is also effected by external factors. For example, literature studies [19,20] (see also below in Chapter4) demonstrate that different kinds of worn shoes have an impact on the recognition capability. Moreover, such studies only consider man shoes. At the best of our knowledge, there are no studies concerning woman shoes, especially high heels, that produce totally different walk
3.2 Approaches to gait recognition 12
dynamics that can be also easily noted by humans. Another external factor that influences the gait dynamics is the ground conformation. In fact, to walk on a steep climb or descent requires different energy saving strategies than just walking on a flat ground. Moreover, also the stairs or a dismal ground have an impact: the first because going up and down the stairs is a different task than just walk normally and the second because, in order to avoid physical damages, the brain must actively control the gait dynamics.
3.2
Approaches to gait recognition
Considering the biometrics field, it is possible to classify the literature approaches to gait recognition in three main groups, according the division proposed in [21], depending on the way gait data are acquired and analyzed.
• Machine Vision-based approaches: use video sequences and generally aim at extracting some visual elements to model static/dynamic features of walking pattern.
• Floor Sensor-based approaches: generally collect data from pressure and/or weight sensors embedded in floors, and generally exploit properties more related to quantitative physical user’s features than to user’s appearance. • Wearable Sensor-based approaches: acquire data using sensors directly
worn by the user, capturing pure walking dynamics; in this case there is no need to equip the environment, allowing ubiquitous recognition.
Similarly to what happens with other biometric traits, both intra-subject differ-ences and inter-subject similarity can condition gait recognition. For example, the gait pattern can be modified by walking speed, kind of worn shoes, ground slopes, and possibly by temporary physical problems. Different kinds of worn dresses and carried objects can be further factors disturbing gait recognition if the source of data is a camera [22]. In this case, these factors are added to the problems that generally affect image processing, e.g., different camera views, varying illuminations, and (partial/self) occlusions. Gait recognition based on sensor-equipped floors has been abandoned during the last years due to the low recognition accuracy achieved and the cost of acquisition devices/ambient set up. However, the biomedical field [23, 24] still exploits gait analysis by equipped-floors for diagnostic research. Wearable sensors appear as a promising alternative to reduce the recognition problems related to appearance.
Notwithstanding limitations, gait recognition offers some advantages too: • it can operate at variable distances depending on the acquisition modality:
– Machine Vision-based approaches need a distance up to 10 meters, to
maintain a sufficient image quality;
– Floor Sensor-based approaches ignore distance problems since the devices
3.2 Approaches to gait recognition 13
– Wearable Sensor-based approaches ignore distance problems since the
acquisition device is located on the user body.
• it is non-intrusive, since the data subject has not to perform any specific action but walk;
• it is non-invasive, since the data subject does not need any physical contact with an acquisition device;
• gait it is quite difficult to imitate (see Section 4.7);
• though being a soft biometrics, recent works report interesting performances [25], and it can be combined with other "strong" biometrics to improve recog-nition and/or as a presentation attack detection technique.
3.2.1 Machine Vision-based Approaches
The gait recognition approaches based on Machine Vision entail the acquisition of walking signals using one or more video-cameras from distance. Therefore, they require an ambient set up and, in order to monitor distant zones, this set up must be replicated multiple times in order to cover the desired areas.
Approaches in this category can be divided into two main groups: model-free and model-based. The model-free strategies (also often referred as "silhouette-based") usually train classifiers to analyze the motion of the silhouette across the scene. Model-based techniques, instead, rely on a precise model of the human movement, built by exploiting the limbs and joints composing human body. Generally, features extracted from the such model are compared against those stored for the user model.
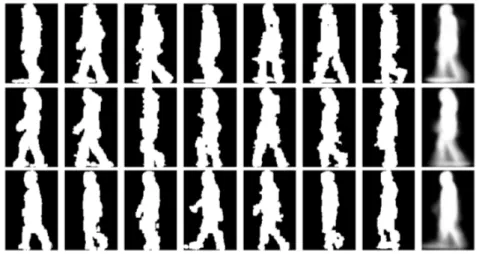
Two common steps of machine vision-based strategies are the detection of a person in the scene, and the tracking of that person’s walk. Of course, occlusions represent a delicate problem in machine vision-based approaches. In most cases, a preprocessing phase includes background subtraction and body silhouette extraction, eventually identifying the Degree of Freedom (DOF) points [26] (corresponding to body joints) in order to track user’s gait. What differs from one system to another are the possible further preprocessing operations used to improve the quality of extracted data, and/or the kind of comparing strategies used in order to find the correct identity. The majority of machine vision-based works in the state-of-the-art convert the preprocessed data into the related Gait Energy Image (GEI) or its variations, and use these images as the base for feature extraction and/or comparing.
Among the other possible differences in the state-of-the-art proposals, it is to mention the use of different technologies for data acquisition, such as different kinds of cameras (fixed or Pan-Tilt-Zoom), that can possibly work in different conditions (e.g., visible light, infrared or thermal). Moreover, the quality of the acquisition
device is another not negligible factor.
In addition, there are systems that exploit the fusion of the data acquired by more (possibly different) cameras, in any combination. In these cases, is it necessary to synchronize the acquired signals, and this generally requires a stereo calibration procedure, adding computational demand. Of course, the use of more than one kind of camera helps the recognition, e.g., for the previously mentioned problem of the carried objects.
3.2 Approaches to gait recognition 14
Figure 3.2. Three examples Gait Energy Image (the last image of each row) extracted by the corresponding gait sequences. Source: [27]
In general, the state-of-the-art approaches working in visible light may eventually suffer from pose, illumination, and occlusion problems, especially in outdoor envi-ronments. Moreover, another not negligible aspect is the perspective with respect to the camera. In this case, when the user is not consistently aligned with the camera, this creates anomalies and distortions, for example, in the extracted GEI. For these reasons, if only visible light cameras are involved, the comparing generally provides good results only in controlled scenarios.
Some possible solutions to the above mentioned gait analysis problems are proposed in literature. For instance, the problem of pose can be resolved by combining data from different cameras or choosing as video source only the frames in which the highest number of DOF points can be extracted from the images.
The problem of illumination can be reduced by introducing infrared cameras, that allow a more accurate silhouette extraction, especially in dark scenarios, even if they have problems with strong illumination sources if not combined with a visible light camera.
The possible occlusion of elements in the body silhouette represents a delicate aspect, because the performance of recognition algorithms significantly decreases if the subject holds an object or carries a backpack, due to an erroneous silhouette extraction. As shown in the already mentioned [22], a thermal camera can be a suitable solution to solve this problem in the majority of cases. In fact, thermal cameras can help in the identification of the subject body that possibly is warmer than the carried object(s), but of course, their use requires the combination and synchronization of more cameras.
Finally, the problem of perspective can be attenuate by geometric transformations, but this would increase the computational effort and it is not always possible to project data in a reliable way, to reconstruct an aligned view of the scene.
Complete surveys on machine vision-based gait recognition can be found in [28, 29, 30]. Such works provide comprehensive discussions about techniques for machine vision-based approaches. The review in [31], instead, provides a description of model-free machine vision approaches only.
3.2 Approaches to gait recognition 15
3.2.2 Floor Sensor-based Approach
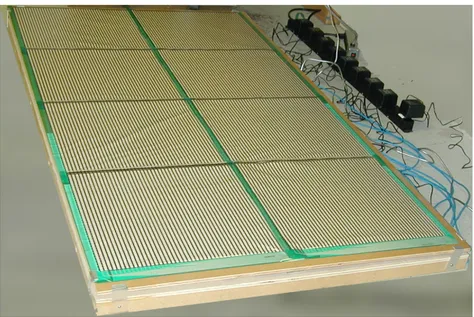
The Floor Sensor-based approaches rely on the use of a special equipped floor able to record pressure and/or weight variations. This allows a data acquisition that is not afflicted by the well-known and above mentioned machine vision problems. Moreover, the preproccessing algorithms, working generally on linear signals, have a very little impact in terms of computational effort. On the other hand, as machine vision-based systems, also in this case there is a lack of ubiquitousness, because the monitoring of multiple zones requires equipment set up and duplication. Besides this factor, the performances are generally lower with respect to the machine vision-based strategies. There are very few works about this kind of approach for user recognition, and the research in this field has probably been overwhelmed by the new and more practical wearable sensors.
Figure3.3 shows an example of a floor equipped with sensors.
Figure 3.3. An example of a pressure sensor-equipped floor. Modified from: https://ame2.asu.edu/projects/floor
Three proposals concerning floor sensor-based recognition are presented in [32, 33, 34]. The latter especially points out how gait analysis [35] can be also exploited for diagnostic/clinical purposes (see [36]). In fact, as already mentioned, even if this kind of approach is nowadays rarely used for the recognition of individuals, the interest is still alive in the biomedical field. In such field, equipped floors are used for gait pattern analysis in the diagnosis of particular pathologies and as a rehabilitation support. Two examples can be found in [23] and in [24]. In the first, data from equipped floors are used for the diagnosis of Cerebral Palsy and for the evaluation of the outcomes from treatments, while in the second they are used in the study of Parkinson’s disease.
3.2 Approaches to gait recognition 16
3.2.3 Wearable Sensor-based Approach
"The growing popularity of wearable devices is leading to new ways to interact with the environment, with other smart devices, and with other people. Wearables equipped with an array of sensors are able to capture the owner’s physiological and behavioral traits, thus are well suited for biometric authentication to control other devices or access digital services." This quotation from the survey presented in [37], and a number of recent works [38,39,40,41,42] point out a new trend in biometric research, focusing on cheap, widely available, and easy-to-set-up wearable equipment(s). Such equipment(s), and in particular smartphones where they are possibly embedded, can further spur "a non-intrusive autonomous sensing and context recognition". This allows the development of a new class of applications defined as "opportunistic user context recognition with mobile phones". Such applications have been recently surveyed in [43]. As for some other biometrics (e.g., writing dynamics, signature, iris, face, fingerprints and so on), gait signals can be acquired by mobile devices by standard built-in sensors, especially accelerometer and gyroscope.
Being the main topic of this thesis, the wearable sensor-based approaches are described in more details in Chapter 4. For this reason, this Section only sketches the main lines of research in this field.
In literature, gait recognition by wearable has been faced following two different families of approaches. The strategies in the first group deal with the characteristics (such as shape, period, phase, and so on) of the gait signals. These approaches exploit signal processing techniques, trying to find the best way to compare the entire gait signal or pieces of it (generally corresponding to steps or cycles - see also Section 3.1). One of the most used techniques in this category is the well-known Dynamic Time Warping (DTW), also widely exploited in speech recognition [44], and its variations. The strategies in the second group deal with machine learning techniques, trying to extract the most relevant aggregative characteristics from the gait signals. The new trend in this category is the use of deep architectures, such as Deep Convolutional Neural Networks (Deep CNN). Of course, this kind of approach generally requires an elevate (and sometimes huge) amount of training data to properly work and generalize. Unfortunately, freely available datasets are very few and present some limitations (see Section4.2).
17
Chapter 4
Related Work
This PhD thesis deals with gait recognition by wearable sensors. For this reason, only works in this category have been reported in the following. One of the contribution of this PhD study is a survey of wearable sensor-based gait recognition. This work has been submitted to ACM Computing Survey and is currently under review. This Chapter presents an extract of such survey, with an extensive discussion on the literature regarding acquisition sensors that can be used for gait recognition 3.2.3, freely available datasets 4.2, state-of-the-art preprocessing techniques 4.3, and recognition approaches 4.4. The topics in the last three Sections are less addressed in literature. Section4.5 reviews some works facing gait by wearables; Section4.6 discusses some particular approaches/aspects of the systems exploiting different kinds of wearable sensors; Section 4.7presents some works demonstrating the robustness of gait with respect to impersonation attacks.
Interested readers can find reviews on wearable sensor-based gait recognition in [21,45]. Moreover, gait often appears in researches dealing with human action recognition; extensive reviews are presented in [46,47,48,49].
4.1
Wearable Sensors for Gait Recognition
Section 4.1.1presents the main characteristics of the smartphones’ built-in sensors (focusing especially on the accelerometer). Section 4.1.2 briefly describes other sensors either used in literature works or presenting useful characteristics for gait recognition.
4.1.1 Standard Sensors Embedded in Smartphones
Among the smartphones’ built-in sensors, the accelerometer is the most used for gait recognition, so it will be further discussed in more details in the following Section 4.1.1.1. As for now, it is sufficient to say that it records acceleration values along three orthogonal axes.
The gyroscope is sometimes used in gait recognition too. This sensor is made up by a spinning wheel or disc, rotating around its axes. When the disk is rotating, the orientation of the axes tends to be always parallel to itself and to oppose any attempt to change such orientation, according to the law of conservation of angular
momen-4.1 Wearable Sensors for Gait Recognition 18
tum. For this reason, gyroscopes are generally useful for measuring or maintaining orientation. In gait recognition, when used, the gyroscope is mostly considered as an additional source of information to support recognition by accelerometer. However, differently from the accelerometer, that is a standard equipment for all smart devices (e.g., smartphones, smartwatches, and tablets), the gyroscope is sometimes missing.
For sake of completeness, it is worth mentioning the magnetometer too, because it is often another standard equipment of smart devices. For instance, this sensor is the one that allows geolocalization. It is used to measure magnetization, and the strength and possibly the direction of the magnetic field in a certain point. For this reason, it acts as a compass in consumer devices. At the best of our knowledge, this sensor is barely used in gait recognition, because it merely contributes to detect walking direction. Moreover, it can be negatively affected by external magnetic fields beyond the earth one.
A general consideration about these kind of sensors embedded in the smartphones is that, as for now, the Android standard does not allow to acquired data at a fixed sampling rate. For this reason, if the exploited techniques require samples with a constant frequency, it is necessary to interpolate the captured signal (see Section 4.3).
4.1.1.1 The Accelerometer Sensor
The accelerometer is a sensor able to record acceleration variations in time, reporting them in terms of m
s2 or g. It measures the proper acceleration, i.e., the one relative to free-fall, also known as g-force. This is the acceleration felt by people and objects. Even if it is possible to find accelerometers with only one or two axes, the most common models have three of them. Nowadays, the widespread use of smartphones has significantly incremented their diffusion. In fact, as already mentioned before, the smartphones always have a built-in tri-axial accelerometer sensor, and the majority of them have a gyroscope and a magnetometer too. There are different kinds of accelerometers. Even if only those embedded in smart devices will be discussed here, the general underlying principle is always the same: a mass is taken hang up by some force, e.g., the one produced by direct attachment to an elastic element, such as a spring, and when an external force moves the sensor (and consequently the mass), the device measures the movement. Taking into account the direct proportionality among the movement and the acceleration, it is possible to coherently convert the variation in position into an electric signal. As a consequence, this signal will contain the converted acceleration variations during time. It is worth noticing that this sensor can reveal a different acceleration on each axis, so it is possible to access three different measurements at any time. Figure 4.1 shows a simplified schema of the accelerometer functioning: it is possible to see a spherical mass hung up by three springs, representing the three axes, which pass through it. Moving the cube, the mass will change its position, compressing and extending the spring lengths. These compressions and extensions allow to reveal the physical acceleration on each axis and its direction.
Though the majority of accelerometers use this kind of schema, the modern ones have a micro-manufactured silicon structure, as highlighted in [50]. This is done in order to reduce dimensions. In this case, the mass is not spherical and it
4.1 Wearable Sensors for Gait Recognition 19
Figure 4.1. A simple schema of accelerometer functioning. Self-produced and presented in [118].
is substituted by a mobile plate in a capacitor, hung up between two other plates that are fixed in the structure in a way that avoids any contact between them. The sensor measures the mass movement exploiting the electric capacity variation in the capacitor, which directly depends on the distance between the plates.
Finally, the modern wearable devices generally use accelerometer sensors made up by a single silicon chip with an integrated electronic circuit. These chips are included in the MEMS (Micro-Electro-Mechanical-Systems) category and are microscopic, as big as a match tip. A complete description of all MEMS characteristics can be found in [51]. In addition to their microscopic sizes, they generally have a high sensibility (see below for a definition of this characteristic), are little influenced by temperature variations, provide a good accuracy, are able to reveal relatively small acceleration variations and, lasts but not least, they have a very low power consumption and are very cheap. For these reasons, they are perfect to be integrated in everyday usable devices such as smartphones and tablets.
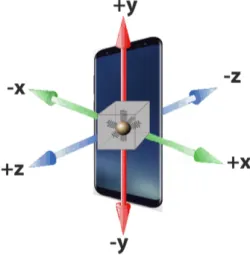
Figure4.2 shows the orientation of the accelerometer axes in a smartphone.
Figure 4.2. Accelerometer axes and their orientations in smartphones. Self-produced image.
In general, data provided by an accelerometer at the time instant ti is a triplet of acceleration values recorded for the three axes, xi, yi, and zi. As a consequence,
4.1 Wearable Sensors for Gait Recognition 20
a walking time series is represented by a series of these triplets. These triplets make up three time series, one for each axis.
It is worth pointing out two important factors. The former is a negative aspect: as it happens with all physical sensors, even two accelerometers of the same brand and production chain can present different values in identical positions and in identical conditions (e.g., walking speed and pace). This possible misalignment with respect to the expected values is negligible for the usual tasks this sensor is used for in smart devices (e.g., rotation of the screen, gaming applications, and so on), but it is relevant for biometrics applications. The second factor is a good property: the linearity. This means that the accelerometer data are directly proportional to the physical acceleration it is intended to measure. This is a very useful characteristic that can be used in various ways. An example is represented by the data normalization procedure developed during my PhD and presented in [52] (see Section5) that aims at solving the problem of inter-sensor differences.
In general, when working with an accelerometer sensor, it is worth taking into account some important parameters that define its physical characteristics and help to better exploit its functionality. In the following, the most relevant ones are introduced.
The maximum range parameter describes the range of acceleration values that can be measured by the sensor: if the collected values are outside this range, the accelerometer will lose its linearity property. This parameter is normally expressed in terms of g (gravitational force or g-force, i.e., 9.81m/s2). Common built-in accelerometers have a range that varies from ±2g to ±8g. For example, the recent Samsung Galaxy S9 contains a LSM6DSL iNEMO inertial module (the same of their previous S8 and S8+ model) that can be set up to acquire acceleration signals ranging from -8g to +8g. The same inertial module is also embedded into the Huawei Mate 10. The Iphone X includes Bosch BMI160 IMU, instead. This sensor can acquire data ranging from -16g to +16g.
The bandwidth expresses the maximum frequency of detectable variations and it is better known as sampling rate or Output Data Rate (ODR). This value is measured in Hz(1/s) and, in accelerometers built in mobile devices, it is generally about 100Hz, while it is possible to find high quality accelerometers with a sampling rate of more than 500Hz. For example, the already mentioned LSM6DSL iNEMO inertial module has an ODR of 400Hz, while the Bosch BMI160 IMU can reach an ODR up to 1600Hz.
The sensitivity, sometimes denoted as resolution, describes the minimum de-tectable acceleration variation. This value is generally expressed in terms of LSB (LeastSigni f icantBit)/g. This means that if an accelerometer has a sensibility of x,
it can provide only measurements that are multiples of x.
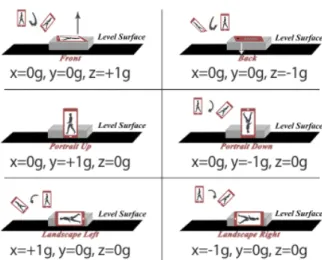
The Offset (often referred as Zero-g Offset or Zero-g Bias) value describes the difference between the real output and the ideal output when no acceleration is applied to the sensor. Considering sensors built in smartophones, the X axis is the one co-planar with the screen, parallel to the short side and with positive direction rightwards; Y axis is the one co-planar with the screen, parallel to the long side and with positive direction upwards; and Z axis is orthogonal to the screen with positive direction frontwards (see Figure 4.2 and Table 4.1). In an ideal scenario, when an accelerometer sensor is placed on a horizontal flat surface with the front
4.1 Wearable Sensors for Gait Recognition 21
Table 4.1. Ideal accelerometer values with respect to the smartphone positions.
surface facing up, the accelerometer values should be 0g on X and Y axes and 1g for Z axis. Rotating the sensor by 180◦, the values for X and Y axes would remain unchanged while the one for Z would change in −1g. Table 4.1 reports the ideal values in all of the six "flat" positions when the sensor is embedded in a mobile device, a smartphone in this case.
4.1.2 Other Kinds of Wearable Sensors used in Gait Recognition
Further sensors are used in gait analysis, though they have not, or not yet, been exploited in gait recognition too. They can be part of wearable devices or can be implanted inside a shoe toe or sole.
Force sensorsreturn a current or voltage measure which is proportional to the
pressure, i.e., to the Ground Reaction Force (GRF) under the foot.
Pressure sensors(mostly capacitive, piezoresistive , or resistive piezoelectric)
measure the force applied on the sensor neglecting its spatial components. Different types offer, e.g., a different range of pressure they are able to stand and measure, or a different sensitivity. These sensors have been recently used for gait recognition too (see Section4.6.3). Pressure sensors can also be exploited in the footstep recognition.
An example can be found in [53].
Goniometers measure the angles, for example, of ankles or knees. Strain
gauge-based ones work with the resistance, modified by sensor flexion (the material stretches, and the current traversing it must complete a longer path, causing a proportional resistance increases). These sensors can be fitted into instrumented shoes but have never been exploited for gait recognition.
Ultrasonic sensorsare used to analyze short steps and stride length and the
feet distance.
Electromyograph (EMG) measures the electrical manifestation of the either
voluntary or involuntary muscle contraction. The signals can be obtained either from surface electrodes (non-invasive), or from wire/needle electrodes (invasive). They can measure different gait features, e.g., kinematic plots of joint angular motion. A recent work uses this technique (see Section4.6.3).
4.2 Gait Datasets Acquired by Wearable Sensors 22
4.2
Gait Datasets Acquired by Wearable Sensors
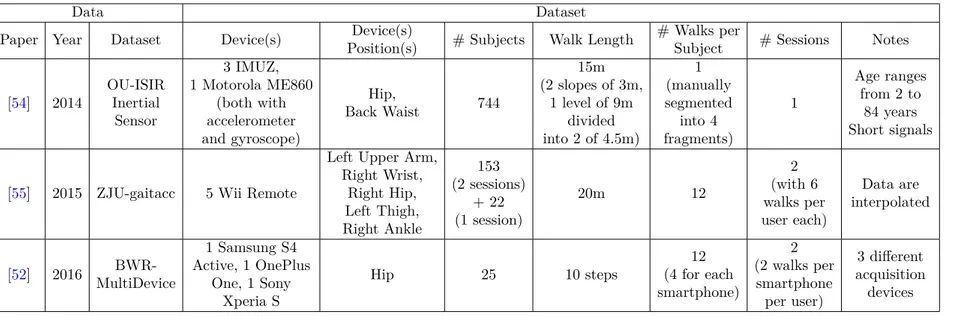
There are few public benchmark datasets for wearable gait recognition. Works published so far in this field are generally tested on different datasets which possibly differ for number of subjects, length of the templates, sampling rate and other important characteristics, so that it is not so easy to sketch a meaningful comparison across them. This Section describes the only three (to the best of our knowledge) public freely accessible datasets relevant for this field. For the works exploiting in-house collections of walking samples, a description of the characteristics of such collections is provided during the presentation of the recognition strategy and their characteristics are summarized at the end of Section 4.4.
OU-ISIR dataset1 [54] collects data from a rather large number of subjects
(744) with a 2-78 years of age range. No further demographic information is provided. The data is captured with both accelerometer and gyroscope, though collected from a similar body location (all acquisition sensors are located in a belt in the hip and back waist zone). A single signal per subject is collected during a single walk (therefore recording very few intra-class variations) along a path with two 3 meters long slopes (one ascending and one descending), and a 9 meters level floor (4.5 meters in each direction). The diversity of ground inclination is a positive feature. The devices to record acceleration are 3 IMUZs, each equipped with accelerometer and gyroscope; in addition, the authors use a Motorola ME860 smartphone with a triaxial KXTF9 Kionix accelerometer. There are 7 signals for each walk (3 from the accelerometer and 3 from the gyroscope of IMUZ, and one accelerometer signal from the smartphone). The total number of acceleration samples per walk is about 1400 and no data preprocessing is applied. Each collected walk is manually segmented to extract 4 fragments, 2 from the level floor path and 2 from the ground slopes. They appear probably too short to provide a reliable benchmark. In fact, there are only about 400 samples for the level floor fragments and about 250 for the slopes ones, and this can negatively affect recognition.
ZJU-gaitaccdataset2 [55] includes gait signals from 175 subjects. Though the
number of subjects is lower, walks are much longer and variated. Data for 153 subjects is captured in two different sessions (6 walks per session), with a delay ranging from a week to six months. The remaining 22 subjects have 6 walks collected in a single session. No individual demographic information on either gender or age is provided. Walk signals are collected along a 20 meters long hallway. This corresponds to signals with a sufficiently high number of samples per walk (about 1400). The acceleration data are collected using 5 Wii Remote controllers, located on the right ankle, the right wrist, the right hip, the left thigh, and the left upper arm. The positive features of this dataset are the high number of walks per subject and per sensor, and the sufficient length of the signals for a significant comparing. Since the two different sessions are sufficiently separated in time, it is also possible to consider more unpredictable time-related variations. However, the signal quality is not optimal, due to the low accuracy of the controller. In addition, the data are interpolated and, at the best of our knowledge, it is not possible to access to the raw
1http://www.am.sanken.osaka-u.ac.jp/BiometricDB/InertialGait.html 2http://www.cs.zju.edu.cn/~gpan/database/gaitacc.html
4.2 Gait Datasets Acquired by Wearable Sensors 23
Figure 4.3. Body locations available from ZJU-gaitacc dataset. The red circle (pelvis zone), is the one exploited in the proposals in Section5. Self-produced image.
signals. This is not ideal to test approaches that do not entail interpolation. Figure 4.3 shows the body locations available from the dataset. The red circle indicates the one exploited to test our proposals, presented in Section 5. The reason for this choice is twofold: first of all, the use of all 5 accelerometers is not suitable for a real system, and in second place the pelvis location is the one that achieves better results (since such bodily zone is the closest one to the gravitational center). Moreover, this location is close to the trousers pocket location, which is a reasonable place to put a smartphone in daily life/real scenario situations.
Concluding, OU-ISIR can assess inter-class variations, thanks to the high number of subjects, while intra-class ones are better captured by ZJU-gaitacc. However, for both of the datasets, the lack of demographic data does not allow further analysis, for example, to study gait-based gender recognition.
BWR-MultiDevicedataset3 exclusively collects data for smartphones-based
experiments. This dataset has been collected during my PhD [52] and a description of its use is presented in 5in more details. This dataset is smaller than the previous ones. It aims at highlighting the differences among signals collected by different devices. It contains walking signals from 25 subjects during 2 different sessions with at least 15 days of time elapse. The data acquisition is carried out along a hallway with 3 different accelerometers embedded in different smartphones: a Bosch Sensortec BMA250 (Sony Xperia S), a ST Microelectronics K330 (Samsung Galaxy S4 Active), and a ST Microelectronics LIS3DH (OnePlus One)4. The acquisition
device is positioned on a belt in a lateral position. Each walk is about 10 steps long with an average number of 1300 samples. Each session contains 2 walks per subject per device. Only a single device at time is used to acquire data and after each acquisition the device is detached and repositioned to add further variations.
3https://sites.google.com/a/di.uniroma1.it/biometric-interaction/home/
gait-recognition/datasets/bwr-multidevice
4We decided to do not include Iphone models for two reasons. The former is a time constraint. The acquisition of accelerometer data using an Iphone would require a possibly completely new application. The latter is a technical constraint. As for the Iphone standards, the management of applications working in background is very strict and barely allowed.
4.2 Gait Datasets Acquired by Wearable Sensors 24
This means that all walks collected separately and no data belongs to the same acquisition momentum. In summary, each session contains 6 walks per subject, for a total of 12 walks (300 walk signals in total). Each walk is annotated with some demographic information (gender and age range, ethnicity is always Caucasian). At the moment, this dataset is the only one that provides cross-sensor signals from different smartphones, and this allows investigating cross-identification approaches. It is worth considering the different capture accuracy of the embedded accelerometers, and the need to somehow normalize signals before comparing them.
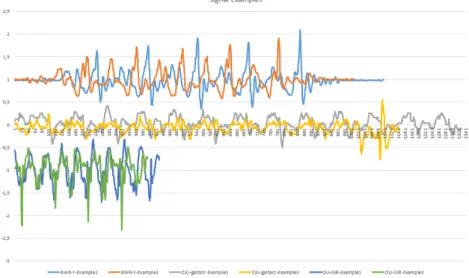
For a summative representation, Table4.2 describes the main features of these three datasets. Figure 4.4 visually exemplifies the signals differences. Figure 4.5 shows 2 templates for the Y axis only (the most relevant one) from ZJU-gaitacc, OU-ISIR, and the in-house dataset collected in my PhD research.
(a) OU-ISIR. (b) ZJU-gaitacc.
(c) BWRMultiDevice.
Figure 4.4. Examples of acceleration signals from OU-ISIR, ZJU-gaitacc, and BWR-MultiDevice datasets.
Figure 4.5. Examples of y axis signal from 2 template taken by ZJU-gaitacc, OU-ISIR, and the in-house dataset collected during my PhD research.
4.3 Prepro cessing T ec hniques 25
Table 4.2. Summary of freely available datasets that were collected by wearable sensors.
Data Dataset
Paper Year Dataset Device(s) Position(s)Device(s) # Subjects Walk Length # Walks perSubject # Sessions Notes
[54] 2014 OU-ISIRInertial Sensor 3 IMUZ, 1 Motorola ME860 (both with accelerometer and gyroscope) Hip, Back Waist 744 15m (2 slopes of 3m, 1 level of 9m divided into 2 of 4.5m) 1 (manually segmented into 4 fragments) 1 Age ranges from 2 to 84 years Short signals
[55] 2015 ZJU-gaitacc 5 Wii Remote
Left Upper Arm, Right Wrist, Right Hip, Left Thigh, Right Ankle 153 (2 sessions) + 22 (1 session) 20m 12 2 (with 6 walks per user each) Data are interpolated [52] 2016 MultiDevice BWR-1 Samsung S4 Active, 1 OnePlus One, 1 Sony Xperia S
Hip 25 10 steps (4 for each12
smartphone) 2 (2 walks per smartphone per user) 3 different acquisition devices
4.3 Preprocessing Techniques 26
4.3
Preprocessing Techniques
This Section deals with preprocessing techniques often used in state-of-the-art proposals. The majority of them are general purpose signal enhancing strategies used in different signal processing fields.
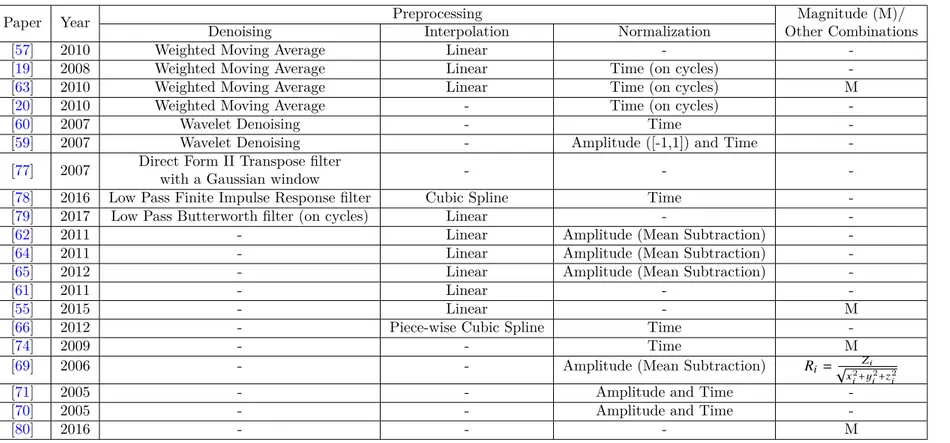
Denoisingaims at enhancing the quality of the signal produced by a device. In
the case of wearable sensors, the noise can be static (constant and device-dependent) and/or dynamic (because of the slight fluctuations produced by the gait). The two most exploited algorithms are the Weighted Moving Average (WMA) [56], (used in [57, 19, 20]), and the Wavelet Denoising (WD) [58] (used in [59, 60]). WMA substitutes signal points with the weighted average value in a fixed neighborhood, with closest points having highest weights. It requires choosing whether to apply the algorithm symmetrically or only forward, and the number of values making up the sliding window (entering the computation). As concerns WD, it entails convolution of the chosen wavelet with the original signal. The key factors are the choice of the mother wavelet and its amplitude.
Figure4.6 shows an example of the effect of denoising by wavelet and by moving weighted average. The wavelet used in the figure is the same of [60,59].
Figure 4.6. An example of the effect of wavelet denoising and moving weighted average.
Time interpolationaims at re-sampling the signal to have data points at fixed
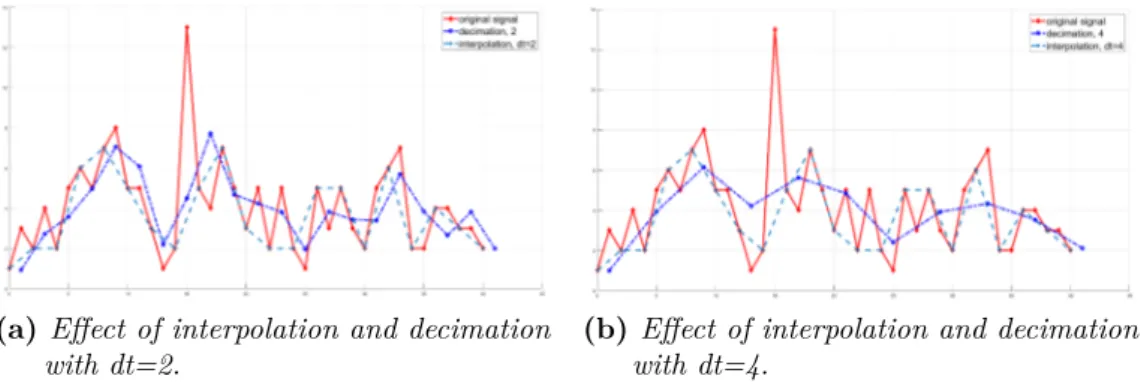
time distance. It selects only the values at suitable points and approximates the missing ones. Linear interpolation is the most used version of this technique [55, 57, 61,62,63,64,65,19,20]. Each cited work chooses a possibly different re-sampling rate, from 100 to 500 Hz. Therefore, there is no evidence of a common standard for this operation, which actually depends on the characteristics of the original signal at hand. Non-linear time interpolation is used in [66], in a version based on piece-wise cubic spline. The different sampling rate and interpolation strategy impede the comparison of the achieved results, since the experiments use different datasets.
Figure4.7 shows an example of the effect of interpolation. Figures4.6 and4.7 show that the signal is regularized but also loses some apparently characterizing elements. Looking at the reported results in works using the mentioned techniques, such elements seem to be redundant in terms of recognition accuracy.
proce-4.3 Preprocessing Techniques 27
(a) Effect of interpolation and decimation
with dt=2.
(b) Effect of interpolation and decimation
with dt=4.
Figure 4.7. Examples of interpolation and decimation with different parameters on the same original signal.
dures. Amplitude normalization reduces the signals within a common range of values. A popular formula is the one used for standardization:
vn(i)=
vo(i) − µ(vo)
σ(vo) (4.1)
where vo(i) and vn(i) are respectively the original and normalized signal values, while µ(vo) is the mean of the original signal, and σ(vo) its standard deviation.
Period normalization reduces signals to the same length (number of samples) by either up-sampling (e.g., by interpolation to increase the sampling rate) or down-sampling (e.g., by decimation to decrease the down-sampling rate)[67]. Examples of works using this technique are [64,65,68,69,70,71,59]. Differently from interpolation, period normalization does not set the time distance between subsequent samples, but the compression or extension ratio needed to obtain a signal with fixed time length/number of samples: the acquired values are evenly distributed according to their total number and to the desired final length [70, 71]. Figure 4.7 shows the different effects of these two procedures. The final effect depends on the time interval chosen as parameter. Alternatively, the methods in [59,60] normalize cycle length by Dynamic Time Warping (usually exploited for comparison only), while [72] exploits self-DTW [73], taking into account the characteristics of a pseudo-periodic signal. Further preprocessing techniques deal with the relations/combinations of the three signal axes and the way in which they are used for comparison. The magnitude vector is often used instead of the values from the three single axes [55, 63, 74]. For each instant of time i, this vector (also known as g-force vector) provides an acceleration value:
vi = q
x2i + yi2+ z2i (4.2) where xi, yi, and zi are the original values of the signal at time ti. The main advantage of the magnitude vector is the invariance with respect to the sensor orientation; this aspect is better discussed in Section 4.5.2. In fact, the different orientation of the accelerometer may affect the values of the signals over the single axis. A second gain is the dimensionality reduction from 3D to 1D. However, since this kind of preprocessing is a kind of aggregation, it causes a loss of possible relevant peculiar characteristics over each single axis. In particular, in gait recognition it
![Figure 3.1. Walk cycle dynamics. Inspired by: [ 8 ]](https://thumb-eu.123doks.com/thumbv2/123dokorg/2892747.11352/17.892.219.702.133.356/figure-walk-cycle-dynamics-inspired.webp)