Dottorato di Ricerca in
“Scienze e Tecnologie delle Mesofasi e dei Materiali Molecolari”
(STM
3)-XX° Ciclo
Ph.D. Thesis
Dense Hyflon
®AD membranes for gas separation: influence of the
solvent and determination of local free volume
Settore Disciplinare: CHIM07
Supervisore Prof. Marcello Longeri Coordinatore Prof. Carlo Versace
Supervisore esterno Prof. Yuri Yampolskii Direttore ITM-CNR Prof. Enrico Drioli
Candidato
Dr. Marialuigia Macchione
__________________________________________________________________________ ANNO ACCADEMICO2007/2008
To my angel: my son Mario with all my love
Introduction
embrane technology, important for nonthermal separation devices, will be the focus of this thesis. The separation of gases by membranes is a dynamic and rapidly growing field. Membranes are being used to separate gases from their mixtures by the differential permeation of the components through them. The membrane separation processes offer a number of advantages in terms of low energy consumption and capital investments. The process requires simple, easy to operate and compact equipment. As a result, the process has acquired a significant role in the industrial scenario in terms of economical considerations, as gases occupy a central position in the chemical feed stock industry.
The main objective of the present thesis is the preparation and characterization of gas separation membranes of innovative and very interesting perfluorinated polymers.
Perfluoropolymers are known as highly insoluble polymers due to their resistance to organic solvents. In this framework, the first goal was the preparation, by the solution casting and solvent evaporation method, of perfluorinated membranes of Hyflon® AD60X and Hyflon® AD80X and to study how some of the membrane properties depend on the preparation conditions. Because of the extraordinary properties of Hyflon the first aim of my thesis gains importance on the applicative point of view. In several aspects, Hyflon has superior properties, for instance chemical stability and solvent resistance, compared to most of the currently available commercial gas separation membranes. Nevertheless the successful practical application requires still a significant research effort. The main part of this thesis will be devoted to illustrate the characterization of Hyflon® AD membranes in
terms of mechanical, thermal, structural as well as transport properties. In particular the entire thesis will be divided as follows:
Part I: General Introduction
Chapter 1: Membranes for gas separation. This chapter is a general overview about the different type of polymer membranes, with particular attention for the gas separation membranes and processes. The main equations related to the gas transport properties and their measurements are also shown and described.
Chapter 2: Perfluoropolymer membranes and free volume in polymers. In this chapter perfluoropolymers properties will be described, focusing the attention on their potentiality as membrane materials. The concept of free volume will be also introduced and the main technique commonly used to measure it will be described.
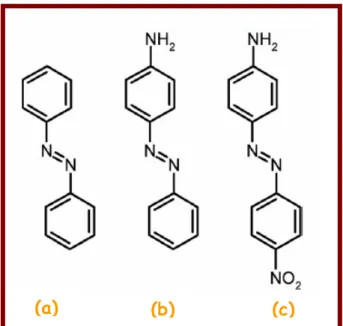
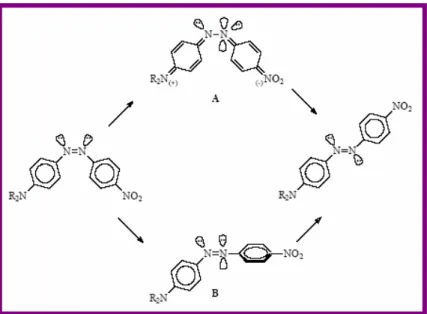
Chapter 3: Photochromism. In this chapter fundamentals of photochromism and photochromic molecules will be introduced, paying particular attention to azobenzene and stilbene derivatives. The importance of trans-cis photoisomerization of this class of dye molecules will be described and their possible use in different fields of application.
Part II: Results
Chapter 4: Influence of the residual solvent in Hyflon® AD membranes. The tendency of Hyflon® AD membranes to retain casting solvent will be described in this chapter. The influence of such a solvent retention on the main properties of Hyflon® AD membranes will be reported.
Chapter 5: Analysis of the distribution of local free volume in Hyflon®AD membranes by
photochromic probes. In this chapter a quite common photochromic probe technique will be shown to be useful for the determination of the distribution of local free volume in Hyflon®AD membranes. For the first time photochromic Hyflon®AD membranes were obtained and the preparation method will be described in detail.
Chapter 6: Smart light-switchable Hyflon®AD membranes. The unusual effect of the photoisomerization of photochromic compounds on transport properties of Hyflon®AD
membranes will be discussed in this chapter. Particular attention will be devoted to azobenzene containing Hyflon®AD60X membranes which show the more interesting
behaviour.
Summary: In this final chapter the most important conclusions of the previous chapters will be summarized and the perspectives of practical application of Hyflon membranes will be briefly discussed.
Acknowledgements
I would like to thank all people who contributed to the good outcome of this thesis and who helped me in carrying out the research work. First of all I want to thank John: my tutor, my coworker, my referee but most of all my friend. He was always kind and present when necessary: in planning together the research work as well as in interpreting obtained results. Thanks to Elena Tocci, who gave a substantial contribute to the theoretical part of my work. Of course thank to Prof. Drioli: he gave me the possibility to work in his lab and, most important, the financial support to carry out the research. I want to thank Pina De Luca who helped me both to perform NMR characterization of the membranes and when I needed a friend and confidant. A very special thank to Prof. Longeri. I already knew his great talent and capability as scientist, but now I have found out a very special person as well. In other words he is “simply” a BIG MAN. Thanks to Prof. Yampolskii, I appreciated very much his contribution to my thesis and I have been positively struck by his liking and kindness. I want to thank also all my friends: Isabella, Sameh, Luigia, Cesare; my parents, my sisters: Ilaria and Francesca and my dear grandmother Luciana. “Dulcis in fundo” a warm thank to my husband Gianni to have been (and to be!!) always close to me!
List of papers
1. J. C. Jansen, M. Macchione, and E. Drioli, “High flux asymmetric gas separation membranes of modified poly(ether ether ketone) prepared by the dry phase inversion technique” J. Memb. Science, 255, 167-180, (2005).
2. J. C. Jansen, M. Macchione, C. Oliviero, R. Mendichi, G. A. Ranieri, and E. Drioli “Rheological evaluation of the influence of polymer concentration and molar mass distribution on the formation and performance of asymmetric gas separation membranes by dry phase inversion” Polymer, 46, 11366-11379, (2005).
3. M. Macchione, J. C. Jansen, E. Tocci, E. Drioli “Influence of residual solvent on the gas transport properties of dense Hyflon® AD60X gas separation membranes” Desalination, 200, 49-51, (2006).
4. J. C. Jansen, M. Macchione, E. Drioli “On the unusual solvent retention and the effect on the gas transport in perfluorinated Hyflon AD® membranes” J. Memb. Sci., 287, 132-137, (2007).
5. M. Macchione, J. C. Jansen, G. De Luca, E. Tocci, M. Longeri and E. Drioli “Experimental and theoretical analysis of the gas transport in dense Hyflon® AD60X gas separation membranes. Influence of residual solvent” Polymer, 48, 2619-2635, (2007). 6. M. Macchione, J. C. Jansen, and E. Drioli “Analysis of the distribution of local free
volume in Hyflon® AD membranes by photochromic probes” in preparation, not
reported.
Patent:
1. J. C. Jansen, M. Macchione, E. Drioli “Smart light-switchable Hyflon® AD membranes” submitted for patenting, not reported.
Contents
Introduction………...V
Acknowledgements………..………VII
List of papers………VIII
PART I: General introduction
Chapter 1
Membranes for gas separation
...11.1. Types of membranes... 1
1.1.1. Porous membranes ... 2
1.1.2. Non-porous membranes... 2
1.1.3. Asymmetric Membranes ... 3
1.2. Transport through polymeric membrane... 5
1.2.1. Robeson plot ... 5
1.2.2. Driving forces... 7
1.2.3. Transport through porous membranes... 8
1.2.4. Transport through non-porous membranes... 11
1.2.5. Solubility and sorption models ... 13
1.2.6. Diffusion and time lag ... 15
References... 18
Chapter 2
Perfluoropolymer membranes and free volume in polymers
...202.1. Introduction... 20
2.1.1. Chemical structure of perfluoropolymers... 20
2.1.2. Chemical-physical properties of perfluoropolymers... 22
2.2. Perfluoropolymers (PFPs) as membrane materials... 23
2.2.1. PTFE ... 24
2.2.2. Amorphous glassy PFPs for dense membranes... 25
2.3. Gas and vapor transport in amorphous PFPs... 27
2.5. Methods to determine FV... 30
2.5.1. Positron Annihilation Lifetime Spectroscopy (PALS) ... 31
2.5.2. 129Xe Nuclear Magnetic Resonance (129Xe NMR)...32
2.5.3. Inverse Gas Chromatography (IGC)... 33
2.5.4. Photochromic probe technique... 35
2.5.5. Spin probe technique ... 35
2.5.6. The electrochromic probe technique ... 36
References... 37
Chapter 3
Photochromism
...403.1. Introduction and a brief historical survey... 40
3.1.1. Mechanisms of photoreactions ... 41
3.1.2. Photochromic compounds ... 42
3.2. Photochemistry of Azobenzene... 44
3.3. Azobenzene in polymer films ... 47
3.3.1. Non-Linear Optics (NLO)... 48
3.3.2. Photobiological experiments ... 49
3.3.3. Photochromic probes to measure the distribution of local free volume in films... 50
3.4. Photo-induced switching of macroscopic properties with azobenzene ... 51
3.4.1. Change of gas permeation by photoinduced switching of zeolite-azobenzene membranes...52
3.4.2. Change of gas permeation by photoinduced switching of polymer-azobenzene membranes...53
References... 54
PART II: Results
Chapter 4
Influence of the residual solvent in Hyflon AD membranes
...594.1. Introduction... 59
4.1.1. Objectives of the work ... 61
4.2. Experimental ... 61
4.2.1. Materials... 61
4.2.2. Membrane preparation... 62
4.2.3. Gravimetric measurements... 63
4.2.4. Differential Scanning Calorimetry ... 63
4.2.5. 1H High Resolution Magic Angle Spinning Nuclear Magnetic Resonance (1H HRMAS NMR)………63
4.2.6. Mechanical testing………..64
4.2.8. Gas permeation measurements... 65
4.2.9. Solubility and diffusion coefficient ... 68
4.2.10. Modeling of transport properties. ... 69
4.2.10.1. Generation and equilibration of polymer structures. ... 69
4.2.10.2. Generation and equilibration of polymer structures. ... 71
4.2.10.3. Theoretical calculation of diffusion and solubility coefficients with the TST... 72
4.3. Results and discussion ... 73
4.3.1. Quantitative analysis of the residual solvent... 73
4.3.2. Density... 75
4.3.3. Influence of the residual solvent on the thermal properties. ... 75
4.3.4. Influence of the solvent on the mechanical properties. ... 79
4.3.5. Influence of residual solvent on gas permeation. ... 80
4.3.6. Gas diffusion - experimental... 83
4.3.7. Gas diffusion - simulations... 85
4.3.8. Gas solubility - experimental... 86
4.3.9. Gas solubility - simulations. ... 87
4.3.10. Solid-state NMR spectroscopy... 88
References... 90
Chapter 5
Analysis of the distribution of local free volume in Hyflon
®AD membranes
by photochromic probes.
...955.1. Introduction... 95
5.1.1. Theoretical background of the photochromic probe method ... 96
5.1.2. Perfluorinated polymers and free volume ... 96
5.2. Experimental section ... 97
5.2.1. Materials... 97
5.2.2. Membrane preparation... 98
5.2.3. UV-Visible characterization... 100
5.3. Results and discussion ... 101
5.3.1. Fractional Free Volume (FFV) by the group contribution method... 101
5.3.2. Membrane preparation and phase diagram... 103
5.3.3. Progress of the photoisomerization reaction... 104
5.3.4. Determination of molar absorption coefficients... 105
5.3.5. Determination of the total volume of photochromic molecules... 106
5.3.6. Determination of local free volume distribution ... 107
5.4. Conclusions... 108
References... 110
Chapter 6
Smart light-switchable Hyflon
®AD membranes
... 1126.1. Introduction... 112
6.2.1.1 Phase diagram... 113
6.2.1.2 Preparation of reference membranes ... 113
6.2.2 Photoisomerization and spectroscopic analysis... 114
6.2.3 Permeation measurements... 114
6.3. Results and discussion…….………...115
6.3.1 Photochromic membrane preparation ... 115
6.3.2 Photoisomerization and spectroscopic analysis... 115
6.3.3 Permeation measurements... 117
6.3.3.1 Photochromic membranes of Hyflon® AD60X ... 117
6.3.3.2 Effect of photoisomerization on gas transport...118
6.3.3.3 Diffusion and solubility of AZB containing Hyflon® AD60X membrane ... 121
6.3.3.4 Influence of the solvent... 125
6.3.3.5 Influence of the polymer... 127
References... 128
Summary………..131
Symbols and abbreviations………..………..134
PART I
1.
Membranes for gas separation
1.1. Types of membranesmembrane may be defined as a permselective barrier between two homogeneous phases. Based on structure and materials, membranes can be classified in several categories: porous or dense, symmetric or asymmetric, integral or composite and almost any combination of these.
a b
c
Figure 1.1. Schematic representation of the structure of a) an asymmetric porous membrane with interconnected pores, b) a dense membrane with closed pores and c) an asymmetric membrane with a dense skin layer and a porous support.
1.1.1. Porous membranes
A porous membrane is a rigid, highly voided structure with randomly distributed inter-connected pores, see Figure 1.1a.
The separation of molecules by porous membranes is mainly a function of the permeate character and the membrane properties like the pore size and pore size distribution. A porous membrane is very similar in its structure and function to a conventional filter.
In general, only those molecules or particles that differ considerably in size can be separated effectively by microporous membranes. Porous membranes for gas separation can exhibit very high levels of flux but provide for low separation and selectivity. Microporous membranes are characterized by the average pore diameter d, the membrane porosity
ε
(the void fraction of the total membrane), and the tortuosity of the membraneτ
.There are several ways to prepare porous polymeric membranes, such as, sintering, stretching, track etching and phase separation. In the latter case, the final morphology of the obtained membrane will vary greatly, depending on the properties of materials and the process conditions utilized.
1.1.2. Non-porous membranes
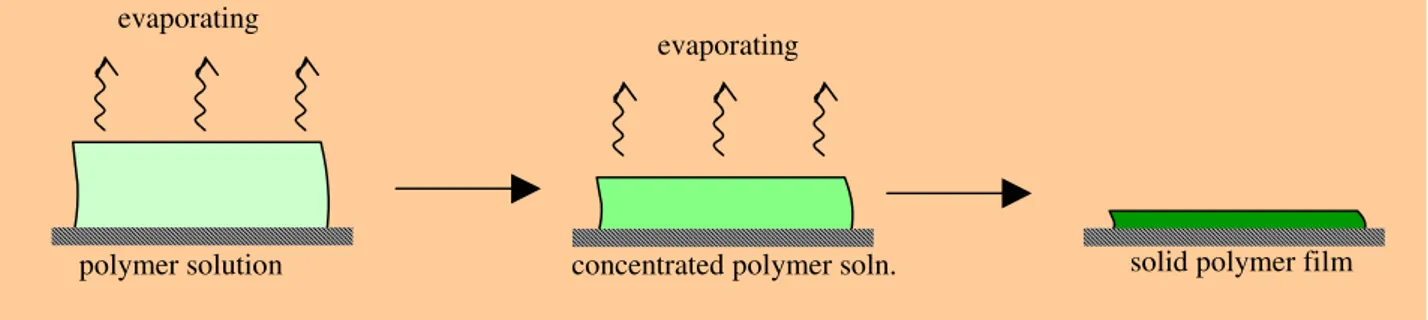
Non-porous or dense membranes provide high selectivity or separation of gases but the rates of the transport of gases are usually low. An important property of dense membranes is that even permeants of similar size may be separated if their solubility in the membrane differs significantly. Dense membranes usually can be prepared by melt-processing of the polymer powder at an opportune pressure and at a temperature above the glassy transition temperature, Tg, of the polymer. An easier alternative procedure to produce dense membranes is the solvent evaporation from a casting solution containing the solvent and the polymer, as shown in Figure 1.2.
Figure 1.2. Schematic representation of the preparation of a dense membrane by solvent evaporation.
1.1.3. Asymmetric Membranes
Asymmetric membranes, Figure 1.1c, consist of two structurally distinct layers, one of which is a thin, dense (or nearly dense!!), selective skin or barrier layer and the other a thick, porous matrix whose main function is to provide a physical support for the thin skin.
Two general classes of asymmetric membranes are universally recognized: integrally skinned and thin film composite types.
Since the first integrally skinned cellulose acetate membranes prepared by Loeb and Sourirajan’s method [1], dry-wet casting is the most widely used preparation method for asymmetric membranes of nearly any kind of (soluble) polymer, having either a dense or a porous top layer. Since Loeb and Sourirajan’s discovery an endless number of papers and books has been published, covering nearly every aspect of the dry-wet phase inversion process, the thermodynamic and kinetic factors involved and the morphologies that can be obtained, both by experimental and by theoretical studies [2-6].
An interesting alternative is the dry phase inversion process. Although the literature reports the formation of isotropic porous structures by this process [7,8], under the right conditions it is possible to obtain skinned asymmetric membranes.
This method offers several advantages compared to the traditional ‘wet’ immersion precipitation process, such as the simplicity of the method and the absence of a coagulation bath. Instead of using a coagulation bath, the polymer is dissolved in a mixture of volatile solvent and less volatile nonsolvent. Upon evaporation of the solvent from the cast film the increasing nonsolvent concentration induces phase inversion of the polymer solution into a polymer-rich and a polymer-poor phase.
polymer solution concentrated polymer soln. solid polymer film
evaporating
solvent. evaporating
Further evaporation of the solvent will lead to an increase of the concentration and to vitrification of the polymer. A vitrified but still plasticized polymer cannot be separated into a polymer-rich and a polymer-poor phase [9-11], so if the evaporation is sufficiently fast and the time scale of polymer vitrification at the air-cast film interface is shorter than that of pore nucleation, then a dense skin will result. Further drying of the film occurs by relatively slow diffusion of solvent through the vitrified skin.
Therefore nucleation and pore growth can still occur in the underlying film and finally a porous substructure and a dense skin will be formed. The evaporation process for a typical ternary-casting system, consisting of polymer/solvent/nonsolvent used for the preparation of membrane made by dry/wet phase inversion, is described by the phase diagram, (Figure 1.3.). The binodal curve delimitates the two-phase region, namely the polymer-rich and the polymer-lean phases. Their composition is given by the tie lines. The spinodal curve represents the line where all possible fluctuations in terms of phase separation can occur and that lead to instability within the system. The region between the binodal and spinodal corresponds to a metastable composition where phase separation by nucleation and growth takes place. Therefore, the membrane morphology and transport properties can be controlled by the choice and concentration of the nonsolvent in the casting solution [11] and by the temperature and air circulation during the casting process [12].
Figure 1.3. Schematic representation of the ternary phase diagram and the determination of the binodal demixing curve by alternating addition of nonsolvent (cloud point, ○) and
Polymer Solvent Nonsolvent 0 0 0 100 100 100
= cloud point (solvent addition) = clearing point (nonsolvent addition) Starting solution Polymer rich phase
Polymer poor phase
Binodal demixing curve
Spinodal
Tie line
1.2. Transport through polymeric membranes
In many processes, including those in nature, transport proceeds via diffusion rather than convection. Substances diffuse spontaneously from places with a high chemical potential to those where the chemical potential is lower. The permeability of a gas through an elastomeric and a glassy material may differ by more than five orders of magnitude, despite both materials being non-porous. This difference arises from large differences in segmental motion which is very restricted in the glassy state. The presence of crystallites can further reduce the mobility. A factor that enhances segmental mobility, or chain mobility in general, is the presence of low molecular weight penetrants. Increasing concentrations of penetrants inside the polymeric membrane generally leads to an increase in the chain mobility and consequently to an increase in permeability. The concentration of penetrant inside the polymeric membrane is determined mainly by the affinity between the penetrant and the polymer. In gas separation there is usually hardly any interaction between the gas molecules and the membrane material and the gas concentration in the membrane is very low. The gas molecules must diffuse through a rigid membrane structure with the state of the polymer being hardly affected by their presence. Only CO2 at high pressure is often a strong
plasticizer. Gas separation is possible even with two extreme types of membrane: porous and non-porous. The transport mechanisms through these two types of membranes, however, are completely different.
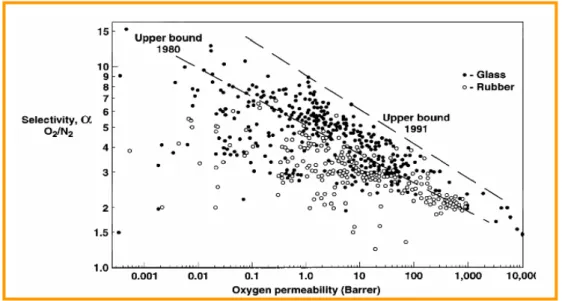
1.2.1. Robeson plot
A well-known empirical rule is that more permeable polymers are, statistically, less permselective and vice versa. Unfortunately, this “tradeoff” behavior of the transport parameters has not received a comprehensive theoretical explanation. This observation was made by many authors as a result of the examination of numerous permeation parameters of different gas/polymer systems in the form of tables or plots of permeability versus permselectivity for various gas pairs Mi and Mj [14,15]. However, the most detailed and comprehensive analysis of this regularity was given by Robeson [16], who presented plots of log Pi versus log
α
ij for six simple gases and several hundred polymers. A potential attractiveness of a polymer as the membrane material is determined by the position of the point (i.e. the combination ofα
ij and Pi values) on such a graph. It was shown that thetransport parameters
α
ij and Pi form a cloud on this diagram which is located below a so-called upper bound, which is a line drawn through the points corresponding to the best achieved combination ofα
ij and Pi values. According to Robeson, above the upper bound, virtually no values exist. The closeness of a point to the upper bound line is regarded as a measure of how attractive the polymer is for application as a membrane material. From a practical point of view, it is quite desirable to find polymers that would exhibit both high permeability Pi and permselectivityα
ij , that is to go above and to the right of the upper bound line. In fact, the efforts of synthetic chemists and physical chemists in membrane material science of the last decade are directed towards achieving this objective.Figure 1.4 illustrates the permeability-permselectivity diagram for the O2/N2 pair showing
the dynamics of data accumulation for different glassy and rubbery polymers. Since the first demonstration of the existence of the upper bound line in 1980 the synthesis and investigation of novel polymers has continuously moved this line upward in later years.
Figure 1.4. The dynamics of accumulation of the transport parameters for permeability of glassy polymers with respect to oxygen and nitrogen.
However, there is no rational basis to believe that it will be the same in the future due to the possible appearance of novel polymers with improved transport properties. On the other hand, there is no doubt that the position of the clouds in permeability/permselectivity diagrams for every gas pair Mi and Mj is unique and related to parameters of the gas molecules.
1.2.2. Driving forces
The starting point for the mathematical description of permeation in all membranes is the proposition, solidly based in thermodynamics, that the driving forces of pressure, temperature concentration and electromotive force are interrelated and that the overall driving force producing movement of a permeant, i, is the gradient in its chemical potential,
µ
i. Thus the flux Ji (g/cm2s) across the membrane is described by the simple equation:Ji = ci vi = ci Ui
dx
dµi (1.1)
where dµi/dx is the gradient in chemical potential of component i and Ui is a coefficient of proportionality linking the chemical potential driving force dµi/dx with the velocity of component i, vi. When this velocity is multiplied by the concentration of component i molecules, ci, the result is the flux of component i. All the common driving forces, such as gradients of concentration, pressure, temperature and electromotive force, can be reduced to a chemical potential gradient, and their effect on flux expressed by this equation. This approach is extremely useful, because many processes involve more than one driving force.
If we consider driving forces generated by concentration and pressure gradients, the chemical potential is written as:
dµi = RT dln (γini) + νi dp (1.2)
where ni is the mole fraction (mol/mol) of component i, γi is the activity coefficient linking concentration with activity, p is the pressure and νi is the partial molar volume of component i. In incompressible phases, such as a liquid or a solid membrane, volume does not change appreciably with pressure. Integrating equation (1.2) with respect to concentration and pressure then gives:
µi = µi° + RT ln (γini) + νi (p-pi°) (1.3) where µi° is the chemical potential of pure i at a reference pressure pi°.
In compressible gases, the molar volume changes with pressure; using the ideal gas laws and integrating equation (1.2) then gives:
µI = µI° + RT ln (γini) + RT ln 0 i p p (1.4)
A number of assumptions must be made to define any model of permeation. Usually, the first assumption is that the fluids on either side of the membrane are in equilibrium with the membrane material at the interface. This means that there is a continuous gradient in chemical potential from one side of the membrane to the other. It is implicit in this assumption that the rates of absorption and desorption at the membrane interface are much higher than the rate of diffusion through the membrane. This appears to be the case in almost all membrane processes. The second assumption concerns the way this chemical potential across the membrane is expressed within the membrane.
The mostly widely used solution-diffusion model assumes that the pressure within a membrane is uniform and that the chemical potential gradient of a permeant across the membrane is represented only as a concentration gradient.
On the contrary the pore-flow model assumes that the permeant concentration within a membrane is uniform and that the chemical potential gradient across the membrane is represented only as a pressure gradient.
1.2.3. Transport through porous membranes
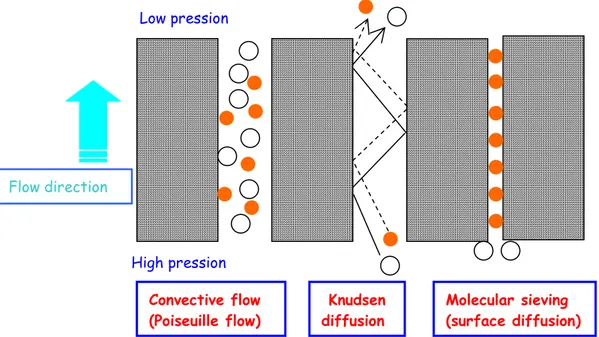
Porous membranes consist of a polymeric matrix in which pores within the range of 2 nm to 10 µm are present. Different mechanisms may be involved in the transport of gases across a porous membrane. Figure 1.5 gives a schematic representation of the mechanisms for the permeation of gases through porous membranes.
For light gases, the permeation of gas through porous membranes consists of Knudsen diffusion and Poiseuille flow. The proportions of Knudsen to Poiseuille flow are governed by the ratio of the pore radius (r) to the mean free path (λ) of the gas molecules.
(
)
M RT P 2 2 3η π λ = (1.5)where η is the viscosity of the gas, R the universal gas constant, T the temperature, M the molecular weight of the gas molecule and P the permeate pressure.
If λ/r«1, viscous or Poiseuille flow (Gvis) predominates and the gas flux trough the pore is described by the following equation:
RT L P P r Gvis η 16 ) ( 1 2 2 − = (1.6)
where r is the pore radius, P1 the partial pressure of the gas on the feed side, P2 the partial pressure on the permeate side, and L the pore length.
Figure 1.5 Schematic representation of possible transport mechanisms of light gases in porous
membranes.
In Knudsen flow r/λ is much less than one, then there are more collisions with the pore walls than with other molecules. At every collisions with the pore walls the gas molecules are momentarily absorbed and then reflected in a random direction. As there are less collisions among molecules than with the pore walls, each molecule will move independent from the others. Hence, the separation of a gas mixture is achieved because different gas
Convective flow (Poiseuille flow) Knudsen diffusion Molecular sieving (surface diffusion) Flow direction Low pression High pression
species move at different velocities. The molecular flow of the gas (Gmol) in such a case is described by the expression:
) 2 ( 3 ) ( 8 1 2 MRT L P P r Gmol
π
− = (1.7)where M is the molecular weight of the gas. For Knudsen flow, the selectivity ratio, aij, or the separation factor for binary gas mixtures is determined exclusively by the square root of the ratio of the molecular weights:
i j j i j i ij M M M RT M RT G G a = = = ) 3 / ( ) 3 / ( (1.8)
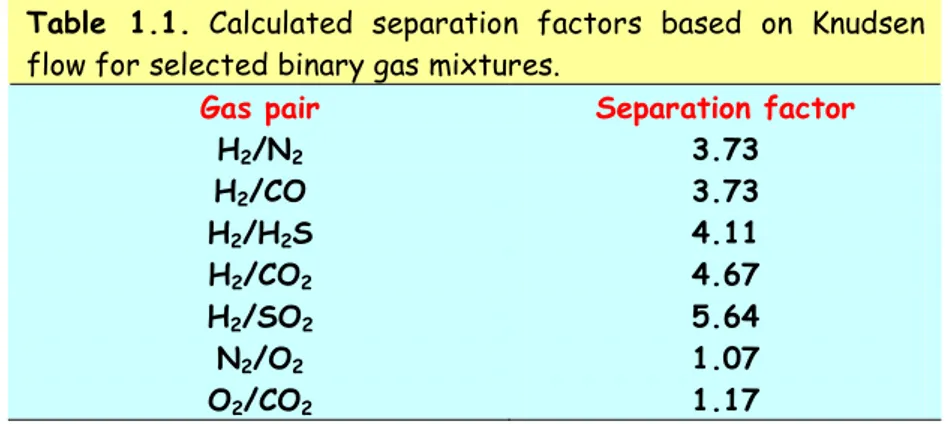
Knudsen separation can be achieved with membranes having pores sizes smaller than about 50 nm. Based on Knudsen flow, separation factors for several gas pairs have been calculated and they represent ideal separation factors. Table 1.1 presents the ideal separation factors for various pairs of gases. The actual separation factor, however, is found to be smaller due to the back diffusion, to non-separative diffusion, concentration polarization on the feed or on the permeate side and the occurrence of viscous flow in larger pores.
Table 1.1. Calculated separation factors based on Knudsen flow for selected binary gas mixtures.
Gas pair Separation factor
H2/N2 3.73 H2/CO 3.73 H2/H2S 4.11 H2/CO2 4.67 H2/SO2 5.64 N2/O2 1.07 O2/CO2 1.17
In order to function as a molecular sieve, membranes must have pore diameters that are in between those of the gas molecules to be separated. Separation factors greater than 10 should be achievable as the pores become smaller than about 0.5 nm. If the membrane has pore sizes between the diameter of the smaller and the larger gas molecules, then only the
smaller molecule can permeate and a very high separation would be achieved [13]. However the pore size in polymeric membranes is usually larger and molecular sieving mechanism generally occurs only in zeolite and carbon membranes. In practical situations, there will be a distribution of pore sizes in polymeric membrane, and thus the gas permeability is actually influenced by a combination of transport mechanisms.
1.2.4. Transport through non-porous membranes
When the sizes of molecules are in the same order of magnitude, as with oxygen and nitrogen or hexane and heptane, porous membranes cannot effect a separation. In this case nonporous membranes must be used. However, the term nonporous is rather ambiguous because pores are present on a molecular level in order to allow transport even in such membranes. The existence of these dynamic molecular pores can be adequately described in terms of free volume. Fick’s law is the simplest description of gas diffusion through a non-porous structure: x c D J
δ
δ
− = (1.9)where J is the flow rate through the membrane, D is the diffusion coefficient and the driving force
δ
c/δ
x is the concentration gradient across the membrane. Under steady state conditions this equation can be integrated to give:l c c D
J = ( 0− l) (1.10)
where c0 and cl are the concentrations in the membrane on the upstream side and downstream side, respectively. The quantity l is the thickness of the membrane.
The concentrations are related to the partial pressure by Henry’s law which states that a linear relationship exists between the concentration inside the membrane and the pressure of gas outside the membrane:
where S is the solubility coefficient. Combining the previous two equations gives: l p p DS J = ( 0− l) (1.12)
An equation which is generally used for the description of gas permeation trough membranes. The product of the diffusion coefficient D (cm2/sec) and the solubility coefficient S (cm3STP/cm3bar) is called the permability coefficient P:
P = DS (1.13)
Solubility is a thermodynamic parameter and involves both an enthalpic aspect (interaction between permeant and matrix) and an entropic aspect (maximum degree of freedom and optimal distribution of the space), in other words it gives a measure of the amount of penetrant sorbed by the membrane under equilibrium conditions. In contrast, the diffusivity is a kinetic parameter which indicates how fast a penetrant is transported through the membrane. The pure or ideal gas selectivity,
α
, is a measure of the potential separation characteristics of the membrane material. It is defined as the ratio of the permeability coefficients of pure gases A and B:α
A/B = PA/PB (1.14)Considering Eq. (1.13), the selectivity can be also expressed by:
α
A/B =(DA/DB) (SA/SB) (1.15)The selectivity is clearly the product of two contributions. The first is the ratio of the diffusion coefficients and is often called the mobility or diffusivity selectivity; the second contribution is the sorption selectivity or solubility selectivity and reflects the relative sorption of the gases in the polymer matrix. Equations (1.13)-(1.15) define the three fundamental transport parameters in a dense polymeric membrane: permeability, solubility and diffusivity. If the gas solubility is determined independently, for instance by sorption
permeation data. Alternatively, measurement of P and D allows the calculation of the solubility of the gas in the polymer matrix
1.2.5. Solubility and sorption models
Solubility of gases in polymers has been of continuous experimental and theoretical interest because gas and vapor separation membranes are based on the so-called solution– diffusion mechanism, according to which thermodynamic parameters of gas sorption determine the mass transfer driving force. The transport of penetrant through a polymer film is commonly described by a three-step solution-diffusion process, characterized by absorption of the gas at the polymer-gas interface at the feed side, followed by diffusion of the dissolved species across the membrane and desorption of the gas species from the polymer-gas interface at the low pressure side. The first important factor is thus the sorption of the gas at the feed side, which depends on the solubility of the specific gas in the polymer matrix. The solubility of light gases in polymers is generally low (< 0.2 % by volume) and it is assumed that the gas diffusion coefficient is constant.
Such cases can be considered as ideal systems where Fick’s law is obeyed. On the other hand, the solubility of organic liquids (and vapours) can be relatively high and the diffusion coefficient is now assumed to be concentration-dependent.
For ideal systems, where the solubility is independent of the concentration (S = constant), the sorption isotherm is linear (Henry’s law), i.e. the concentration, c, inside the polymer is proportional to the applied pressure, P (c = Sp), see Figure 1.6. This behaviour is normally observed with gases in elastomers. In materials with a limited sorption capacity, for example in zeolites, the sorption isotherm is generally curved (Langmuir sorption). This process dominates when a permanent gas is absorbed in specific sites at high pressure. The concentration of the gas reaches a saturation level (S has an asymptotic maximum). On the contrary, in the case of non-ideal system, the solubility increases continuously with the pressure (Flory-Huggins model, Figure 1.7). Such a behaviour represents the tendency of the penetrant to form clusters, i.e. the penetrant becomes a plasticizer for the polymer.
The dual mode sorption model is the most common for the glassy polymers and exists only in the glassy phase. According to this model, it is assumed that two sorption mechanisms occur simultaneously, i.e. sorption according to Henry’s law and sorption via
Langmuir type, Figure 1.6. At low pressure, the dual mode curve sorption approaches linearity and the solubility can be considered constant as in the case of Henry sorption.
From a physical point of view, however, it is difficult to understand the existence of two different types of sorbed gas molecules.
Figure 1.6 Typical isotherm plots of gas concentration versus pressure.
Figure 1.7 Flory-Huggins isotherm.
Usually, in the case of dual mode sorption, the concentration of the penetrant in the membrane is given by the following equation:
bP bP c P K C h d + + = 1 ' (1.16) Pressure c Henry Langmuir Dual mode c Pressure
where Kd (cm3 (STP) cm-3 bar-1) is the Henry coefficient, c’h (cm3 (STP) cm-3) is the capacity of saturation in the cavities of the Langmuir isotherm and b (bar-1) is the hole affinity constant.
1.2.6. Diffusion and time lag
The overall transport across the membrane depends on the penetrant solubility but also on its diffusion coefficient, as already illustrated with Eq. 1.13. A common procedure to determine the diffusion coefficient by permeation experiments is the time lag method, based on the penetration theory. If a penetrant-free membrane is exposed to the penetrant at the feed side at t=0 and the penetrant concentration is kept very low at the permeate side, then the total amount of penetrant, Qt, passing through the membrane in time t is given by [17]:
∑
∞ ⋅ ⋅ ⋅ − − − − ⋅ = ⋅ l n i t l t n D n l t D c l Q 2 2 2 2 2 exp ) 1 ( 2 6 1π
π
(1.17)in which ci is the penetrant concentration at the membrane interface at the feed side and l is the membrane thickness. Physically this equation represents the following process, which is schematically displayed in Figure 1.8 and Figure 1.9. In the absence of any significant transport resistance at the feed side the gas reaches nearly instantaneously an equilibrium concentration in the membrane just at the interface (c1). If the membrane has been carefully evacuated before, the penetrant concentration at that stage is still zero in the rest of the membrane cross section. This is schematically displayed in Figure 1.8. In the subsequent penetration phase the gas gradually diffuses into the membrane and a concave concentration profile is established (red curves). In this phase no permeation occurs because the penetrant concentration at the permeate side is still zero and the permeate pressure remains constant, see Figure 1.9. In the transition stage, as soon as the fastest molecules reach the permeate side, they desorb at the membrane-permeate interface and the permeate pressure gradually starts rising (blue curves in Figure 1.8 and transient zone in Figure 1.9) until a linear concentration profile is established. In the final stage, the steady state situation, a linear concentration profile is present in the membrane and the pressure increase rate in the permeate volume is constant (green curves in Figure 1.8). The penetrant concentration in the
membrane at the interface at the permeate side is in equilibrium with the gas pressure in the permeate volume. In practical experiments this pressure is usually very low and negligible compared to the feed pressure. This model, which assumes a pressure-independent solubility and a concentration independent diffusivity, is generally valid for light gases in both glassy and rubbery polymers up to moderately high pressures.
At long times the exponential term in Eq. (1.17) approaches to zero and Eq. (1.17) reduces to: − ⋅ = D l t l c D Q i t 6 2 (1.18)
A plot of Qt versus time describes a straight line which intersects the time axis at t =
l2/6D, defined as the time lag,
Θ
.D l 6 2 = Θ (1.19)
In a constant volume setup the amount Q is directly proportional to the permeate pressure. The time lag can be obtained by linear extrapolation of the steady state pressure increase curve to the time axis or to the starting pressure (Figure 1.9). Knowing the membrane thickness, the diffusion coefficient can then be obtained from Eq. (1.19) and subsequently the solubility can be obtained from the steady state permeation and Eq. (1.13): S = P/D.
Figure 1.8 Scheme of the concentration profile of the gas in a non-porous membrane after the first exposure. Difference between P1 and P2 is usually larger but is underestimated here for clarity.
Figure 1.9 Typical time lag experiment in which the pressure of a fixed permeate volume is
measured as a function of time from the first exposure of the membrane to the gas.
Time lag of water vapour in sulfonated PEEKWC
0 0.5 1 1.5 2 2.5 3 3.5 0 200 400 600 800 1000 1200 Time (s) P er m et e p re ss u re ( m b ar )
Θ
p1 p2 Permeation time C1 C2 0 Feed Permeate 3)Steady state 2) Transient state 1) Penetration state Penetration Transient Steady stateReferences
1. S. Loeb, and S. Sourirajan, Sea water demineralization by means of an osmotic membrane, Saline Water Conversion-II, Adv. Chem., 1963, 28, 117.
2. A.J. Reuvers, J.W.A. van den Berg and C.A. Smolders, Formation of membranes by means of immersion precipitation. Part. I. A model to describe mass transfer during immersion precipitation, J. Membrane Sci., 1987, 34, 45.
3. A.J. Reuvers and C.A. Smolders, Formation of membranes by means of immersion precipitation. Part. II. The mechanism of formation of membranes prepared from the system cellulose acetate-acetone-water, J. Membrane Sci., 1987, 34, 67.
4. M. Mulder, Basic Principles of Membrane Technology; Kluwer, Dordrecht, The Netherlands, 1991.
5. R.E. Kesting,; A.K. Frietzsche, Polymeric Gas Separation Membranes, Wiley, New York, 1993.
6. R.E. Kesting, Synthetic Polymeric Membranes. A structural perspective, 2nd Ed., Wiley, New York, 1985.
7. H. Matsuyama, M. Tachibana, T. Maki, M. Teramoto, Light scattering study on porous membrane formation by dry-cast process., J. Appl. Polym. Sci., 2002, 86, 3205-3209. 8. T.-H. Young, J.-H. Huang, W.-Y. Chuang, Effect of evaporation temperature on the
formation of particulate membranes from crystalline polymers by dry-cast process, Eur.
Polym. J., 2002, 38, 63-72.
9. M. Wessling, M. Lidon Lopez, H. Strathmann, Accelerated plasticization of thin-film composite membranes used in gas separation, Sep. Purif. Technol., 2001, 24, 223-233. 10. H. Matsuyama, M. Teramoto and T. Uesaka, Membrane formation and structure
development by dry-cast process, J. Membrane Sci., 1997, 135, 271.
11. J.C. Jansen, M. Macchione, and E. Drioli, High flux asymmetric gas separation membranes of modified poly(ether ether ketone) prepared by the dry phase inversion technique, J. Membrane Sci., 2005, 255, 167-180.
12. M. Macchione, J.C. Jansen, and E. Drioli, The dry phase inversion technique as a tool to produce highly efficient asymmetric gas separation membranes of modified PEEK. Influence of temperature and air circulation, Desalination, 2006, 192, 132-141.
14. S. A. Stern, Gas separation processes, in: S. Loeb, P.E. Lacey (Eds.), Industrial Processing with Membranes, Elsevier, NY, 1972, p.279.
15. W. J Koros, R. T. Chern, Separation of gaseous mixtures, in: R. Y. Rousseau (Ed.), Handbook of Separation Progress Technology, Wiley, 1987.
16. L. M. Robeson, Correlation of separation factor versus permeability for polymeric membranes, J. Membr. Sci., 1991, 62, 165.
2.
Perfluoropolymer membranes and free volume
in polymers
2.1. Introductionembrane processes are receiving increasing attention in the scientific community and in industry because in many cases they offer a favorable alternative to processes that are not easy to achieve by conventional routes. In this context, membranes made with perfluorinated polymers are of particular interest because of the unique features demonstrated by these materials. In many applications fluoropolymers offer the highest protection afforded by any polymer available today, to a huge variety of chemicals, such as acids and alkalis, fuels and oils, low molecular weight esters, ethers and ketones, aliphatic and aromatic amines, and strong oxidizing substances.
Both highly hydrophobic and hydrophilic membranes have been developed from appropriate perfluoropolymers that were, in turn, obtained by copolymerizing TFE with special monomers available on an industrial scale. Highly hydrophobic films obtained from the glassy copolymers of TFE and 2,2,4-trifluoro-5 trifluoromethoxy-1,3 dioxole (Hyflon AD) exhibit properties that make them particularly well suited for use in optical applications, in the field of gas separation, and in gas-liquid contactors. Hydrophylic highly conductive proton exchange membranes obtained from the copolymer of TFE and a short-side-chain (SSC) perfluoro-sulfonylfluoride-vinylether (Hyflon Ion) find interesting application in the field of fuel cells, especially in view of the current tendency to move to high temperature operation.
2.1.1. Chemical structure of perfluoropolymers
The discovery of polytetrafluorothylene (PTFE, Figure 2.1) in 1938 by Roy Plunkett [1] at DuPont spurred the development of a wide variety of rubbery and glassy perfluoropolymers (PFPs) such as Teflon® AF by DuPont [2,3], CytopTM by Asahi Glass [4] and Hyflon® AD
by Ausimont (now Solvay Solexis)[5]. The chemical structures and selected properties of these polymers are shown in Table 2.1. For comparison, semicrystalline polytetrafluoroethylene is included in this table as well.
Figure 2.1. Modeling of the structure of polytetrafluoroethylene (PTFE).
Glassy polymers, based on copolymers of tetrafluoroethylene and 2,2-bis(trifluoromethyl)-4,5-difluoro-1,3-dioxole, can be readily dissolved in and cast from perfluorinated solvents. The large, bulky dioxole monomer hinders efficient polymer chain packing, thereby preventing crystal formation and yielding a completely amorphous polymer. Monomers used for the synthesis of fluorinated polymers can be briefly classified into two categories, 1) base monomers and 2) special monomers. The former are represented by those monomers that constitute the basic structure of modern fluoropolymers and the latter by those other monomers that add specially desired characteristics to match specialty application requirements, see Figure 2.2.
Within the scheme above, base fluoromonomers are tetrafluoroethylene (TFE), hexafluoropropylene (HFP), vinylidenefluoride (VDF), and chlorotrifluoroethylene (CTFE). Proper combination of these monomers yields homo- or copolymers with the most diverse characteristics: PTFE, FEP, fluoroelastomers, PVDF, PCTFE, and THV. In the field of films and membranes the base polymers mentioned above find wide application: just to mention some examples, films for anticorrosion (PTFE and FEP), films for protective packagings (PCTFE), microfiltration and ultrafiltration membranes (PVDF and PTFE), vapor permeable clothes and shoes (PTFE), and separators for lithium ion batteries (PVDF).
2.1.2. Chemical-physical properties of perfluoropolymers
Fluoropolymer materials are capturing greater and greater interest in industrial applications because of the remarkable combination of properties that they exhibit when compared to other polymeric materials. The most well-known property for which fluoropolymers are employed in high-demanding applications is their outstanding thermal and chemical resistance. However, the peculiar nature of the carbon–fluorine bond confers on these materials other unique physical properties (e.g., electrical, optical, and superficial) that can be valuably exploited in the most variegated fields. Perfluoropolymers represent the ultimate in resistance to hostile chemical environments and high service temperature because of the high bond energy of C–F and C–C bonds of fluorocarbons, equal to 485kJ/mol and 360kJ/mol, respectively [6].
Fluoropolymers also possess exceptional optical, electrical and surface properties [6,7] that have resulted in the commercial use of fluoropolymers in numerous areas, including the automotive, electronic, aerospace, chemical, specialty packaging and medical industries [6-8].
Table 2.1. : Structures and properties of selected perfluoropolymers, [9]
Polymer Chemical structure Density
(g/cm3) Tg [9] (°C) Permeability N2 (barrer) PTFE C C F F F F m 2.1 30 1.3 [10] Teflon® AF O O F F F3C CF3 C n C F F F F m 1.74 240 480 [11] Cytop® CF2 CF (CF2)x CF O (CF2)zCF2 (CF2)y n 2.03 108 5.0[11] Hyflon® AD O O O F F F CF3 C n C F F F m 1.92 130 24[12]
2.2. Perfluoropolymers (PFPs) as membrane materials
The discovery in the past 20 years of amorphous, solvent-processable perfluoropolymers, such as Teflon®AF, Cytop®TM and Hyflon®AD, has created new opportunities for perfluorinated materials in membrane separations. Indeed, the high gas permeability of these polymers [2,3,12], due to the great amount of free volume, combined with the usual perfluoropolymer chemical and thermal stability, makes them intriguing membrane materials for gas and vapor separations. These amorphous perfluoropolymers can be
fabricated into thin, high-flux, composite membranes while retaining the excellent chemical stability typical of fluorinated materials.
Relative to PTFE, Teflon AF is significantly less dense due to the large, rigid dioxole monomer, which obstacles efficient chain packing. The resultant open polymer structure causes Teflon AF2400 to be more than two orders of magnitude more permeable to nitrogen than PTFE. Similarly, the other amorphous perfluoropolymers are also substantially more permeable than PTFE. In addition, and perhaps most important from an applications standpoint, all three amorphous perfluoropolymer types are soluble in selected perfluorinated solvents, which renders them amenable to composite membrane fabrication via solution casting.
2.2.1. PTFE
The common statement that PTFE is a spin-off from the United States space program is an urban legend. PTFE, was discovered accidentally by Roy Plunkett of DuPont in 1938 [1].
Legend has it that, while he attempted to make a new chlorofluorocarbon (CFC) refrigerant, the perfluorethylene polymerized in its pressurized storage container (in this original chemical reaction, iron from the inside of the container acted as a catalyst.) DuPont patented it in 1941 and registered the Teflon trademark in 1944.
It was first sold commercially in 1946. By 1950, DuPont was producing over a million pounds (450 t) per year in Parkersburg, West Virginia. In 1954, french engineer Marc Grégoire created the first pan coated with Teflon non-stick resin.
PTFE is a white solid at room temperature, with a density of about 2.2 g/cm³. According to DuPont its melting point is 327 °C [6], but its properties degrade above 260 °C. PTFE is insoluble in all common solvents and not melt-processable by conventional means because of its high melting point, making it difficult to use as selective materials in commercial asymmetric hollow fibers or composite membranes where solution-casting fabrication techniques are generally used.
Since PTFE presents excellent dielectric properties, especially at high radio frequencies, it is suitable for use as an insulator in cables and connector assemblies and as a material for printed circuit boards used at microwave frequencies. Combined with its high melting temperature, this makes it the material of choice as a high-performance substitute for the
weaker and lower melting point polyethylene that is commonly used in low-cost applications. Due to its semi-crystalline structure, PTFE is mainly used for porous membrane (e.g. Gore®Tex). Indeed, Xing and co-workers used porous PTFE to reinforce SPEEK [13] and Yamaguchi used porous PTFE as a porous substrate and filled the pores with poly (vinylsulfonic acid/acrylic acid) crosslinked gel. Porous PTFE membrane were also used to reinforce Nafion membranes[14]. Indeed, the good tensile strength made it possible for a thinner composite membrane to be used in the fuel cell which improves the cell performance.
2.2.2. Amorphous glassy PFPs for dense membranes
Amorphous perfluoropolymers show glass transition temperatures (Tg) greater than room temperature [10], a thermal decomposition temperature exceeding 400°C and are highly transparent to light from far UV to near infrared. TFE–TTD copolymers, commercially known as Hyflon®AD polymers, are synthesized by free radical polymerization. Amorphous polymers of Hyflon®AD are obtained when m/n is less than about 4 (see Table 1.1); that is, when the TTD molar content is higher than about 20%.
Due to the cyclic structure and the effective steric hindrance of the side group, chain motion is severely hindered and high Tg glassy polymers result. When m = 0, as is the case with TTD homopolymer, Tg = 170°C. At increasing m/n values (decreasing TTD content), Tg decreases, see Figure 2.3, [15].
Figure 2.3. Glass transition temperature (Tg) for amorphous perfluoropolymers at various compositions
Teflon®AF is obtained by the copolymerization of perfluoro- 2,2 dimethyldioxole (PDD) with TFE. Cytop is obtained by the cyclopolymerization of perfluoro-butenylvinylether (BVE), which offers a controlled alternate structure but fixes the content of the cyclic portion of the chain to 50%, thus limiting the Tg of the polymer to 108° C.
TFE–TTD copolymers exhibit very high thermal stabilities, as shown by the weight loss at increasing temperatures obtained by TGA. One-percent weight losses are measured at temperatures as high as 400°C, demonstrating thermal stabilities typical of perfluoropolymers [15]. Two characteristics of TFE–TTD copolymers that make them very attractive for membrane preparation are their high solubilities in perfluorinated solvents and their low solution viscosities [5]. Both features allow great flexibility in the selection of proper conditions for the preparation of membranes with various structures. Moreover, low solution viscosities imply greater ease of purification. This aspect is very important, since it is often crucial in the polymer and polymeric solutions to avoid the presence of both suspended and dissolved contaminants, such as dust or dissolved organic molecules. In fact contaminants can substantially affect properties, such as light transmittance and signal attenuation of optical devices. Various procedures have been tuned to prepare membrane typologies to match application requirements. Examples of solvents used to dissolve amorphous PFPs are Galden®HT110 and Galden®HT55: perfluopolyether oils with the following structure Galden HT n m CF2 CF O CF2 O CF3 CF3 O F3C
Normal boiling points are equal to 110°C and 55°C, respectively.
Flat sheet porous and non porous symmetric membranes can be obtained by following the evaporation method [16]. Hyflon membranes can be prepared by using a Braive Instruments knife to cast a polymeric solution on glass plates with various initial thicknesses and evaporation temperatures. Flat sheet asymmetric membranes can be prepared by following the dry–wet phase inversion method [16,17].
Symmetric dense films of Hyflon AD find application as UV resistant protective films for the semiconductor industry because of their high transparency at the far-UV wavelength, where conventional nitrocellulose pellicles are degraded due to high energy absorption. In this application, transparent pellicles are used in microlithography to cover the photomask and avoid dust depositing on it and disturbing the preparation of the photoresist. The protective film puts the dust particles out of focus.
2.3. Gas and vapor transport in amorphous PFPs
Prior to the mid-1980s, there were relatively few studies of gas or vapor transport through dense fluoropolymer membranes. This was due in part to the low permeability of the existing semicrystalline fluoropolymer (PTFE), but perhaps primarily due to processing difficulties that limited their potential use as gas separation membranes [18]. Nevertheless, the first systematic report on transport in dense fluorocarbon-based polymer films was an examination of gas diffusion in PTFE, tetrafluoroethylene-hexafluoropropylene copolymer (FEP) and poly-chlorotrifluoroethyelene (PCTFE) by Brandt and Anysas [19]. These authors found anomalously low activation energies of diffusion in the fluoropolymers compared to results in hydrocarbon polymers.
They suggested this unexpected behavior might be related to pre-existing holes or microchannels frozen into the fluoropolymer films during fabrication. Pasternak et al. reported permeability, diffusion and solubility data for several gases and vapors in PTFE [20] and FEP [21]. They found that activation energies of diffusion were lower in PTFE than in polyethylene (PE), consistent with results of Brandt and Anysas. Pasternak et al. also reported that light-gas solubilities were higher in FEP than in PE, whereas the reverse was true for hydrocarbon gas and vapor. The authors recognized that compared to PE the fluoropolymers were more permeable to light gases, but much less permeable to higher-boiling hydrocarbons [21].
These results were consistent with a growing body of patent data, which indicated that fluoropolymers were excellent permeation barriers to hydrocarbon liquids and vapors and thus useful as gas tank and flexible hose liners [22-24]. In the early 1980s, Koros and coworkers [25,26] examined hydrocarbon gas and vapor transport in PTFE and FEP. The results were similar to those of Pasternak et al., but also included mixed-gas experiments
and the effects of polymer annealing. These authors found that annealing the fluoropolymers reduced both gas solubility and diffusivity, presumably due to polymer recrystallization at the annealing temperature.
Since the mid-1980s, a significant amount of research has been conducted on polymer gas separation membranes containing fluorinated functional groups.
Some of the materials investigated have included fluorinated polysulfones [27] polycarbonates [28] and polyimides [29]. In general, bulky fluorine-containing groups were added to these size-sieving, glassy polymers to inhibit chain packing and increase polymer permeability. However, it is in PFPs that the unique nature of the carbon-fluorine bond has its greatest impact on transport properties
Hyflon AD membranes show values of permeability and selectivity to gases that make them interesting for gas separation applications.
In Table 2.2, permeability values for Teflon AF are reported for comparison with those one of Hyflon AD [18] together with the Tg values of the various polymers. Examination of these data shows that, independently of the fluoropolymer type and gas, a linear correlation exists between permeability and Tg.
Table 2.2.: Gas permeability data (expressed in Barrer) of amorphous perfluoropolymers with various glass transition temperatures
Polymer Tg (°C) P(NO2) P(CO2) P(O2) P(H2) P(CH4)
Hyflon AD80 135 77 473 194 563 49
Hyflon AD60 110 17 124 51 202 8
Hyflon AD40 91 8 64 26 _ _
Teflon AF2400 240 490 2800 990 2200 340
Teflon AF1600 160 _ _ 340 _ _
In this respect, gas permeation is often attributed to the presence of voids at the molecular scale and to their size distribution. Amorphous perfluoropolymers show an experimental density that is lower than that expected theoretically. Considering the chemical structure of amorphous perfluoropolymers, the low values of the experimental density can be ascribed, at least qualitatively, to differences in chain packing resulting from the low chain mobility and steric hindrance offered by the large dioxole groups. In other words, the high chain stiffness leads to difficulties in the close packing of chain segments and thus to “nanovoids”.
Since, in amorphous perfluoropolymers, Tg is mainly related to the macromolecular chain stiffness, which controls the dimension of nanosize holes, it follows that the higher the Tg value, the higher is gas permeation.
2.4. Free Volume in polymers
Free volume (FV) is an extremely important characteristic of polymer materials which influences their properties, such as viscosity, diffusivity and permeability and, to some extent, the parameters of sorption thermodynamics and mechanical behavior. Because of its influence on transport properties, the concept of FV is extremely important for membrane science and technology. Some excellent reviews have been written by Yampolskii [30-32].
However, in contrast to other properties of polymers, free volume can be regarded as a complex physical object within polymers that can be characterized by size and size distribution of microcavities or free volume elements (FVEs) that form it, by topology and architecture of its nanostructure. Being initially formulated for the liquid state [33], it was extended to amorphous polymers that are either above or below the glass transition temperature (Tg) [34-36]. At temperatures above Tg one can distinguish in the free volume the “hole” component, characterized by zero energy expenditure for redistribution of FVE, and the interstitial component that becomes accessible to transport owing to energy fluctuations greater than kT. At temperatures below Tg, yet another component of the free volume appears corresponding to the nonequilibrium thermodynamic state of glassy polymers [35,36].
Elaboration of additive incremental (group contribution) methods for inclusion of the effect of the chemical structure of the polymers on their properties became an important step towards establishment of relations between the free volume using the van der Waals atomic radii and particular concepts of chain packing in polymers [37].
2.4.1. Definition of free volume
The thermal movement of molecules in the liquid phase is impossible without random fluctuation of the local density. Molecules in liquids perform irregular oscillations around their equilibrium positions. The average “local” lifetime,
τ
, of a molecule coincides with themean fluctuation time of the potential field in its closest neighborhood. In liquids with low viscosities this lifetime has the order of 10-11 sec. The lifetime
τ
increases with the viscosity of the liquid. The same concept holds for rubbery polymers; however, here kinetic segments play the role of individual molecules in low-molecular-mass liquid compounds. As the size of the kinetic segments is relatively large, the lifetimesτ
in rubbers should be much longer.In glassy polymers, where all of the segmental mobility is frozen, the lifetimes
τ
become infinitely long, and so FVEs should be viewed as areas with reduced local density imbedded in the frozen matrix.The simplest assumption that can be made regarding free volume is based on its representation as the difference between the total or specific volumes of polymers (Vsp), which can be defined as the reciprocal density, and the occupied volume, Vocc:
Vf = Vsp-Vocc (2.1)
For application of this equation, there should be ways to calculate Vocc. An approach to find the occupied volume of polymers was proposed by Bondi [37], who suggested calculation of the van der Waals volume (Vw) of repeat units of polymers by using the tabulated increments in Vwfor smaller groups. He postulated that Vocc= 1.3 Vw.. This method
is very simple and so became popular for finding the Bondi free volume or fractional free volume (FFV) = Vf/Vsp and for drawing various correlations between the transport parameters (D and P values) with Vf and FFV.
2.5. Methods to determine FV
For several reasons, the previous approach to determine the FFV in the polymers seems to be unsatisfactory and can serve only for very rough estimates. Much attention was thus drawn to the problem of experimental evaluation of free volume in polymers. Attempts to characterize free volume resulted in development of various methods that are often united by the term “probe methods”. A common feature of these methods is that probes of different nature and size (atoms or molecules) are introduced into a polymer and observation of their