Anthropometric Profiles and Somatotypes of
Female Volleyball and Beach Volleyball Players
Perfiles Antropométricos y Somatotipos de Jugadoras de Voleibol Femenino y Voleibol de Playa
Ruggero D’Anastasio1,2; Andrea Milivojevic3; Jacopo Cilli4; Iuri Icaro3 & Joan Viciano1
D’ANASTASIO, R.; MILIVOJEVIC, A.; CILLI, J.; ICARO, I. & VICIANO, J. Anthropometric profiles and somatotypes of female
volleyball and beach volleyball players. Int. J. Morphol., 37(4):1480-1485, 2019.
SUMMARY: The aim was to compare anthropometric profiles, body composition, and somatotypes of female volleyball players
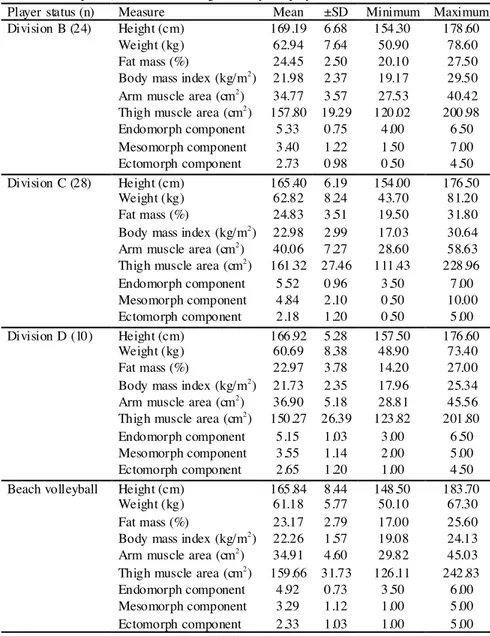
grouped according to player status (National League Divisions) and function. The study assessed 62 volleyball players and 12 beach volleyball players (mean age, 23.58, s = 7.74 years). Anthropometric measures included height, body mass, body circumferences and diameters, adipose skinfold thickness. Data processing using a dietetic software package provided body mass index, fat mass percentage, arm muscular area, thigh muscular area, and somatotype. Statistical analysis was performed using SPSS Statistics version 22. Division B volleyball players were taller than those in Division C (169.19, s = 6.68 cm vs. 165.40, s = 6.19 cm; P <0.05), but showed lower arm muscular area (34.77, s = 3.57 cm2 vs. 40.06, s = 7.27 cm2; p <0.05) and mesomorphy (3.40, s = 1.21 vs. 4.84, s = 2.10; P <0.05). For player functions, blockers were the tallest (172.38, s = 4.18 cm; P <0.05) and showed the highest ectomorphy (3.08, s = 1.02; P <0.05), setters showed the highest fat mass percentage (26.38 %, s = 2.99 %: P <0.05), and ‘liberos’ showed a more compact mesomorphy (5.46, s = 2.13) and low ectomorphy (1.58, s = 0.90). The anthropometric data showed few significant differences between the volleyball Divisions, suggesting that promotion up the Divisions is due to technical ability rather than physical qualities. The anthropometric profiles of the players varied according to their functions within their volleyball team.
KEY WORDS: Body composition; Team sport; Measurement.
INTRODUCTION
Volleyball is a team sport that alternates between high athletic intensity and relatively less strenuous moments during the play (González-Ravé et al., 2011). When playing, the players perform different movements (e.g., jump, dive, roll, rapid forward and lateral movements) that require strength, power, agility and speed (Lidor & Ziv, 2010). Gonzales-Rave and colleagues demonstrated that body composition has a crucial role in determining athletic per-formance in volleyball players (González-Ravé et al.).
A volleyball team has 12 players, of which 6 will be playing at any one time. These players have different functions while the game is in play (Gabbett & Georgieff, 2007), which can generally be classified as: hitters (outside and opposite), setters, blockers and ‘liberos’. The differentiation of each function requires definition of the anthropomorphic and physiological profiles relevant to each, to adequately respond to the necessary performance and tactical demands (Sheppard et al., 2009a,b).
The anthropometric profile and the somatotype characterisation of top volleyball players can provide useful information on not only the physical conditions of the athletes, but also on their potential performance in relation to the function that they have during the volleyball game (Gualdi-Russo & Zaccagni, 2001). Statistical anthropometric data are available for top volleyball players of various nationalities and ages (Gualdi-Russo & Zaccagni; Duncan
et al., 2006; Carvajal et al., 2012). However, there are fewer
data available relative to volleyball players from the lower Divisions (Nikolaidis et al., 2012; Nikolaidis, 2013) and to the best of our knowledge, there are no data relative to such non-professional Italian athletes in the literature.
The goal of the present study was to compare the anthropometric characteristics, body composition, and somatotypes across non-professional female Italian volleyball players in relation to the different Divisions their team plays in and the different functions that they have during the game. 1 Department of Medicine and Aging Sciences, State University “G. d’Annunzio”, Chieti–Pescara, Italy.
2 Associazione Sportiva Dilettantistica “Filippide Montesilvano”, Montesilvano (PE), Italy). 3 Operative Unit of Anthropology, State University “G. d’Annunzio”, Chieti–Pescara, Italy.
MATERIAL AND METHOD
The sample (N = 74) was composed of 62 volleyball players from different Divisions (Division B in the national leagues, and Divisions C and D in the regional leagues) and function (hitters: n. 27 setters: n. 10, middle blockers: n. 12, ‘liberos: n. 10, all-rounders: n. 13). To provide further comparisons, 12 beach volleyball players were also analysed. The mean age for all 74 of these athletes was 23.58, s = 7.74 years.
Volleyball is highly specialised sport discipline where each player has determined functions according to their playing position: setters are the playmaker of the team and partecipate in every phase of the game; they are involved in
blocking and defence too; hitters are intensely involved in spiking and blocking and, secondary, in defense; the middle blockers are the players that execute the most blocks; at the same time they are involved in hit and, less intensely, in dig actions; opposite players execute most of the spikes of its team but also have an important role blocking; sometimes they play a role in defence and reception; libero player is specialized in reception and defence; he plays in the back court and cannot serve, set inside of the 3 meter line, or spike. The anthropometric profile of a group of players with mixed functions through the course of the season was also defined, with these players classified into the category of ‘all-rounders’. The anthropometric measures (Table I) were taken following the International Society for the Advancement of Kinanthropometry (ISAK) recommendation. The thickness of the subcutaneous fat folds was measured using Harpenden
Player status (n) Measure Mean ±SD Minimum Maximum
Division B (24) Height (cm) 169.19 6.68 154.30 178.60
Weight (kg) 62.94 7.64 50.90 78.60
Fat mass (%) 24.45 2.50 20.10 27.50
Body mass index (kg/m2) 21.98 2.37 19.17 29.50
Arm muscle area (cm2) 34.77 3.57 27.53 40.42
Thigh muscle area (cm2
) 157.80 19.29 120.02 200.98 Endomorph component 5.33 0.75 4.00 6.50 Mesomorph component 3.40 1.22 1.50 7.00 Ectomorph component 2.73 0.98 0.50 4.50 Division C (28) Height (cm) 165.40 6.19 154.00 176.50 Weight (kg) 62.82 8.24 43.70 81.20 Fat mass (%) 24.83 3.51 19.50 31.80
Body mass index (kg/m2
) 22.98 2.99 17.03 30.64
Arm muscle area (cm2) 40.06 7.27 28.60 58.63
Thigh muscle area (cm2
) 161.32 27.46 111.43 228.96 Endomorph component 5.52 0.96 3.50 7.00 Mesomorph component 4.84 2.10 0.50 10.00 Ectomorph component 2.18 1.20 0.50 5.00 Division D (10) Height (cm) 166.92 5.28 157.50 176.60 Weight (kg) 60.69 8.38 48.90 73.40 Fat mass (%) 22.97 3.78 14.20 27.00
Body mass index (kg/m2
) 21.73 2.35 17.96 25.34
Arm muscle area (cm2) 36.90 5.18 28.81 45.56
Thigh muscle area (cm2
) 150.27 26.39 123.82 201.80
Endomorph component 5.15 1.03 3.00 6.50
Mesomorph component 3.55 1.14 2.00 5.00
Ectomorph component 2.65 1.20 1.00 4.50
Beach volleyball Height (cm) 165.84 8.44 148.50 183.70
Weight (kg) 61.18 5.77 50.10 67.30
Fat mass (%) 23.17 2.79 17.00 25.60
Body mass index (kg/m2
) 22.26 1.57 19.08 24.13
Arm muscle area (cm2) 34.91 4.60 29.82 45.03
Thigh muscle area (cm2) 159.66 31.73 126.11 242.83
Endomorph component 4.92 0.73 3.50 6.00
Mesomorph component 3.29 1.12 1.00 5.00
Ectomorph component 2.33 1.03 1.00 5.00
skinfold callipers, with an accuracy of 0.2 mm. The data were then processed to obtain the following parameters: body mass index (BMI), fat mass percentage (FM%), arm muscle area (AMA), thigh muscle area (TMA), and somatotype (Brozek et al., 1963; Heat & Carter, 1967; Jackson et al., 1980; Cagnazzo & Cagnazzo, 2009). Statistical data processing was performed using the SPSS Statistics V22.0 software (IBM). Initially, the normality of the data was determined using Kolmogorov-Smirnov tests, and the homogeneity of the variance using Levene tests. Subsequently, descriptive analysis was performed according to the volleyball Divisions (i.e., B, C, D) and the player functions.
The differences between the means for the various Divisions and player functions were analysed using non-parametric Mann–Whitney tests. Significance was set at P <0.05. Using the intraclass correlation coefficient (ICC), the differences between the means of all of the measurements collected at three different times were also analysed, to define possible intra-observer errors. The ICCs were interpreted based on the classification proposed by Fleiss (1986).
RESULTS
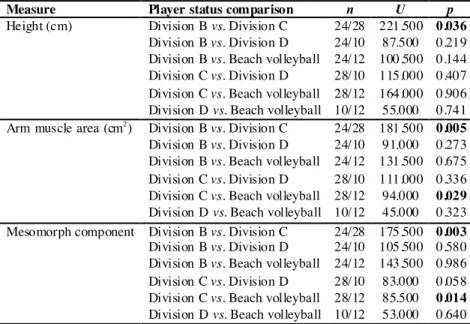
Table I shows the anthropometric and somatotype (i.e., endomorphy, mesomorphy, ectomorphy) data of the volleyball players according to the volleyball player status (i.e., Divisions B, C, D, beach volleyball). Table II gives the results of the Mann– Whitney U tests where statistically significant differences were seen between the anthropometric and somatotype measures of the volleyball players in the categories studied.
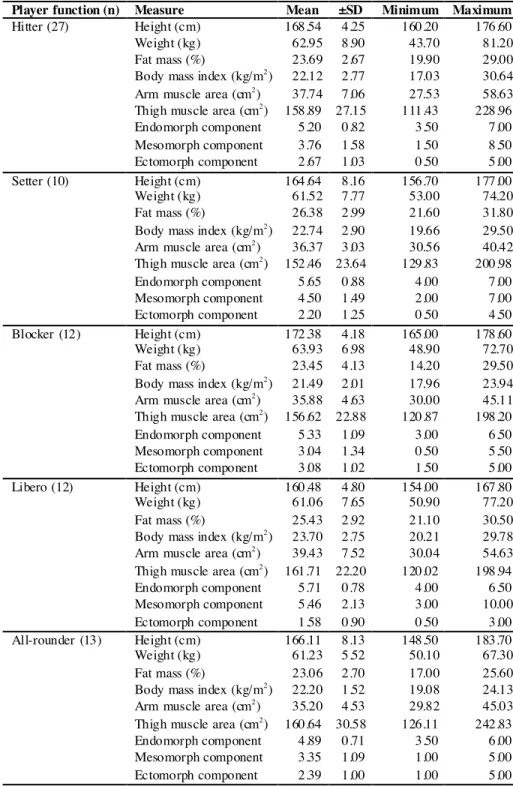
Table III gives the descriptive results of the analysis carried out on these volleyball players subdivided by their functions in the team, with the results of the Mann–Whitney U tests here given in Table IV.
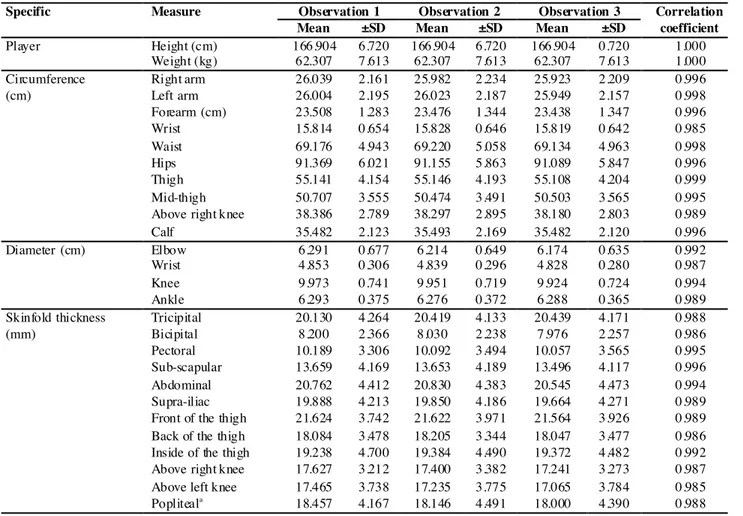
The analysis of the data reproducibility through the intraclass correlation coefficients showed a strength of agreement as defined by Fleiss of ‘very good’ for all of the measures (Table V).
DISCUSSION
In professional volleyball, each position requires specific motor skills, and these are reflected in the anthropomorphic characteristics of the players. Generally, in professional tournaments (Divisions A1, A2), the liberos and setters are the shorter athletes; furthermore, the liberos
Measure Player status comparison n U p
Height (cm) Division B vs. Division C 24/28 221.500 0.036
Division B vs. Division D 24/10 87.500 0.219
Division B vs. Beach volleyball 24/12 100.500 0.144
Division C vs. Division D 28/10 115.000 0.407
Division C vs. Beach volleyball 28/12 164.000 0.906
Division D vs. Beach volleyball 10/12 55.000 0.741
Arm muscle area (cm2) Division B vs. Division C 24/28 181.500 0.005
Division B vs. Division D 24/10 91.000 0.273
Division B vs. Beach volleyball 24/12 131.500 0.675
Division C vs. Division D 28/10 111.000 0.336
Division C vs. Beach volleyball 28/12 94.000 0.029
Division D vs. Beach volleyball 10/12 45.000 0.323
Mesomorph component Division B vs. Division C 24/28 175.500 0.003
Division B vs. Division D 24/10 105.500 0.580
Division B vs. Beach volleyball 24/12 143.500 0.986
Division C vs. Division D 28/10 83.000 0.058
Division C vs. Beach volleyball 28/12 85.500 0.014
Division D vs. Beach volleyball 10/12 53.000 0.640
are the players with lower body weight (Marques et al., 2009; Trajkovic et al., 2011; Carvajal et al.).
The volleyball players of the Italian Division B had a markedly lower height and weight than that of the compatriot elite players (Gualdi-Russo & Zaccagni). The mean heights of Italian amateur volleyball players are lower than those of Greek amateur athletes, while their mean weight is in line with what was reported for their Greek counterparts (Nikolaidis). The Italian players have higher FM% than the Greek amateur colleagues (Nikolaidis).
The anthropometric profile of the volleyball players who have different functions when playing in the team is related to the technical and tactical needs that are requested of them. Regarding to the professional volleyball players, the blockers are taller and get better blocks performance; conversely, the setters need to be faster and more agile, and therefore well muscled, dynamic players who are relatively short, are preferred for this function (Gualdi-Russo & Zaccagni; Carvajal et al.). The same trend is observed in the amateur Italian volleyball players.
The mean somatotype across the full player sample examined in the present study was 5.39, s = 0.89 - 4.07, s = 1.79 - 2.47, s = 1.13. The endomorphic component thus prevails over the other components, regardless of the Division (i.e., Divisions B, C, D) and the player function. Setters and liberos show higher mesomorphy, that is the expression of increased musculoskeletal system development.
n, number of players used in each of the comparisons; U, Mann–Whitney statistic; significance for p ≤0.05 indicated in bold.
Table II. Results of Mann–Whitney analysis (U) for evaluation of the significance (p) of the mean differences between the various levels of player status.
Player function (n) Measure Mean ±SD Minimum Maximum
Hitter (27) Height (cm) 168.54 4.25 160.20 176.60
Weight (kg) 62.95 8.90 43.70 81.20
Fat mass (%) 23.69 2.67 19.90 29.00
Body mass index (kg/m2) 22.12 2.77 17.03 30.64
Arm muscle area (cm2) 37.74 7.06 27.53 58.63
Thigh muscle area (cm2
) 158.89 27.15 111.43 228.96 Endomorph component 5.20 0.82 3.50 7.00 Mesomorph component 3.76 1.58 1.50 8.50 Ectomorph component 2.67 1.03 0.50 5.00 Setter (10) Height (cm) 164.64 8.16 156.70 177.00 Weight (kg) 61.52 7.77 53.00 74.20 Fat mass (%) 26.38 2.99 21.60 31.80
Body mass index (kg/m2
) 22.74 2.90 19.66 29.50
Arm muscle area (cm2) 36.37 3.03 30.56 40.42
Thigh muscle area (cm2
) 152.46 23.64 129.83 200.98 Endomorph component 5.65 0.88 4.00 7.00 Mesomorph component 4.50 1.49 2.00 7.00 Ectomorph component 2.20 1.25 0.50 4.50 Blocker (12) Height (cm) 172.38 4.18 165.00 178.60 Weight (kg) 63.93 6.98 48.90 72.70 Fat mass (%) 23.45 4.13 14.20 29.50
Body mass index (kg/m2
) 21.49 2.01 17.96 23.94
Arm muscle area (cm2) 35.88 4.63 30.00 45.11
Thigh muscle area (cm2
) 156.62 22.88 120.87 198.20 Endomorph component 5.33 1.09 3.00 6.50 Mesomorph component 3.04 1.34 0.50 5.50 Ectomorph component 3.08 1.02 1.50 5.00 Libero (12) Height (cm) 160.48 4.80 154.00 167.80 Weight (kg) 61.06 7.65 50.90 77.20 Fat mass (%) 25.43 2.92 21.10 30.50
Body mass index (kg/m2
) 23.70 2.75 20.21 29.78
Arm muscle area (cm2) 39.43 7.52 30.04 54.63
Thigh muscle area (cm2) 161.71 22.20 120.02 198.94
Endomorph component 5.71 0.78 4.00 6.50 Mesomorph component 5.46 2.13 3.00 10.00 Ectomorph component 1.58 0.90 0.50 3.00 All-rounder (13) Height (cm) 166.11 8.13 148.50 183.70 Weight (kg) 61.23 5.52 50.10 67.30 Fat mass (%) 23.06 2.70 17.00 25.60
Body mass index (kg/m2
) 22.20 1.52 19.08 24.13
Arm muscle area (cm2) 35.20 4.53 29.82 45.03
Thigh muscle area (cm2) 160.64 30.58 126.11 242.83
Endomorph component 4.89 0.71 3.50 6.00
Mesomorph component 3.35 1.09 1.00 5.00
Ectomorph component 2.39 1.00 1.00 5.00
The higher presence of the endomorphic component distinguishes the Italian Division B, C and D players from those of Divisions A1 and A2, for whom mesomorphy dominates. In particular, the Italian Division B tournaments are played by athletes with different physical characteristics from those of the elite leagues (i.e., Divisions A1, A2): stature and good musculoskeletal system development appear to be
selective parameters for the players to gain access to the elite tournaments.
No statistically significant differences are observed among the Italian players in the different Divisions relative to body weight, FM%, TMA, and the degree of endomorphism and ectomorphism. The Division B players are statistically taller than the Division C players, but have a comparable height to the players in Division D. This last similarity might be explained by the participation in Division D tournaments by players originally from higher Divisions and now towards the ends of their careers. Contrary to expectations, the Division C athletes showed significantly higher AMA and mesomorphic component than the Division B players.
The anthropometry and somatotype of Italian amateur volleyball players are comparable to those of the Italian beach volleyball players. Indeed, there were no significant differences between these two types of volleyball players, with the sole exceptions of AMA and the mesomorphic component, which were also limited to the comparisons with the Division C players.
CONCLUSION
The high stature and a good muscular development (demonstrated by the prevalence of the mesomorphic component over the others) characterizes the elite players and differentiates them from those of lower categories.
Regarding the amateur sector, the anthropometric profiles do not clearly distinguish the higher ranking volleyball players (i.e., Division B) from the others (C and D Divisions). The jump in class between the lower Divisions
Measure Player function comparison n U p
Height (cm) Hitter vs. Setter 27/10 86.000 0.094
Hitter vs. Blocker 27/12 83.500 0.017 Hitter vs. Libero 27/12 34.000 0.000 Hitter vs. All-rounder 27/13 134.500 0.236 Setter vs. Blocker 10/12 29.000 0.041 Setter vs. Libero 10/12 45.500 0.339 Setter vs. All-rounder 10/13 52.000 0.420 Blocker vs. Libero 12/12 4.500 0.000 Blocker vs. All-rounder 12/13 28.000 0.006 Libero vs. All-rounder 12/13 36.000 0.022
Fat mass (%) Hitter vs. Setter 27/10 67.000 0.020
Hitter vs. Blocker 27/12 157.500 0.891 Hitter vs. Libero 27/12 111.000 0.121 Hitter vs. All-rounder 27/13 160.500 0.665 Setter vs. Blocker 10/12 34.500 0.093 Setter vs. Libero 10/12 43.000 0.262 Setter vs. All-rounder 10/13 19.500 0.005 Blocker vs. Libero 12/12 49.000 0.184 Blocker vs. All-rounder 12/13 70.500 0.683 Libero vs. All-rounder 12/13 45.500 0.077
Mesomorph component Hitter vs. Setter 27/10 91.500 0.134
Hitter vs. Blocker 27/12 122.500 0.226 Hitter vs. Libero 27/12 74.500 0.007 Hitter vs. All-rounder 27/13 159.500 0.640 Setter vs. Blocker 10/12 28.000 0.033 Setter vs. Libero 10/12 48.000 0.425 Setter vs. All-rounder 10/13 34.500 0.056 Blocker vs. Libero 12/12 22.000 0.004 Blocker vs. All-rounder 12/13 65.000 0.473 Libero vs. All-rounder 12/13 27.500 0.005
Ectomorph component Hitter vs. Setter 27/10 103.500 0.276
Hitter vs. Blocker 27/12 134.500 0.395 Hitter vs. Libero 27/12 68.500 0.004 Hitter vs. All-rounder 27/13 131.000 0.191 Setter vs. Blocker 10/12 33.000 0.073 Setter vs. Libero 10/12 42.000 0.229 Setter vs. All-rounder 10/13 55.000 0.530 Blocker vs. Libero 12/12 20.000 0.002 Blocker vs. All-rounder 12/13 45.000 0.066 Libero vs. All-rounder 12/13 43.000 0.053
(i.e., Divisions C, D) and Division B and is dictated not so much by the physical qualities of the players, but rather by their technical skills.
In Italian amateur tournaments (i.e., Divisions B, C, D), the different functions of the players show anthropometric data distributions that tend to reflect those of the elite athletes; i.e., the blockers and hitters are taller and have a more
developed ectomorphic component, while the mesomorphic component prevails in the setters and liberos.
D’ANASTASIO, R.; MILIVOJEVIC, A.; CILLI, J.; ICARO, I. & VICIANO, J. Perfiles
antropométricos y somatotipos de jugadoras de voleibol femenino y voleibol de playa. Int. J. Morphol., 37(4):1480-1485, 2019.
RESUMEN: El objetivo de este estudio
fue comparar los perfiles antropométricos, la com-posición corporal y los somatotipos de jugadoras de voleibol agrupadas según el estado de jugador (División de la Liga Nacional) y la función. El es-tudio evaluó 62 jugadores de voleibol y 12 juga-dores de voleibol de playa (edad media, 23,58, s = 7,74 años). Las medidas antropométricas incluye-ron altura, masa corporal, circunferencias y diá-metros corporales, y grosor del pliegue cutáneo adi-poso. Los datos se analizaron mediante un soft-ware proporcionando el índice de masa corporal, el porcentaje de masa grasa, el área muscular del brazo, el área muscular del muslo y el somatotipo. El análisis estadístico se realizó con el software SPSS Statistics versión 22. Las jugadores de voleibol de la División B eran más altas que las de la División C (169,19, s = 6,68 cm vs. 165,40, s = 6,19 cm; P <0,05), pero mostraron una zona mus-cular del brazo inferior (34,77 , s = 3,57 cm2 vs.
40,06, s = 7,27 cm2; p <0,05) y mesomorfia (3,40,
s = 1,21 vs. 4,84, s = 2,10; P <0,05). Para las fun-ciones del jugador, las bloqueadoras fueron las más altas (172,38, s = 4,18 cm; p <0,05) y mostraron la ectomorfia más alta (3,08, s = 1,02; p <0,05), las colocadoras mostraron el mayor porcentaje de masa grasa (26,38 %, s = 2,99 %: p <0,05), y los “liberos” mostraron una mesomorfia más compacta (5,46, s = 2,13) y ectomorfia baja (1,58, s = 0,90). Los datos antropométricos mostraron pocas dife-rencias significativas entre las divisiones de voleibol, lo que sugiere que la promoción de las divisiones se debe a la capacidad técnica más que a las cualidades físicas. Los perfiles antropométricos de las jugadoras variaron según sus funciones dentro de su equipo de voleibol.
PALABRAS CLAVE: Composición corporal; Equipo de deporte; Medición.
REFERENCES
Brozek, J.; Grande, F.; Anderson, J. T. & Keys, A. Densitometric analysis of body composition: revision of some quantitative assumptions. Ann. N. Y.
Acad. Sci., 110:113-40, 1963.
Cagnazzo, F. & Cagnazzo, R. Valutazione Antropometrica in Clinica,
Riabilitazione e Sport. Milano, Ermes, 2009.
Carvajal, W.; Betancourt, H.; León, S.; Deturnel, Y.; Martínez, M.; Echevarría, I.; Castillo, M. E. & Serviat, N. Kinanthropometric profile of Cuban women Table IV. Results of Mann–Whitney analysis (U) for evaluation of the significance (p)
of the mean differences between the various player functions.
n, number of players used in each of the comparisons; U, Mann–Whitney statistic; significance for p ≤0.05 indicated in bold.
Specific Measure Observation 1 Observation 2 Observation 3 Correlation
Mean ±SD Mean ±SD Mean ±SD coefficient
Player Height (cm) 166.904 6.720 166.904 6.720 166.904 0.720 1.000
Weight (kg) 62.307 7.613 62.307 7.613 62.307 7.613 1.000
Circumference Right arm 26.039 2.161 25.982 2.234 25.923 2.209 0.996
(cm) Left arm 26.004 2.195 26.023 2.187 25.949 2.157 0.998 Forearm (cm) 23.508 1.283 23.476 1.344 23.438 1.347 0.996 Wrist 15.814 0.654 15.828 0.646 15.819 0.642 0.985 Waist 69.176 4.943 69.220 5.058 69.134 4.963 0.998 Hips 91.369 6.021 91.155 5.863 91.089 5.847 0.996 Thigh 55.141 4.154 55.146 4.193 55.108 4.204 0.999 Mid-thigh 50.707 3.555 50.474 3.491 50.503 3.565 0.995
Above right knee 38.386 2.789 38.297 2.895 38.180 2.803 0.989
Calf 35.482 2.123 35.493 2.169 35.482 2.120 0.996
Diameter (cm) Elbow 6.291 0.677 6.214 0.649 6.174 0.635 0.992
Wrist 4.853 0.306 4.839 0.296 4.828 0.280 0.987
Knee 9.973 0.741 9.951 0.719 9.924 0.724 0.994
Ankle 6.293 0.375 6.276 0.372 6.288 0.365 0.989
Skinfold thickness Tricipital 20.130 4.264 20.419 4.133 20.439 4.171 0.988
(mm) Bicipital 8.200 2.366 8.030 2.238 7.976 2.257 0.986
Pectoral 10.189 3.306 10.092 3.494 10.057 3.565 0.995
Sub-scapular 13.659 4.169 13.653 4.189 13.496 4.117 0.996
Abdominal 20.762 4.412 20.830 4.383 20.545 4.473 0.994
Supra-iliac 19.888 4.213 19.850 4.186 19.664 4.271 0.989
Front of the thigh 21.624 3.742 21.622 3.971 21.564 3.926 0.989
Back of the thigh 18.084 3.478 18.205 3.344 18.047 3.477 0.986
Inside of the thigh 19.238 4.700 19.384 4.490 19.372 4.482 0.992
Above right knee 17.627 3.212 17.400 3.382 17.241 3.273 0.987
Above left knee 17.465 3.738 17.235 3.775 17.065 3.784 0.985
Popliteala
18.457 4.167 18.146 4.491 18.000 4.390 0.988
Olympic volleyball champions. MEDICC Rev., 14(2):16-22, 2012. Duncan, M. J.; Woodfield, L. & al-Nakeeb, Y. Anthropometric and physiological
characteristics of junior elite volleyball players. Brit. J. Sports Med.,
40(7):649-51, 2006.
Fleiss, J. L. The Design and Analysis of Clinical Experiments. New York, Wiley Classics Library, 1986.
Gabbett, T. & Georgieff, B. Physiological and anthropometric characteristics of Australian junior national, state, and novice volleyball players. J. Strength
Cond. Res., 21(3):902-8, 2007.
González-Ravé, J. M.; Arija, A. & Clemente-Suarez, V. Seasonal changes in jump performance and body composition in women volleyball players. J.
Strength Cond. Res., 25(6):1492-501, 2011.
Gualdi-Russo, E. & Zaccagni, L. Somatotype, role and performance in elite volleyball players. J. Sports Med. Phys. Fitness, 41(2):256-62, 2001. Heat, B. H. & Carter, J. E. A modified somatotype method. Am. J. Phys.
Anthropol., 27(1):57-74, 1967.
Jackson, A. S.; Pollock, M. L. & Ward, A. Generalized equations for predicting body density of women. Med. Sci. Sports Exerc., 12(3):175-81, 1980. Lidor, R. & Ziv, G. Physical and physiological attributes of female volleyball
players--a review. J. Strength Cond. Res., 24(7):1963-73, 2010. Marques, M. C.; van den Tillaar, R.; Gabbett, T. J.; Reis, V. M. &
González-Badillo, J. J. Physical fitness qualities of professional volleyball players: determination of positional differences. J. Strength Cond. Res., 23(4):1106-11, 2009.
Nikolaidis, P. T. Body mass index and body fat percentage are associated with decreased physical fitness in adolescent and adult female volleyball players.
J. Res. Med. Sci., 18(1):22-6, 2013.
Nikolaidis, P. T.; Ziv, G.; Arnon, M. & Lidor, R. Physical characteristics and physiological attributes of female volleyball players--the need for indivi-dual data. J. Strength Cond. Res., 26(9):2547-57, 2012.
Sheppard, J. M.; Chapman, D. W.; Gough, C.; McGuigan, M. R. & Newton, R. U. Twelve-month training-induced changes in elite international volleyball players. J. Strength Cond. Res., 23(7):2096-101, 2009a.
Sheppard, J. M.; Gabbett, T. J. & Stanganelli, L. C. An analysis of playing positions in elite men's volleyball: considerations for competition demands and physiologic characteristics. J. Strength Cond. Res., 23(6):1858-66, 2009b.
Trajkovic, N.; Milanovic, Z.; Sporis, G. & Radisavljevic, M. Positional differences in body composition and jumping performance among youth elite volleyball players. Acta Kinesiol., 5(1):62-6, 2011.
Corresponding author: Ruggero D’Anastasio, PhD
Assistant Professor of Anthropology
Department of Medicine and Aging Sciences State University “G. d’Annunzio”
Chieti–Pescara, Italy, c/o
Museo Universitario Piazza Trento e Trieste ITALY
Email: [email protected]
Table V. Analysis of the reproducibility of the measures (n = 74, for all) through the intraclass correlation coefficients, which demonstrate the strength of agreement according to Fleiss of ‘very good’ for all measures.
abehind the knee.
Received: 18-03-2019 Accepted: 03-06-2019