Università degli Studi del Piemonte Orientale
“Amedeo Avogadro”
Department of Pharmaceutical Sciences
Ph.D. in Chemistry & Biology
XXXI cycle 2015-2018
LC-MS applications in Pharmaceutical Analysis,
Bioanalysis and Proteomics
Michele Bianchi
Supervised by Prof. Erika Del Grosso
PhD program co-ordinator Prof. Guido Lingua
100 50 0 586.1 m/z R el at iv e A b ESI
-Università degli Studi del Piemonte Orientale
“Amedeo Avogadro”
Department of Pharmaceutical Sciences
Ph.D. in Chemistry & Biology
XXXI cycle 2015-2018
LC-MS applications in Pharmaceutical Analysis,
Bioanalysis and Proteomics
Michele Bianchi
Supervised by Prof. Erika Del Grosso
9
Contents
Chapter 1 ... 11 1. Introduction ... 12 1.1 Liquid Chromatography ... 12 1.2 Mass Spectrometry (MS) ... 181.3 Liquid Chromatography tandem Mass Spectrometry ... 23
1.4 LC-MS applications ... 26
Chapter 2 ... 48
2. Outline of the thesis ... 49
Chapter 3 ... 51
3. Troxerutin, a mixture of O-hydroxyethyl derivatives of the natural flavonoid rutin: Chemical stability and analytical aspects ... 52
Chapter 4 ... 92
4. Synthesis and Degradation of Adenosine 5’-Tetraphosphate by Nicotinamide and Nicotinate Phosphoribosyltransferases ... 93
Chapter 5 ... 129
5. Proneurogenic effects of trazodone in murine and human neural progenitors 130 Chapter 6 ... 150
6. Study of Nicotinamide Phosphoribosyltransferase (NAMPT) phosphorylation sites in melanoma cells ... 151
Chapter 7 ... 179
7. Discussion ... 180
Chapter 8 ... 187
8. List of Publications ... 188
11
12
1. Introduction
Liquid Chromatography tandem Mass Spectrometry (LC-MS) is a powerful tool available for scientists. According to pubmed publications data collected from
https://www.ncbi.nlm.nih.gov/pubmed/ using Liquid Chromatography Mass
Spectrometry or LC-MS as input search, more than 130,000 results came out. Furthermore, the publications trend is keeping rising overcoming more than 8,400 papers per year in the last five years. These data are the demonstration that LC-MS is increasing in terms of popularity in the scientific world. LC-MS is widespread in many scientific applications starting from chemistry to biology and much more. On these basis, in this introduction we will address the following topics:
(1) From the born of chromatography to development of modern UHPLC system. (2) Mass spectrometer analyzers.
(3) The coupling of liquid chromatography to mass spectrometry systems.
(4) The main LC-MS applications in pharmaceutical analysis, bioanalysis and proteomics.
1.1 Liquid Chromatography
1.1.1 Liquid Chromatography (LC)
The first paper published about chromatography was published by A. J. P. Martin and R. L. M. Synge on Biochemical Journal in 1941. In this paper, the concepts of chromatography and theoretical plates were described and applied, and it allowed them to win the Nobel prize in chemistry in 19521. Nevertheless, the inventor of chromatography is recognized as Mikhail S. Tswett, a Russian botanist who worked on the separation of plant pigments at the beginning of 19002. The first High Performed Liquid Chromatography (HPLC) apparatus was described by C. G. Horváth e S. R. Lipsky and B. A. Preiss with two papers published on Nature and Analytical Chemistry in 1966 and 19673,4, respectively. From thosedays to now, considerable progress has been made until the born of modern UHPLC.
13
The aim of Chromatography is to separate single components in a mixture relying on the adsorption and desorption equilibrium of each compounds between the liquid (mobile) phase and the solid (stationary) phase5.
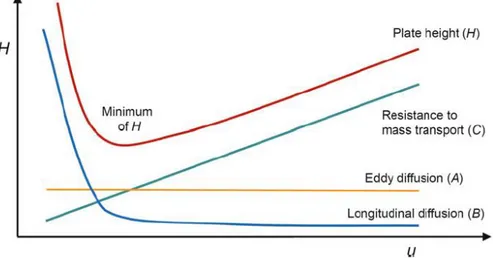
So, two adjacent compounds can be defined separated if their peaks result resolved and spaced at the peak bases. To evaluate and to improve the chromatographic resolution, van Deemter et al.6 proposed the following equation 1(1):
1 (1)
1 (1) where:
H is plate height, λ is particle shape (with regard to the packing), dp is particle
diameter, γ, ω, and R are constants, Dm is the diffusion coefficient of the mobile phase, dc is the capillary diameter, df is the film thickness, Ds is the diffusion
coefficient of the stationary phase, u is the linear velocity. Equation 1 (1) can be simplified as following in 1 (2):
1 (2) 1 (2) where:
A is the Eddy diffusion, determined by the possible pathway of the mixture compounds which can go across the porous of the stationary phase causing peak broadening.
B is the longitudinal diffusion of two adjacent compounds during the chromatographic elution. C is the resistance to mass transfer, which means all the possible chemical interaction between the mobile and stationary phases.
14
The van Deemter equation can be represented in the following plot (figure 1):
Figure 1. Van Deemter equations and plot of plate height(modified from Gross et al7)
From van Deemter work, it is possible to determine the optimum flow rate to achieve the lowest height of H, allowing the best efficient chromatographic resolution for each chromatographic system.
There are a lot of parameters that can be studied and optimized to improve a chromatographic separation, such as the peaks retention time, the selectivity, the robustness and column efficiency.
15
1.1.2 High Performance Liquid Chromatography (HPLC) sections and method development
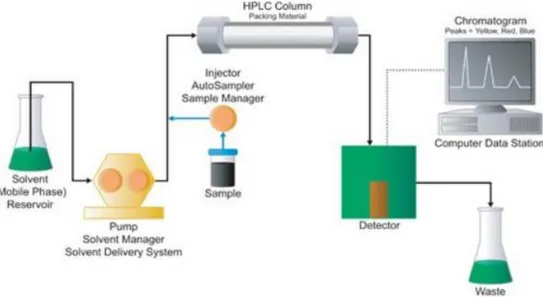
HPLC systems are constituted by mobile phase reservoirs, degasser, pumps, automated injector and autosampler, LC column, detector and PC as shown in figure 2.
Figure 2. Schematic design of an HPLC system (figure from waters, http://www.waters.com)
All the HPLC compartiments are always object of research to provide to the scientists instruments with robustness, sensitivity, accuracy and precision performance updated and improved.
Mobile phases, stationary phases, injection volume and detector setting values are the main parameters to be optimized during the method development.
In both reversed phase LC and hydrophilic LC mobile phases are constituted by a lipophylic (e.g. methanol and acetonitrile) and polar (e.g. water, saline buffers) solvents with or without pH modificators (e.g. formic or acetic acid and sodium hydroxide). A pH modificator can gain importance in LC tandem mass spectrometry system in modifying the compounds ionization before the MS analysis.
16
Stationary phases which characterized a chromatographic column are the key factors during the method development. Available on the market, there are essentially three kinds of column which differ each others for the structural features of the column packaging. They are: the monolits of second generation, the silica fully porous particles and the silica core shell particles.
Focusing on the last two and more common kind of columns, both of them can have the silica functionalized with different chemical moieties (e.g. C18, C8, C4, C1, HILIC, cyano, phenyl, fluoro-phneyl, amino, amide and phenyl-hexyl) to allow different compounds partitions between mobile and stationary phases, with the possibility of taking advantages in term or resolution. Different silica functionalizations make different chemical interactions (e.g. hydrophobic, hydrogen binding, electrostatic, steric and π-π interaction) between column and analytes. Nevertheless, fully porous and core shell particles differ for the structure of the microsphere. For the first one, microspheres are made of a porous fully silica particle while for the core shell, the core is made by a solid silica sphere covered by a porous silica shell.
For the fully porous, 100% of the surface can interact with the analytes, while in core shell this surface is limited for the shell, decreasing the number of theoretical plates. At the same time, a lot of advantages are provided by core shell particles compared to equal diameter fully porous one: increased permeability, reduced pore volume, reduced porosity, reduced van Deemter, A, B and C terms (the last one for macromolecules e.g. peptides) and the thermal conductivity is increased. All of these positive features made of the core shell a good alternative to fully the porous particles as column packing material for HPLC systems8,9,10,11,12,13,14.
Despite these core shell advantages listed before, fully porous particles are still the golden standard in terms of column efficiency, resolution, productivity and robustness12,15. The real disadvantage of fully porous particles, which limit their use, is constituted by the huge backpressure generated, especially from the sub-2µm
17
particles. High backpressure forces these particles to Ultra-HPLC (UHPLC) instruments8.
1.1.3 Ultra High Performance Liquid Chromatography (UHPLC)
In the last line of the previous paragraph, it has been introduced the concept of UHPLC. The main difference between an UHPLC and HPLC analysis is in the backpressure managed by pumps. UHPLC pumps can work also over 1000 bar of pressure vs the 300 - 400 bar on HPLC instruments16,17. The impact of UHPLC with the use of sub-2µm particles size column was huge in different application fields18. To simplify the introduction of UHPLC system in laboratories, especially the pharmaceuticals of quality control, different protocols for transferring the HPLC methods on UHPLC were developed16.
Finally, UHPLC operating with low micro and nanoflow rates are surely the last frontier in the liquid chromatography, especially for the analysis of large molecules19,20.
18
1.2 Mass Spectrometry (MS)
Nowadays mass spectrometry is an indispensable tool, especially in R&D in so many disciplines. The first MS was built by J. J. Thomson (Nobel Prize for physics in 1906 for electron discovery) who collected also the first MS spectra in 19097. From that day, we assisted to an outstanding growth of MS analyzers. At the state of the art, the most common MS are: the quadrupole, time of flight (TOF), magnetic sector (B), linear ion trap (LIT), QIT (quadrupole ion trap), Fourier transform ion cyclotron resonance (FT-ICR) and the orbitrap.
Quadrupole, QIT and orbitrap are discussed in the next paragraphs.
1.2.1 quadrupole (q)
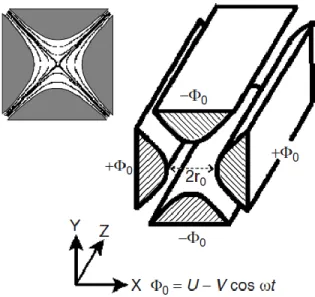
The quadrupole mass analyzer consists of four cylindrical (or even better hyperbolic) rod electrodes set perfectly parallel each other. As shown in figure 3, the rods have a z-direction and are mounted in a x, y plane configuration.
Figure 3. Quadrupole geometry with hyperbolic rods and applied potentials21. Usually, quadrupoles have rods of 10-15 mm of
diameter and a length of 15-25 cm. The radiofrequency is in the order of 1-4 MHz with voltages between 100-1000 V, providing also 100 ion oscillations per ion passage
19
The quadrupole principle of working is based on the use of an oscillating electric field to separate ions and so to stabilize ion trajectories at fixed m/z ratio.
The pairs of opposite bars are each held at the same potential (Φ) which is composed of a DC and an AC component. Ions travel along the z axis and they are subjected to the influence of the electric field made by a quadrupolar alternative electric field superimposed to a constant electric field. This mechanism allows the m/z selection of ions of interest, excluding others that move out on x and y axis.
This principle of action is explained from motions equation21.
A way to evaluate the capability of a MS is the calculation of its resolving power or resolution (R). R is the ability of the MS analyzers to resolve to adjacent peaks and it is expressed by the following formula according to the peak width definition 1 (3)22:
1 (3)
1 (3) where:
R is the resolving power, m is the m/z of the peak ion, and Δm is peak width at the 0.5 peak height.
The resolution power of the quadrupole is unitary. It means that at 200 m/z, the resolving power is 2007. So, quadrupole is not considered a high-resolution analyzer. Nevertheless, considering the ability of the quadrupole as mass selector, it is common to see quadrupole series instruments applied for quantitative analysis (i.e. QqQ) or hybrid instruments such as Q-TOF, Q-FT-ICR or Q-LIT-orbitrap.
1.2.2 quadrupole ion trap (QIT)
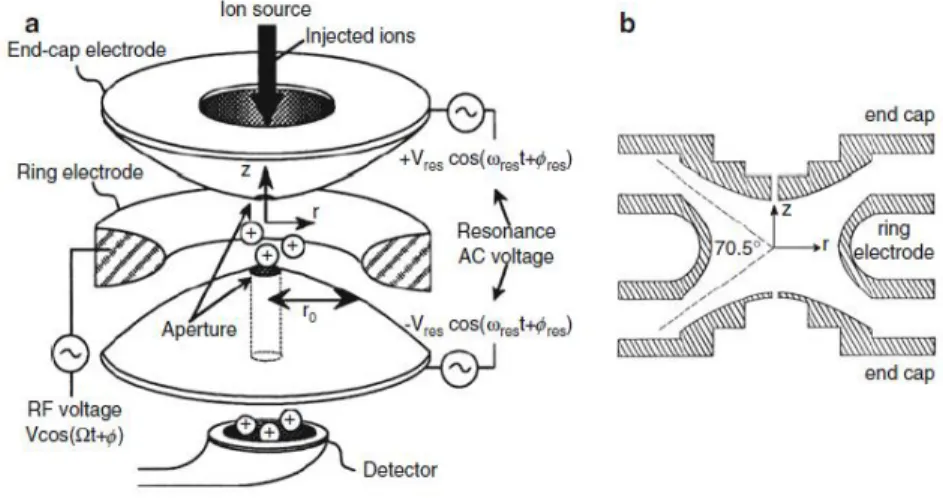
A quadrupole ion trap (QIT) is based on the same principles of the quadrupole, even if the geometries of the analyzers differ. The QIT is constituted by two end caps that are hyperbolic electrodes, along with a ring electrode replaces the remaining two
20
rods of the quadrupole (figure 4). An open section between the r, y and z axis, is the inlet entrance for the ions. All components of the trap are structured to generate DC and RF potential between them. Due to these potentials, it is possible to set stable trajectories for ions in a set m/z range or of a fixed m/z, removing ions by leaving them to collide on the trap components or by axial ejection by instable trajectories. Another difference is made by the electric field generated in the trap. In fact, there is a three-dimension electric field, allowing 3D trajectories7.
The motion equations of ions in the QIT are similar to the ones of quadrupole analyzer proposed by Mathieu and completed by Paul (Nobel Prize for physics in 1989 for his work in developing MS analyzers23.
According to Cooks et al.24, Ion traps resolution could reach 10000 at m/z 1000. It means that at 200 m/z, R is 2000, that it is not considered high resolution.
Figure 4. QIT scheme (a) and its r and y section (b)25
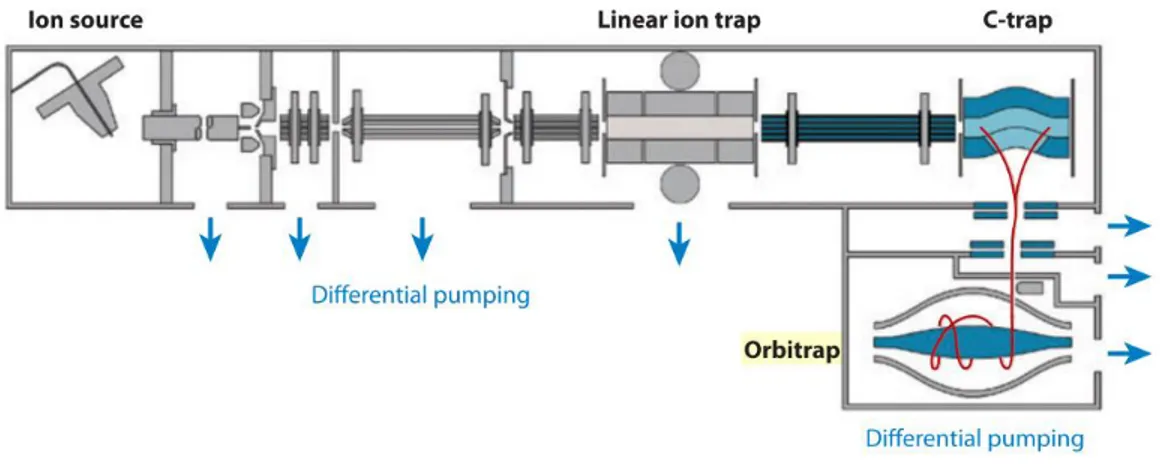
1.2.3 Orbitrap
Orbitrap mass analyzer was described for the first time by Makarov in 200026, basing
on Kingdon trap projects made in 1920s27. The first MS equipped with an orbitrap
as first MS analyzer was introduced on the market by Thermo Fisher Scientific in 200528. The orbitrap is constituted by two parts: an external electrode with a shape
21
of barrel cut in two equal parts with a small interval, and a central electrode with a spindle shape. The maximum dimensions if the electrodes are 20 mm and 8 mm, respectively (figure 5).
Figure 5. Orbitrap scheme design as proposed by Makarov26
The orbitrap mechanism of action is resumed. Ions are injected from the ion source and trapped in the linear ion trap. Ions of interest can be isolated and fragmented in the linear ion trap, and even scanned out and detected by an independent set of detectors.
To obtain high accuracy measurements, the ions are axially ejected from the linear trap into the c-trap where they are captured again and thermalized by collisions with nitrogen gas. Then, they are squeezed into a smaller cloud within the c-trap ready for injection into the orbitrap.
When ions are into the orbitrap, the voltage on the central electrode increases and it forces the ion packages circling around the central electrode.
Finally, ions come into the orbitrap lightly off axis and keep oscillating along the central electrode, until their stabilization 1 (4). The frequency of the harmonic axial oscillation (wz)is inversely proportional to the square root of m/z ratio of the ions
(figure 6).
22 1 (4) where:
wz is the frequency of the harmonic axial oscillation, k is q is the ion charge and m is
the ion mass.
Afterwards, the image current is recorded on the outer split electrodes. The signals are amplified and transformed into a frequency spectrum by the fast Fourier Transform which is finally converted into a mass spectrum28.
Figure 6. Orbitrap design scheme29
The last orbitrap MS instrument released on the market from Thermo Fisher Scientific is the Orbitrap Fusion Lumos, an hybrid instrument which can reach a R (FWHM) value of 500,000 at 200 m/z (www.thermofisher.com).
23
1.3 Liquid Chromatography tandem Mass Spectrometry
The first concept of electrospray ionization (ESI) was first described by Dole et al. and Taylor in the 1960s30,31.Only in the late 1980s, Mann et al32,33 applied this technique with success on molecules with a M.W. in the range of 100 - 2000 Da. Today, ESI is one of the most common ionization mode in LC-MS instruments. It is an ionization type belonging to class of atmospheric pressure ionization (API) methods, as the atmospheric pressure chemical ionization (APCI) and atmospheric pressure photoionization (APPI). ESI is the golden standard choice for liquid chromatography tandem mass spectrometry analysis, for either small and large molecules7.
ESI together with matrix-assisted laser desorption/ionization (MALDI)34, another ionization mode, allowed the application of MS techniques also in biology for studies of large biomolecules. J. B. Fenn and K. Tanaka received the Nobel Prize in chemistry in 2002 for the development of soft ionization methods for mass spectrometric analyses of biological macromolecules35,36.
1.3.1 ESI working concept
24
In ESI, the sample solution coming from a capillary tube at 1-20 μl min–1 of flow rate is ionized by applying an electric field at atmospheric pressure. The potential is applied by a cylindric electrode which surrounds the capillary tube, to guarantee an ionization at 3-6 kV. At this point, there is a charge accumulation on the liquid surface at the end of the capillary, which will be broken to form highly charged droplets once left in the space. Then, the droplets aerosol just formed pass into a countercurrent stream of hot inert nitrogen gas at low flow rates, as a heat source for supplying the complete solvent evaporation.
A small portion of the sprayed material comes into the aperture of a transfer capillary (4-8 cm length with an internal diameter of 0.2 mm) at 102 Pa of pressure. A minor portion passes through the orifice of a skimmer (a cone-shaped electrode named Taylor cone, with a small aperture at its end) into the high vacuum behind (10–3 and 10–4Pa). Finally, desolvation of the ions is completed and they are focused into a mass analyzer. A general scheme of the ESI is reported in figure 7.
The potentials applied to the electrode, capillary, skimmer, and lenses behind provide an effective transfer of ions through the interface. These parameters are optimized depending of chemical features of the molecules to be ionized.
The ions obtained from large molecules carry a greater number of charges if several ionizable sites are present (multicharged ions). Typically, a protein has one charge per thousand Da approximately. Small molecules with a M.W. lower than a thousand Da, will produce mainly monocharged ions. ESI can also be used in the case of molecules without any ionizable site through the formation of sodium, potassium, ammonium, formate, acetate or other adducts. However, ions have to be already present is sample solution before the electrospray ionization.
25 1.3.2 ESI application to different LC flow rates
Nowadays, ESI is suitable of working at different flow rate from 50-200 μl min–1 for chemical and bioanalytical LC-MS applications to 200-400 nl min–1 for proteomics applications.
For micro flow rate, the ESI has been assisted with the use of a nebulizer or sheath gas flow that provides a pneumatic assistance during the spray capillary process37,38.
This improvement allows the use of higher sample solution flow rate reducing the surface tension of the solvent and providing its complete evaporation.
At the same time, working with nano flow rate requires a nano ionization source and a nanoESI is essential for the optimal ionization of highly polar solutions. Both these two factors are common in the analysis of peptides in proteomics LC-MS based works. The nanoESI has been described by Wilm and Mann39, modifying the capillary spray structure of the electrospray. The spray needle is replaced with a borosilicate glass capillary with a narrow tip terminal of few μm of i.d. Lower droplets size are produced, and the sample consumption is reduced39,40. The spray voltage applied to the counter electrode is less than 1.5 kV. A micromanipulator working in three dimensions and a camera are necessary to set a correct distance of about 1 mm between the capillary and the entrance in the source.
26
1.4 LC-MS applications 1.4.1 Pharmaceutical Analysis
LC-MS technique is widespread in pharmaceutical analysis. There are a lot of applications in which LC-MS is involved, among them: determination of pesticides41,42, dose formulation analysis43, ADME studies44, impurity profiling45, toxicity studies46,47, quality assurance and quality control methods48, therapeutic drug monitoring49 and forced degradation studies14,50,51. In this paragraph, the forced degradation studies and the identification of the stability indicator of a drug will be discussed. This research field is regulated by the International Conference of Harmonization (ICH) guidelines Q1(A)R2 stability testing of new drug substances and products52. These guidelines report an overview on how to perform a validated stability study in case of drugs to be used for humans. Nevertheless, the experimental conditions are not detailed described, and the chemist has to set them up depending on the features of individual drug substances.
The stress testing conditions aim to identify degradation products arising from drug substances, to establish a degradation pathway and to study the intrinsic stability of the compounds evaluated. The forced conditions studied usually include natural, acidic, alkaline, oxidative, the presence of a radical initiator and photodegradation in both daylight and UV light. Time points are dependent to concentrations involved to each stress reactions and they are fixed from few hours to 48 hours until 14 days for daylight photodegradation exposure. Also, the temperature is a key feature to be examined and it is set for all conditions between room temperature and 50°C. After planning the protocol with the stress testing condition, it is common to develop an LC-MS method for the identification of the drug substances and of the degradation products that could be developed during the experimental conditions.
A linear gradient covering all the percentages of the organic mobile phase is the golden standard strategy during the LC-MS method optimization. It is an important
27
aspect to be evaluated, considering that the nature on the possible degradation products is unknown in the early stages of the stability testing. Other LC-MS parameters are set on drug substances.
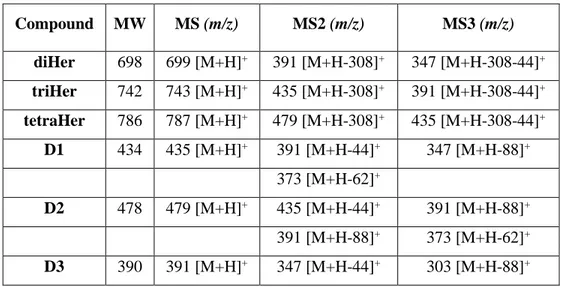
Once a product degradation product is identified, full MS, MS2 and MS3 spectra are studied to propose a structure and so for the identification. Orthogonal techniques to mass spectrometry are necessary such the nuclear magnetic resonance (NMR) and the infrared spectroscopy (IR) for the complete characterization.
The following step is the production of the degradation compounds in order to have them pure to compare the results obtained during stress studies. This is essential to confirm and to validate the degradation pathway of drug substances.
Examining degradation products under stress conditions is useful also in developing and validating suitable analytical procedures for stability studies of drug products. In fact, the degradation compounds identified could be formed during the life of a pharmaceutical products.
At the same time, ICH Q2 (R1) guidelines are followed to validate an analytical method suitable for stability analyses in pharmaceutical field53. The parameters
investigated for the method validation are: the selectivity, robustness, lower limit of detection (LOD) and lower limit of quantification (LOQ), linearity, intraday and interday precision and accuracy14.
28
1.4.2 Bioanalysis
Bioanalyses are described as the identification or quantification of analytes in biological samples (e.g. tissue culture, blood, plasma, serum, urine, feces and saliva) coming from different species. Analytes are either large (e.g. proteins and peptides) and small molecules (e.g. metabolites and drugs). The applications are numerous: molecular biology, clinical and preclinical, pharmacokinetic, pharmacodynamic and toxicology studies. Different apparatus can be employed for performing bioanalysis. In this paragraph, it will be discussed bioanalysis carried out with LC-MS instruments.
1.4.2.1 Sample preparation techniques
Sample preparations are different approaches performed before the LC-MS analysis, to clean and to purify the biological samples from salts and other molecules which could interfere with the ionization and detection of the analytes. Considering that the biological samples are complex mixtures made of proteins, lipids, small polar compounds, the extraction of the analytes of interest is a key step in bioanalysis. The main methodologies are the following:
(1) Protein precipitation (PPT): it consists in the adding of organic solvents (e.g. acetonitrile, methanol or acetone), pH modulator (trichloroacetic and perchloric acids) and metal ions (e.g. zinc salts). PPT is one of the most common techniques14,54, quick, easy to do, not expensive, with high ion suppression and good sensitivity. It is suitable for the extraction of both polar and hydrophobic compounds.
(2) Liquid liquid extraction (LLE): it is used for liquid biological samples (e.g. plasma55, serum56 and urine57) which are mixed with organic solvents. This technique is common for acidic of basic drugs. Often, LLE and PPT are coupled with an evaporation step to concentrate the analytes before the LC-MS analysis. The LLE 96-well plates automation has been a key upgrade of this technique, solving the mixing issues58,59.
29
(3) Solid phase extraction (SPE)60: it is often the first choice in the analytical labs due its high reproducibility and efficiency. SPE consists in the loading of the sample upon few centimeters of sorbent cartridge. It is functionalized in different ways offering numerous types of interactions between the stationary phase and the analytes to be extracted. Washing and an elution steps are required during the extraction process. SPE negative points are the time consuming either during the method development and the sample handling in routine analysis. Positive aspects are the preconcentration of the biological samples and the automation with online methods which guarantee a reliable, robustness and time saving in this step of the analysis61.
Moreover, it is a recent trend, the miniaturization of some sample preparation methodologies such as the SPE. This approach allows low sample consumption, less volume of solvents is required with same effectiveness of the “classic” methods62,63.
1.4.2.2 LC-MS bioanalytical method parameters
Some LC-MS method parameters must be evaluated and measured during the method development phase. Handling biological matrices mean working with a lot of biological interferences that could vary the detection of the compounds of interests. Hence, the evaluation of the LC-MS parameters guarantees the quality and the robustness of the bioanalysis. The parameters are: selectivity, linearity, precision, accuracy, matrix effect, recovery, stability and sensitivity64.
(1) The selectivity is the ability of the bioanalytical method to measure and differentiate the analytes in the presence of components that may be expected to be present. These could include metabolites, impurities, degradants, or matrix components. It is evaluated by injecting a matrix blank sample coming from different sources. The aim is to exclude interferences peaks with analytes at lower limit of quantification (LLOQ) concentration. To do that, the signal to noise (S/N) ratio is a
30
useful system suitability parameter. The S/N ratio is calculated as follow as described on U. S. Pharmacopeia (621):
S/N ratio = 2H/h 1(5)
1 (5) where:
H is the height of the peak measured from the peak apex to a baseline extrapolated over a distance ≥5 times the peak width at its half-height; and h is the difference between the largest and smallest noise values observed over a distance ≥5 times the width at the half-height of the peak.
(2) The linearity is evaluated for quantitative methods with the internal or the external calibration method, depending on the diluting solutions (matrix or solvents, respectively) used for preparing the calibration points. 6-8 points are suggested for rough calibration curves included a blank sample (with n=5 of repeatability). A calibration curve has to be prepared fresh before each batch analysis.
(3) The precision is the closeness of agreement between a series of measurements obtained from multiple sampling of the same homogenous sample under the prescribed conditions. It is evaluated at least on three levels (LLOQ, MQ and HQ), n=5. Precision is evaluated intrabatch and interbatch.
(4) The accuracy is the degree of closeness of the determined value to the nominal or known true value under prescribed conditions. This is sometimes termed trueness. It is evaluated on three different levels (LLOQ, MQ and HQ), n=5. It is calculated with following formula.
𝐴𝑐𝑐𝑢𝑟𝑎𝑐𝑦 =Observed conc−Nominal conc
Nominal conc × 100 1(6)
(5) The matrix effect is the direct or indirect alteration or interference in response due to the presence of unintended analytes (for analysis) or other interfering substances in the sample. While, the recovery is the extraction efficiency of an
31
analytical process, reported as a percentage of the known amount of an analyte carried through the sample extraction and processing steps of the method.
To measure the matrix effect (ME) and the recovery (RE), three samples are prepared:
-A: analyte in solvent;
-B: analyte added to the matrix after the extraction procedure; -C: analyte added to the matrix before the extraction procedure.
% ME is calculated as:
% 𝑀𝐸 =𝐵
𝐴 × 100 1 (7)
Moreover, matrix effect could be evaluated also with a qualitative method when a blank matrix (without analytes) is available65.
% RE is calculated as:
% 𝑅𝐸 =𝐶
𝐵 × 100 1 (8)
(6) The stability could be evaluated with four different assays: freeze and thaw stability, short term temp stability (between 4-24 h), long term stability (between 20 to 60 days), stock solution stability and post preparative stability.
(7) The sensitivity is evaluated as: limit of detection (LOD, the lowest concentration of an analyte that the bioanalytical procedure can reliably differentiate from background noise) and the lower limit of quantification (LLOQ, the lowest amount of an analyte in a sample that can be quantitatively determined with suitable precision and accuracy).
In general, CV values are retained satisfactory when ≤ 15% or ≤ 20% for LLOQ. While for % ME and % RE there are not reported values, but it is suggested to reach percentages closest to 100%.
32
1.4.3 Proteomics
1.4.3.1 Introduction
Proteomics as word was born in the middle of nineties as the fusion of protein and genomics66,67. The proteomics general aim is the identification and characterization of the whole proteome of all the organisms68. Moreover, to understand the protein sequencing, protein post translational modifications (PTMs), protein localization, protein quantification and protein-protein interactions are even more challenging than a genome identification69,70.By the years, proteomics grew up becoming a new discipline across chemistry and biology. The proteomics backbone is constituted by the mass spectrometry (MS), sample preparation and bioinformatic data analysis. Each of these aspects must be accurately planned in order to achieve the results required.
1.4.3.2 Proteomics approaches
An LC-MS based proteomic analysis may be performed on biological samples constituted by intact proteins or enzymatically digested proteins into peptides. So, depending on the approach chosen, the strategies available are essentially three: top down, bottom-up and shotgun.
The first one, top down proteomics means that proteins are analyzed as intact entities without any proteolysis. The main advantages of this approach are determined in the study of PTMs, in the sequence coverage and in protein quantitation. However, there are some limitations, such as the limited fragmentation of intact protein in the gas phase, protein front-end separation is challenging, and it is applicable only for pure protein or small protein mixtures. All these disadvantages, make this approach quite far from the routine analysis.
Secondly, bottom up proteomics is the characterization of proteins after their enzymatically digestion into peptides prior the MS analysis. While, Yates lab.71 coined the term shotgun proteomics referring to bottom up proteomics performed on
33
complex protein mixture. With the shotgun proteomics all the disadvantages of the top down proteomics are overcome. However, peptides identification is a key point and it is achieved by the overlapping of the peptides MS2 spectra generated from the LC-MS analysis with the ones generated from the in silico digestion of the appropriate protein database. Furthermore, the peptide identified is assigned to the protein (if single so uniquely associate to only one protein) or proteins which shared that peptide. The identification is regulated by search criteria and scoring schemes and it is usually followed by the filtering of the results evaluating the false discovery rate 29,69,72,73,74.
The following paragraphs will be focused on shotgun proteomics.
1.4.3.3 Ionization, fragmentation and acquisition mode
In shotgun proteomics, two types of soft ionization techniques in are commonly used, able to perform the ionization of peptides. They are the nanoelectrospray (nESI) and the matrix-assisted laser desorption/ionization (MALDI)75,76,. In general, nESI is used for peptides in solution, so it is coupled with UHPLC instruments working with nano- or low-micro flow rates, while MALDI is involved for gel based matrix or tissue samples.
After the sample ionization, another key point is the fragmentation mode, essential to generate MS2 spectra of peptide ionized. The first one to be developed and applied for peptides fragmentation was the collision induced dissociation (CID). In low energy CID, b- and y- fragment ions are generated (backbone C-N bond broken), due to multiple collisions with rare gas atoms to the ion peptide positively charged. A modification of CID technique is the higher-energy collisional dissociation (HCD). It is specific for orbitrap and hybrid instruments and it takes place external to the ion trap (e.g. HCD cell)77. HCD is considered one of the most used fragmentation methods due to its applicability also for PTMs studies. Another technique was introduced by MacLafferty lab in 199878,79 and it is called electron-capture
34
dissociation (ECD). It consists in the capture of a thermal electron by peptides positively charged inducing a N-Cα backbone fragmentation generating c- and z- type fragment ions. It allows to produce more product ions in the peptide MS2 than CID and HCD, getting a better sequence coverage and a good PTMs identification in comparison with CID and HCD. Finally, one more fragmentation methods is represented by the electron-transfer dissociation (ETD), developed by Hunt lab. in 200480. It is similar to the previous one in producing essentially c- and z- type fragment ions. In fact, ETD induces fragmentation of large, multiply-charged cations by transferring electrons to them from radical anions with low electron affinity. It provides fragmentations with femtomole of peptides due to the fast and efficient mechanism of generating MS2 product ions. With this technique, there is the increasing of sequence coverage. PTMs are left intact during the fragmentation making this fragmentation technique the golden standard for these analyses. Unlucky, ECD and ETD are relegated essentially on ions trap, FTICR and hybrid expensive instruments (figure 8).
In conclusion, the CID/HCD fragmentation mode are the most common and the most used in proteomics LC-MS based analysis.
35
Figure 8. MS fragmentation techniques applied in proteomics69
While, another theme faced in the last period is about the acquisition mode in proteomics analysis. There essentially two acquisition modes: the data dependent acquisition (DDA) and the data independent acquisition (DIA)81. DDA consists in the acquiring a full MS spectrum of the peptides (MS1), followed by the collection of as many fragmentation spectra (MS2) as possible, within a cycle time of about 1 second (time window is variable). It is common to find methods with the selection of the top 12 MS1 peptide ions fragmentated to design the MS2 spectra per cycle. While, DIA is constituted by sequential windows of acquisition made usually of 25 m/z units, in which all the MS1 ions identified are selected, fragmented and acquired
36
by the MS detector. DIA MS2 spectra are really complex and specific deconvolution and identification software are required for the data analysis81,82,83.
Another acquisition technique used in proteomics even if not widespread in this field is the single reaction monitoring mode (SRM). It is common in triple quadrupoles instruments (QqQ) or in ion traps for quantitative analysis. SRM finds proteomics applications in ion traps and orbitrap instruments for quantitative analysis of targeted peptides.
Theoretically, DIA should include both the advantages of DDA and SRM modes82.
1.4.3.4 Mass Spectrometry instruments for proteomics
To perform LC-MS based proteomics analysis is essential to have a high-resolution mass spectrometer. Mass analyzers that can provide high resolution analysis are: FTICR, TOF and Orbitrap trend by mass spectrometers producers to configure hybrid instruments to improve mass accuracy, sensitivity and resolution. The main configurations found in proteomics are: LTQ-Orbitrap, Qq-Orbitrap, LTQ-FTICR, QqQ-FTICR, Q-TOF and IT-TOF29.
1.4.3.5 Starting material and sample preparation for shotgun proteomics
For shotgun proteomics analysis, the starting material could be different and coming from various origin. Usually, the principle biological matrices are analysed such as biological fluids, cells and tissue. The development of working protocols is a key point of the proteomics. Focusing on the analysis of the intracellular content, some sample preparations steps and tips are maintained. So, proteins were extracted after cells culture and then lysed. Afterwards, proteins extracted were firstly reduced to break disulphide bonds, and then alkylated to reduce the sulfhydryl free moieties. The lest steps are the proteins digestion into peptides and the sample desalting before the injection in the LC-MS84,85,86.
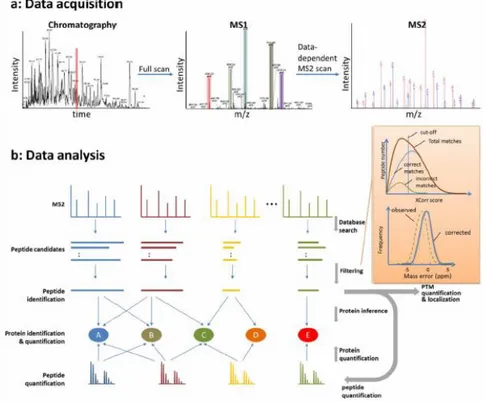
37 1.4.3.6 Bioinformatics
As previously mentioned in 1.4.3.2 section, bioinformatics tools are gaining popularity and are still under development to make data analysis reproducible, easy to do and accurate. Since the publication of SEQUEST in 199487, a software for the protein identification from peptides mixture, numerous other algorithms were published (88,89,90). However, the integration of software packages into pipelines helped the scientists to standardize and simplify the proteomics analysis workflow. Nowadays, there are various pipeline, by which: Proteomics Pipeline (IP2,
http://integratedproteomics.com/), pFind Studio (http://pfind.ict.ac.cn/)91,92,
ProteomeDiscoverer (www.thermoscientific.com), MaxQuant
(http://maxquant.org/)93. A representative pathway of data acquisition and
bioinformatic data analysis pathway is reported in figure 9.
Figure 9. Representative LC-MS/MS data acquisition and bioinformatic data analysis pipeline for protein identification and
38
References:
1. Martin, A. J. P. & Synge, R. L. M. A new form of chromatogram employing two liquid phases. Biochem. J. London 1906 35, 1358–1368 (1941).
2. Ettre, L. S. & Sakodynskii, K. I. M.S. Tswett and the discovery of chromatography. I: Early work (1899-1903). Chromatographia 35, 223–231 (1993).
3. J. C. Horvath, J. C. & Lipsky, S. R. Use of liquid ion exchange chromatography for the separation of organic compounds. Nature 211, 748 (1966).
4. Horvath, C. G., Preiss, B. A. & Lipsky, S. R. Fast Liquid Chromatography: An Investigation of Operating Parameters and the Separation of Nucleotides on Pellicular Ion Exchangers. Anal. Chem. 39, 1422–1428 (1967).
5. Fanali, S., Haddad, P. R., Poole, C. F., Schoenmakers, P. & Lloyd, D. Liquid Chromatography: Fundamentals and Instrumentation. Elsevier, Amsterdam, (2013).
6. van Deemter, J. J., Zuiderweg, F. J. & Klinkenberg, A. Longitudinal diffusion and resistance to mass transfer as causes of onnideality in chromatography. Chem. Eng. Sci. 5, 271–289 (1956).
7. Gross, J. H. Mass Spectrometry. Springer (2017).
8. Fekete, S., Oláh, E. & Fekete, J. Fast liquid chromatography: The domination of core-shell and very fine particles. J. Chromatogr. A 1228, 57–71 (2012). 9. González-Ruiz, V., Olives, A. I. & Martín, M. A. Core-shell particles lead the
way to renewing high-performance liquid chromatography. TrAC- Trends Anal. Chem. 64, 17–28 (2015).
10. Ali, I., Al-Othman, Z. A. & Al-Za’abi, M. Superficially porous particles columns for super fast HPLC separations. Biomed. Chromatogr. 26, 1001– 1008 (2012).
39
chromatographic approaches applied for fast and high resolution separations: Theory and practice. J. Chromatogr. A 1408, 1–14 (2015).
12. Salisbury, J. J. Fused-core particles: A practical alternative to sub-2 micron particles. J. Chromatogr. Sci. 46, 883–886 (2008).
13. Gritti, F. et al. Performance of columns packed with the new shell particles, Kinetex-C18. J. Chromatogr. A 1217, 1589–1603 (2010).
14. Bianchi, M., Canavesi, R., Aprile, S., Grosa, G. & Del Grosso, E. Troxerutin, a mixture of O-hydroxyethyl derivatives of the natural flavonoid rutin: Chemical stability and analytical aspects. J. Pharm. Biomed. Anal. 150, 248– 257 (2018).
15. Yang, P., McCabe, T. & Pursch, M. Practical comparison of LC columns packed with different superficially porous particles for the separation of small molecules and medium size natural products. J. Sep. Sci. 34, 2975–2982 (2011).
16. Guillarme, D., Ruta, J., Rudaz, S. & Veuthey, J. L. New trends in fast and high-resolution liquid chromatography: A critical comparison of existing approaches. Anal. Bioanal. Chem. 397, 1069–1082 (2010).
17. Fekete, S., Schappler, J., Veuthey, J. L. & Guillarme, D. Current and future trends in UHPLC. TrAC - Trends Anal. Chem. 63, 2–13 (2014).
18. Chawla, G. & Ranjan, C. Principle, Instrumentation, and Applications of UPLC: A Novel Technique of Liquid Chromatography. Open Chem. J. 3, 1– 16 (2016).
19. Drake, J. M. et al. Phosphoproteome Integration Reveals Patient- Specific Networks in Prostate Cancer. Cell 166, 1041–1054 (2016).
20. Nitarska, J. et al. Article A Functional Switch of NuRD Chromatin Remodeling Complex Subunits Regulates Mouse Cortical Article A Functional Switch of NuRD Chromatin Remodeling Complex Subunits Regulates Mouse Cortical Development. CellReports 17, 1683–1698 (2016).
40
21. Hoffmann, E. D. & Stroobant, V. Mass Spectrometry-Principles and Applications. Mass spectrometry reviews (Wiley, 2007).
22. Balogh, M. Debating Resolution and Mass Accuracy in Mass Spectrometry. Spectroscopy 19, 34–40 (2004).
23. Paul, W., Reinhard, H. P. & von Zahn U. Das elektrische massenfilter als massenspektrometer und isotopentrenner, Z. Phys. 152 143–182 (1958). 24. Plass, W. R., Li, H. & Cooks, R. G. Theory, Simulation and Measurement of
Chemical Mass Shifts in RF Quadrupole Ion Traps. Int. J. Mass Spectrom.
228, 237–267 (2003).
25. Yoshinari, K. Theoretical and numerical analysis of the behavior of ions injected into a quadrupole ion trap mass spectrometer. 223, 215–223 (2000). 26. Makarov, A. Electrostatic axially harmonic orbital trapping: A high-performance technique of mass analysis. Anal. Chem. 72, 1156–1162 (2000). 27. Kingdon, K. H. A Method for Neutralizing the Electron Space Charge by
Positive Ionization at Very Low Pressures. Phys. Rev. 21, 408–418 (1923). 28. Hu, Q. et al. The Orbitrap: A new mass spectrometer. J. Mass Spectrom. 40,
430–443 (2005).
29. Yates, J. R., Ruse, C. I. & Nakorchevsky, A. Proteomics by Mass Spectrometry: Approaches, Advances, and Applications. Annu. Rev. Biomed. Eng. 11, 49–79 (2009).
30. Taylor, G. Disintegration of Water Drops in an Electric Field. Proc. R. Soc. A Math. Phys. Eng. Sci. 280, 383–397 (1964).
31. Dole, M. et al. Molecular beams of macroions. J. Chem. Phys. 49, 2240–2249 (1968).
32. Mann, M., Meng, C. K. & Fenn, J. B. Interpreting Mass Spectra of Multiply Charged Ions. Anal. Chem. 61, 1702–1708 (1989).
33. Fenn, J. B., Mann, M., Meng, C. K., Wong, S. F. & Whitehouse, C. M. Electrospray ionization for mass spectrometry of large biomolecules. Science
41
246, 64–71 (1989).
34. Tanaka, K. et al. Protein and polymer analyses up to m/z 100 000 by laser ionization time-of-flight mass spectrometry. Rapid Commun. Mass Spectrom.
2, 151–153 (1988).
35. Fenn, J. B. Electrospray wings for molecular elephants (Nobel lecture). Angew. Chemie-Int. Ed. 42, 3871–3894 (2003).
36. Tanaka, K. The Origin of Macromolecule Ionization by Laser Irradiation (Nobel Lecture). Angew. Chemie Int. Ed. 42, 3860–3870 (2003).
37. Bruins, A. P., Covey, T. R. & Henion, J. D. Ion spray interface for combined liquid chromatography/atmospheric pressure ionization mass spectrometry. Anal. Chem. 59, 2642–2646 (1987).
38. Ikonomou, M. G., Blades, A. T. & Kebarle, P. Electrospray-Ion Spray: A Comparison of Mechanisms and Performance. Anal. Chem. 63, 1989–1998 (1991).
39. Wilm, M. S. & Mann, M. Electrospray and Taylor-Cone theory, Dole’s beam of macromolecules at last? Int. J. Mass Spectrom. Ion Process. 136, 167–180 (1994).
40. Gibson, G. A. A., Mugo, S. M. & Oleschuk, R. D. Nanoelectrospray emitters: trends and perspective. Mass Spectrom. Rev. 28, 918–936 (2009).
41. Moreno-González, D., Alcántara-Durán, J., Addona, S. M. & Beneito-Cambra, M. Multi-residue pesticide analysis in virgin olive oil by nanoflow liquid chromatography high resolution mass spectrometry. J. Chromatogr. A
1562, 27–35 (2018).
42. Casado, J., Santillo, D. & Johnston, P. Multi-residue analysis of pesticides in surface water by liquid chromatography quadrupole-Orbitrap high resolution tandem mass spectrometry. Anal. Chim. Acta 1024, 1–17 (2018).
43. Chen, Y. A. & Hsu, K. Y. Development of a LC-MS/MS-based method for determining metolazone concentrations in human plasma: Application to a
42
pharmacokinetic study. J. Food Drug Anal. 21, 154–159 (2013).
44. Jian, W., Shou, W., Edom, R. W., Weng, N. & Zhu, M. Mass Spectrometry Handbook: LC-MS in Drug Metabolism and Industry Perspective. (2012). 45. Canavesi, R., Aprile S., Giovenzana G.B., Di Sotto A., Di Giacomo S., Del
Grosso E. & Grosa G. New insights in oxybutynin chemical stability: Identification in transdermal patches of a new impurity arising from oxybutynin N-oxide rearrangement.. Eur. J. Pharma Sci. 84, 123–131 (2016). 46. Ojanperä, I., Kolmonen, M. & Pelander, A. Current use of high-resolution mass spectrometry in drug screening relevant to clinical and forensic toxicology and doping control. Anal. Bioanal. Chem. 403, 1203–1220 (2012). 47. Nordgren, H. K., Holmgren, P., Liljeberg, P., Eriksson, N. & Beck, O. Application of Direct Urine LC-MS-MS Analysis for Screening of Novel Substances in Drug Abusers. J. Anal. Toxicol. 29, 234–239 (2005).
48. Hugo, J. et al. Forced degradation of L-(+)-bornesitol, a bioactive marker of Hancornia speciosa: Development and validation of stability indicating UHPLC-MS method and effect of degraded products on ACE inhibition. J. Chromatogr. B Anal. Technol. Biomed. Life Sci. 1093–1094, 31–38 (2018). 49. Adaway, J. E. & Keevil, B. G. Therapeutic drug monitoring and LC-MS/MS.
J. Chromatogr. B Anal. Technol. Biomed. Life Sci. 883–884, 33–49 (2012). 50. Del Grosso, E., Aprile, S. & Grosa, G. Forced degradation study of
thiocolchicoside: Characterization of its degradation products. J. Pharm. Biomed. Anal. 61, 215–223 (2012).
51. Canavesi, R., Aprile, S., Varese, E. & Grosa, G. Development and validation of a stability-indicating LC-UV method for the determination of pantethine and its degradation product based on a forced degradation study. J. Pharm. Biomed. Anal. 97, 141–150 (2014).
43
52. ICH Guidelines Q1A (R2), Stability Testing of New Drug Substances and Products: Text and Methodology, International Conference on Harmonisation (2005).
53. ICH Q2A (R1), Validation of Analytical Procedures: Text and Methodology, International Conference on Harmonisation, (2005).
54. Bortolotto, V., Mancini F., Mangano G., Salem R., Xia E., Del Grosso E., Bianchi M., Canonico P.L., Polenzani L. & Grilli M. Proneurogenic Effects of Trazodone in Murine and Human Neural Progenitor Cells. ACS Chem. Neurosci. 8, 2027–2038 (2017).
55. Gu, G. et al. Validation of an LC-MS/MS method for simultaneous quantification of venlafaxine and its five metabolites in rat plasma and its application in a pharmacokinetic study. J. Chromatogr. B Anal. Technol. Biomed. Life Sci. 1087–1088, 29–35 (2018).
56. Abdallaha, I. A., Hammell, D. C., Stinchcomb, A. L. & Hassan, H. E. A fully validated LC-MS/MS method for simultaneous determination of nicotine and its metabolite cotinine in human serum and its application to a pharmacokinetic study after using nicotine transdermal delivery systems with standard heat application in adul. J. Chromatogr. B Anal. Technol. Biomed. Life Sci. 1020, 67–77 (2016).
57. Thevis, M., Thomas, A. & Schänzer, W. Current role of LC-MS(/MS) in doping control. Anal. Bioanal. Chem. 401, 405–420 (2011).
58. Song, Q. & Naidong, W. Analysis of omeprazole and 5-OH omeprazole in human plasma using hydrophilic interaction chromatography with tandem mass spectrometry (HILIC-MS/MS) - Eliminating evaporation and
reconstitution steps in 96-well liquid/liquid extraction. J. Chromatogr. B Anal. Technol. Biomed. Life Sci. 830, 135–142 (2006).
59. Xue, Y. J., Liu, J. & Unger, S. A 96-well single-pot liquid-liquid extraction, hydrophilic interaction liquid chromatography-mass spectrometry method for
44
the determination of muraglitazar in human plasma. J. Pharm. Biomed. Anal.
41, 979–988 (2006).
60. Paíga, P. et al. Development of a SPE-UHPLC-MS/MS methodology for the determination of non-steroidal anti-inflammatory and analgesic pharmaceuticals in seawater. J. Pharm. Biomed. Anal. 106, 61–70 (2015). 61. Pensi, D. et al. First UHPLC–MS/MS method coupled with automated online
SPE for quantification both of tacrolimus and everolimus in peripheral blood mononuclear cells and its application on samples from co-treated pediatric patients. J. Mass Spectrom. 52, 187–195 (2017).
62. Rahman, M. et al. HybridSPE: A novel technique to reduce phospholipid-based matrix effect in LC-ESI-MS Bioanalysis. J. Pharm. Bioallied Sci. 4, 267 (2012).
63. Eerkes, A., Shou, W. Z. & Naidong, W. Liquid/liquid extraction using 96-well plate format in conjunction with hydrophilic interaction liquid chromatography-tandem mass spectrometry method for the analysis of fluconazole in human plasma. J. Pharm. Biomed. Anal. 31, 917–928 (2003). 64. Food and Drug Administration. Guidance for Industry: Bioanalytical Method
Validation. U.S. Department of Health and Human Services (2001).
65. Matuszewski, B. K., Constanzer, M. L. & Chavez-Eng, C. M. Strategies for the assessment of matrix effect in quantitative bioanalytical methods based on HPLC-MS/MS. Anal. Chem. 75, 3019–3030 (2003).
66. Wilkins, M. R. et al. From proteins to proteomes: Large scale protein identification by two-dimensional electrophoresis and amino acid analysis. Nat. Biochnology 14, 61–65 (1996).
67. James, P. Protein identification in the post-genome era: The rapid rise of proteomics. Q. Rev. Biophys. 30, 279–331 (1997).
68. Aebersold, R. & Mann, M. Mass spectrometry-based proteomics. Nature 402, 198–207 (2003).
45
69. Zhang Yaoyang, Fonslow Bryan R., Shan Bing, Baek, Moon-Chang & Yates, J. R. III. Protein Analysis by Shotgun/Bottom-up Proteomics. Chem Rev 113, 2343–2394 (2013).
70. Bensimon, A., Heck, A. J. R. & Aebersold, R. Mass Spectrometry–Based Proteomics and Network Biology. Annu. Rev. Biochem. 81, 379–405 (2012). 71. Yates, J. R. III Mass spectrometry and the age of the proteome. J. Mass
Spectrom. 33, 1–19 (1998).
72. Yates, J. R. III Mass Spectral Analysis in Proteomics. Annu. Rev. Biophys. Biomol. Struct. 33, 297–316 (2004).
73. Kall, L., Canterbury, J. D., Weston, J., Noble, W. S. & MacCoss, M. J. Semi-supervised learning for peptide identification from shotgun proteomics datasets. Nat. Methods 923–925 (2007). doi:2007
74. Spivak, M., Weston, J., Bottou, L., Käll, L. & Noble, W. S. Improvements to the Percolator algorithm for peptide identification from shotgun proteomics data sets. J. Proteome Res. 8, 3737–3745 (2009).
75. Wilm, M. & Mann, M. Analytical properties of the nanoelectrospray ion source. Anal. Chem. 68, 1–8 (1996).
76. Hillenkamp, F. & Karas, M. Mass spectrometry of peptides and proteins by matrix-assisted ultraviolet laser desorption/ionization. Methods Enzymol. 193, 280–295 (1990).
77. Olsen, J. V et al. Higher-energy C-trap dissociation for peptide modification analysis. Nat. Methods 4, 709–712 (2007).
78. Zubarev, R. A. et al. Electron Capture Dissociation for Structural Characterization of Multiply Charged Protein Cations than the conventional MS / MS methods. Anal. Chem. 72, 563–573 (2000).
79. Zubarev, R. Protein primary structure using orthogonal fragmentation techniques in Fourier transform mass spectrometry. Expert Rev. Proteomics
46
80. Syka, J. E. P., Coon, J. J., Schroeder, M. J., Shabanowitz, J. & Hunt, D. F. Peptide and protein sequence analysis by electron transfer dissociation mass spectrometry. Proc. Natl. Acad. Sci. 101, 9528–9533 (2004).
81. Aebersold, R. & Mann, M. Mass-spectrometric exploration of proteome structure and function. Nature 537, 347–355 (2016).
82. Doerr, A. DIA mass spectrometry. Nat. Methods 12, 35 (2014).
83. Gillet, L. C. et al. Targeted Data Extraction of the MS/MS Spectra Generated by Data-independent Acquisition: A New Concept for Consistent and Accurate Proteome Analysis. Mol. Cell. Proteomics 11, O111.016717 (2012). 84. Giansanti, P., Tsiatsiani, L., Low, T. Y. & Heck, A. J. R. Six alternative proteases for mass spectrometry-based proteomics beyond trypsin. Nat. Protoc. 11, 993–1006 (2016).
85. Liu, Q. et al. Molecular basis for blue light-dependent phosphorylation of Arabidopsis cryptochrome 2. Nat. Commun. 8, 1–12 (2017).
86. Kelstrup, C. D., Young, C., Lavallee, R., Nielsen, M. L. & Olsen, J. V. Optimized fast and sensitive acquisition methods for shotgun proteomics on a quadrupole orbitrap mass spectrometer. J. Proteome Res. 11, 3487–3497 (2012).
87. Eng, J. K., McCormack, A. L. & Yates, J. R. III. An approach to correlate tandem mass spectral data of peptides with amino acid sequences in a protein database. J. Am. Mass Spectrom. 5, 976–989 (1994).
88. Kim, S. & Pevzner, P. A. MS-GF+ makes progress towards a universal database search tool for proteomics. Nat. Commun. 5, 1–10 (2014).
89. Craig, R. & Beavis, R. C. TANDEM: Matching proteins with tandem mass spectra. Bioinformatics 20, 1466–1467 (2004).
90. Mueller, L. N. et al. SuperHirn - A novel tool for high resolution LC-MS-based peptide/protein profiling. Proteomics 7, 3470–3480 (2007).
47 Nat. Methods 9, 904–909 (2012).
92. Lu, S. et al. Mapping native disulfide bonds at a proteome scale. Nat. Methods
11, 1–8 (2015).
93. Cox, J. & Mann, M. MaxQuant enables high peptide identification rates, individualized p.p.b.-range mass accuracies and proteome-wide protein quantification. Nat. Biotech. 26, 1367–1372 (2008).
48
49
2. Outline of the thesis
Especially in the last 25 years, a lot of efforts and investments were made in R&D to develop new LC-MS components and instruments. The huge adaptability of the technique and the unlimited applications of the LC-MS, pushed the scientists in the pathway of breaking limits and achieving new records.
In this context, the main aim of the thesis was to show the versatility of LC-MS in the chemistry and biology research. LC-MS was applied in medicinal chemistry for degradation studies of active compounds, in quantitative bioanalysis of small molecules in plasma, intracellular and extracellular compartments and in proteomics to study post translational modifications.
To perform all of these LC-MS analyses different instruments were used, suitable to achieve the results required.
The liquid chromatography instrument used were HPLC and UHPLC systems equipped with quaternary pumps operating with micro- and nano-flow rates. Mass Spectrometry ion source was constituted by the electrospray ion source (ESI) or by the nano-ESI. Moreover, MS detectors were constituted by a linear ion trap, or an hybrid instrument constituted by a quadrupole, linear trap and orbitrap.
The instruments were working in both positive and negative ionizations mode with different scans type: full MS, MS2, MS3, SRM (Single reaction monitoring), MRM (Multiple Reaction Monitoring) and DDA (Data Dependent acquisition) mode. Fragmentations method involved were CID (Collision Induced Dissociation) and HCD (Higher-energy Collisional Dissociation).
In these three working years, the LC-MS tool was applied to the following projects: (1) Investigation of troxerutin (TRX) degradation pathway, degradation products characterization and identification of TRX stability indicator.
50
(2) Development of a bioanalytical LC-MS method for the quantification of adenosine 5’-tetraphosphate (Ap4) and other five analytes related to Nicotinamide phosphoribosyltransferase (NAMPT) metabolism in different biological matrices. (3) Development of a quantitative LC-MS bioanalytical method for the quantitation of serotonin extracellular levels of murine neural progenitor cells.
(4) Identification, quantification and investigation of post-translational modifications (PTMs) on Nicotinamide phosphoribosyltransferase (NAMPT) in murine melanoma B16 cells.
51
52
3. Troxerutin, a mixture of O-hydroxyethyl derivatives
of the natural flavonoid rutin: Chemical stability and
analytical aspects
Michele Bianchi, Rossana Canavesi, Silvio Aprile, Giorgio Grosa,
Erika Del Grosso
*Laboratory of Pharmaceutical Analysis, Department of Pharmaceutical Sciences, Università del Piemonte Orientale, Largo Donegani 2, 28100 Novara, Italy
*Corresponding Author Graphical Abstract: •3 degradation products characterized (D1, D2 and D3) •D1 stability indicator Forced degradation study (LC-MS)
•Chromatographic separation with an alkaline mobile phase (Kinetex EVO C18 column)
•Validation performed following ICH guidelines
Development and validation of a LC-UV stability indicating method •Quantification of triHer in TRX mixture
•Evaluation of the presence of D1
LC-UV method applied to API and pharmaceutical solid dosage form of TRX
TROXERUTIN
•Purification and characterization of Hers in TRX mixture
53
Abstract:
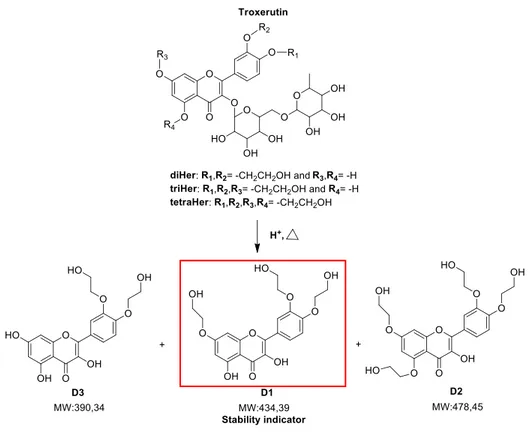
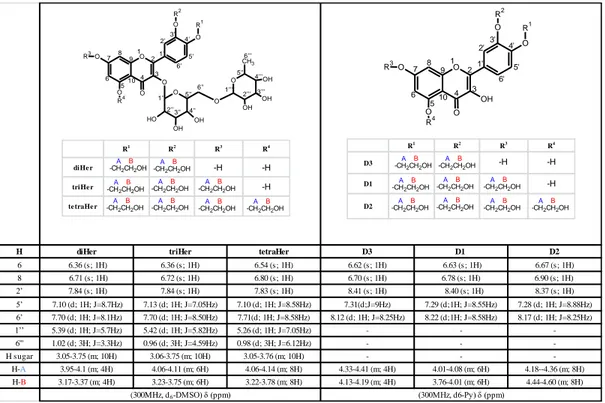
Troxerutin (TRX) is a mixture of semisynthetic hydroxyethylrutosides (Hers) arising from hydroxyethylation of rutin, a natural occurring flavonoid. TRX is commonly used for its anti-oxidant and anti-inflammatory properties in chronic venous insufficiency and other vascular disorders. In recent studies, the protective effects of TRX in Alzheimer’s disease, colon carcinogenesis and hepatocellular carcinoma are emerged. However, the chemical stability of TRX has never been studied. Hence, the aims of the work were to study the TRX chemical stability through a forced degradation study and to develop and validate a new stability indicating LC-UV method for determination of TRX. In order to perform the study, TRX stability was tested in various stress conditions analysing the degradation samples by LC–MS. Three degradation products (DPs; D1, D2 and D3, 3’,4’,7-Tri-O-(β-hydroxyethyl)quercetin, 3’,4’,5,7-Tetra-O-(β-hydroxyethyl)quercetin and 3’,4’-Di-O-(β-hydroxyethyl)quercetin respectively) arising from degradation in acidic conditions were identified and synthesized: among them, D1 resulted the stability indicator for hydrolytic degradation. Furthermore, a stability-indicating LC-UV method for simultaneous determination of triHer (3’,4’,7-Tri-O-(β-hydroxyethyl)rutin, the principal component of the mixture) and D1 was developed and validated. The LC-UV method consisted in a gradient elution on a Phenomenex Kinetex EVO C18 (150 × 3 mm, 5 µm) with acetonitrile and ammonium bicarbonate buffer (10 mM, pH 9.2). The method was linear for triHer (20–60 µg mL−1) and D1 (5.1–35 µg mL−1). The intraday and inter-day precision were determined and expressed as RSDs: all the values were ≤ 2% for both triHer and D1. The method demonstrated also to be accurate and robust and the average recoveries were 98.8 and 97.9% for triHer and D1, respectively. Moreover, the method resulted selective and specific for all of the components present in the degradation pattern of TRX (diHer (3’,4’-Di-O-(β-hydroxyethyl)rutin), triHer, tetraHer
(3’,4’,5,7-Tetra-O-(β-54
hydroxyethyl)rutin), D3, D1 and D2) and it was successfully applied for the stability studies of both drug substances and drug products.
1. Introduction:
Troxerutin (TRX) is a mixture of semisynthetic O-hydroxyethylrutosides (Hers), arising from hydroxyethylation of rutin1, a natural occurring flavonoid mainly extracted from Dimorphandra gardneriana2 and Sophora japonica3. As reported in the European Pharmacopoeia4, TRX contains minimum 80% of tris(hydroxyethyl)rutin as the principal component, while tetrakis(hydroxyethyl)rutin, bis(hydroxyethyl)rutin and mono(hydroxyethyl)rutin are also described as related components present in minor amount. In therapy, TRX is currently used against sign and symptoms of chronic venous insufficiency and other vascular disorders such as hemorrhoids, microangiopathy and diabetic retinopathy, also displaying effectiveness and safety in elderly patients and pregnant women. TRX acts mainly on the microvascular endothelium by means of its anti-oxidant and anti-inflammatory properties reducing hyperpermeability, edema and improving microvascular perfusion and microcirculation5–8. Furthermore, recent studies proposed TRX as a promising agent with neuroprotective effects on cognitive deficits9, in Alzheimer’s disease10 and in Parkinson’s disease11. Besides a number of other beneficial effects have been highlighted, such as the chemoprevention in colon carcinogenesis12, hepato-cellular carcinoma13 and as adjuvant with 5-Fluorouracil in gastric cancer14, a potential role against neuropathic pain15, cardioprotective and antifibrogenic effects16,17, its use as adjuvant in radiotherapy to protect normal tissues18 and in the reduction of the severity of myocardial ischemia-reperfusion injury19. As a matter of fact, despite the lots of recent published in vitro and in vivo studies establishing new potential biological properties of this drug, TRX is always reported as triHer single isomer (3’,4’,7-tris(hydroxyethyl)rutin), without considering the presence, in the mixture, of the other Hers20–23. At the best of our
55
knowledge, the literature reports very few papers dealing with the characterization of TRX related compounds, whose number can theoretically reach fifteen24,25; moreover, none deals with the chemical stability of TRX. This is probably due to the fact that TRX composition depends on the synthetic strategy and on the difficulties in the chromatographic separation of this mixture26. In this complex scenario, the aims of the present study were first to establish the intrinsic chemical stability of a batch of TRX through a forced degradation study in parallel with the characterization both of the principal pure isolable Hers and their degradation products (DPs); secondly to develop and validate a new LC-UV stability indicating method for the simultaneous quantification of TRX as its major component triHer and its stability indicator, D1.
2. Experimental:
2.1. Reagents and chemicals
Acetonitrile (HPLC grade), ammonium bicarbonate, 25% ammonia solution, sodium hydroxide, dimethyl sulfoxide, 30% w/w hydrogen peroxide solution, hydrochloric acid, sodium borohydride, 4,4_-azobis(4-cyanopentanoic acid), methanol,
tetrahydrofuran, ethyl acetate, isopropanol, acetic acid, pyridine-d5,dichloromethane,
potassium bromide, ascorbic acid, titanium dioxide, gum arabic, corn starch, talc, polivinylpyrrolidone (PVP), colloidal silica, magnesium stearate, calcium carbonate, kaolin, orange yellow (E110), indigotine (E132), sucrose, sodium chloride were purchased from Sigma-Aldrich (Milano, Italy); silica gel 60 (0.040-0.063 mm) purchased from Merck (Darmstadt, Germany).Water (HPLC grade) was obtained from Milli-Q RO system. Carbazochrome (lot n° CA-073-03) was obtained as gift sample from Pharmafar S.r.l. (Torino, Italy). Batches of Troxerutin (TRX, batches n°: 335539190, 33553C024, 33553T164), were kindly gifted by Acarpia (Torino, Italy). Venolen® capsules (batch n° 120054), Fleboside® ampoules (batch n°A107)