43. E.-Y. Bergsdorf, A. A. Zdebik, T. J. Jentsch, J. Biol. Chem. 284, 11184 (2009).
44. M. Duffield, G. Rychkov, A. Bretag, M. Roberts, J. Gen. Physiol. 121, 149 (2003).
45. C. Lossin, A. L. George Jr., Adv. Genet. 63, 25 (2008). 46. A. Pangrazio et al., Hum. Mutat. 31, E1071 (2010). 47. E. Cleiren et al., Hum. Mol. Genet. 10, 2861 (2001). 48. S. G. Waguespack et al., J. Bone Miner. Res. 18, 1513
(2003).
49. A. Frattini et al., J. Bone Miner. Res. 18, 1740 (2003). 50. D. H. Hryciw, G. Y. Rychkov, B. P. Hughes, A. H. Bretag,
J. Biol. Chem. 273, 4304 (1998).
51. S. Hebeisen, C. Fahlke, Biophys. J. 89, 1710 (2005). 52. A. Accardi et al., J. Gen. Physiol. 126, 563 (2005). 53. H. Jayaram, A. Accardi, F. Wu, C. Williams, C. Miller,
Proc. Natl. Acad. Sci. U.S.A. 105, 11194 (2008).
54. H. H. Lim, C. Miller, J. Gen. Physiol. 133, 131 (2009).
55. W. P. Jencks, Catalysis in Chemistry and Enzymology (Dover Publications, New York, 1987).
56. J. J. Matsuda, M. S. Filali, M. M. Collins, K. A. Volk, F. S. Lamb, J. Biol. Chem. 285, 2569 (2010). 57. E. A. Richard, C. Miller, Science 247, 1208 (1990). 58. O. Jardetzky, Nature 211, 969 (1966).
59. We thank the staff at beamline X29 (National Synchrotron Light Source, Brookhaven National Laboratory) and K. R. Rajashankar and K. Perry at beamline 24ID-C (Advanced Photon Source, Argonne National Laboratory) for assistance at the synchrotron, members of the MacKinnon laboratory for helpful dicussions, and P. Yuan for comments on the manuscript. R.M. is an Investigator in the Howard Hughes Medical
Institute. The x-ray crystallographic coordinates and structure factors have been deposited in the Protein Data Bank with accession identification number 3ORG.
Supporting Online Material
www.sciencemag.org/cgi/content/full/science.1195230/DC1 Materials and Methods
Figs. S1 to S6 Table S1 References Movie S1
16 July 2010; accepted 17 September 2010 Published online 30 September 2010; 10.1126/science.1195230
Include this information when citing this paper.
Diversity of Human Copy Number
Variation and Multicopy Genes
Peter H. Sudmant,1* Jacob O. Kitzman,1* Francesca Antonacci,1Can Alkan,1Maika Malig,1 Anya Tsalenko,2Nick Sampas,2Laurakay Bruhn,2Jay Shendure,1
1000 Genomes Project,† Evan E. Eichler1,3‡
Copy number variants affect both disease and normal phenotypic variation, but those lying within heavily duplicated, highly identical sequence have been difficult to assay. By analyzing short-read mapping depth for 159 human genomes, we demonstrated accurate estimation of absolute copy number for duplications as small as 1.9 kilobase pairs, ranging from 0 to 48 copies. We identified 4.1 million “singly unique nucleotide” positions informative in distinguishing specific copies and used them to genotype the copy and content of specific paralogs within highly duplicated gene families. These data identify human-specific expansions in genes associated with brain development, reveal extensive population genetic diversity, and detect signatures consistent with gene conversion in the human species. Our approach makes ~1000 genes accessible to genetic studies of disease association.
C
opy number–variable genes in humanstend to map to duplicated sequences (i.e., segmental duplications) (1–4), but neither the copy number nor the locus identity of these genes can be accurately assessed with existing hybridization-based experimental methods. This bias stems from the inability to discriminate subtle differences over the full range of copy number by array comparative genomic hybridization (CGH) and a lack of informative probes for these regions in single-nucleotide polymorphism (SNP) geno-typing platforms (5). This bias is more pronounced in cases where more copies of a duplicated gene are present, because multicopy integer states are difficult to resolve proportionally, resulting in a lack of understanding of the true extent of human copy number variation. As a result, the most dy-namic and variable genes are frequently excluded from genome-wide association studies (6). We have developed a method to survey whole-genome shot-gun sequence data to accurately assay specific du-plicated genes and gene families for copy numberfrom data generated primarily from the 1000 Ge-nomes Project (7).
Results
Read depth can be used to predict accurately the copy number of duplicated genes within high-coverage human genomes (8). We applied this method to perform a copy number variant (CNV) analysis of 159 human genomes sequenced using the Illumina platform, including 15 high-coverage human ge-nomes (12.3 to 43×) of diverse ethnicity and 141 low-coverage genomes (1.5 to 7×) from the 1000 Genomes Project representing three populations (9). For each genome, reads were mapped to a repeat-masked human reference genome (build 36) with the mrsFAST aligner, which returns all possible map-ping locations of a read. Read depth profiles were then constructed and corrected for biases introduced in library construction. Copy number prediction was performed by regression against a standard curve of regions of known copy (9). Using this approach, we estimated the absolute copy number genome-wide for windows of 3000 nonrepetitive bases each and generated heatmaps displaying copy number for all 159 human genomes (Fig. 1, A and B).
Because many of these genomes (table S1) were sequenced at low coverage, we tested the accuracy of our copy number predictions using three orthog-onal methods of experimental validation (Fig. 2A) (9). We assessed our ability to detect simple events (gains, losses, and homozygous losses) from 2270
events [median size 39.6 kilobase pairs (kbp), smallest event 1.6 kbp] across 109 common in-dividuals. This demonstrated a concordance of 94 to 100%, dependent on the size and type of the event (fig. S20). To assess our ability to genotype multicopy number states, we performed 59 fluo-rescent in situ hybridization (FISH) experiments across 21 larger loci, ranging in copy from 2 to 48 (9). Of our copy number estimates, 93% (55 out of 59) were withinT1 of the number of FISH signals observed in interphase nuclei (e.g., Fig. 1A). Be-cause FISH-based estimates are problematic when copy number exceeds 10, we designed a series of quantitative PCR (QPCR) assays to assess dynamic range response. These showed high correlation with our read depth–based estimates, with 7 out of 9 assays having a correlation coefficient of r > 0.92 (9). Read depth– and QPCR-based copy number estimates for the 1.9-kbp gene CCL3L1 across 150 individuals were concordant (r = 0.95), with both methods capturing the population-specific distri-butions of copy number at this locus (fig. S26).
CNV landscape diversity. We constructed genome-wide copy number maps across 159 ge-nomes at 3-kbp resolution (Fig. 1, A and B) to assay the full extent of large-scale copy number variation among human populations. We identified 952 large CNVs greater than 50 kbp across 159 individuals (9). As expected, events of increasing size occur with progressively lower frequency. We noted that the majority of large events (55%, 522 out of 952) overlapped segmental duplications. Out of all events, 47% (452 of 952) were common, being observed in more than eight individuals (>5% of genomes). Association with segmental du-plications also strongly influenced CNV frequen-cy. Events entirely outside segmental duplications were generally rare, with 71% (390 of 546) de-tected in three or fewer individuals (<2% of ge-nomes). By contrast, 91% (461 of 506) of most CNVs overlapping segmental duplications were observed in more than three individuals, consistent with recurrent variation in these dynamic regions. We identified 22 regions longer than 100 kbp that showed evidence of significant copy number differences between Asians, Europeans, and Africans [average Vstof >0.2; (table S9)] (10). These included duplications flanking the 17q21.31 MAPT locus, which has been associated with positive selection, rapid evolutionary turnover, and neurological
1
Department of Genome Sciences, University of Washington School of Medicine, Seattle, WA 98195, USA.2Agilent
Tech-nologies, Santa Clara, CA 95051, USA.3Howard Hughes
Med-ical Institute, Seattle, WA 98195, USA. *These authors contributed equally to this work. †A full list of participants and institutions is available in the SOM online.
‡To whom correspondence should be addressed. E-mail: [email protected]
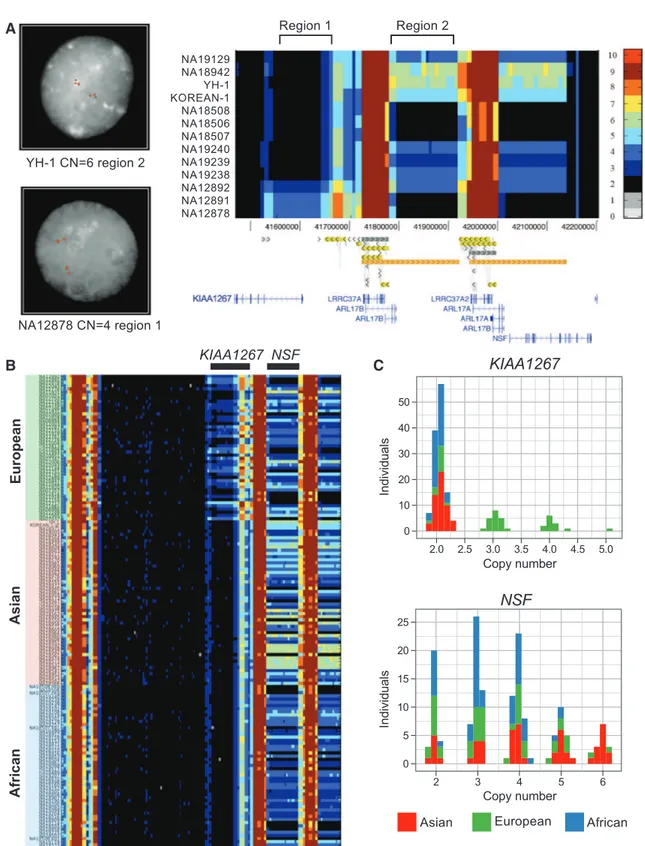
disease (11). Analyses of the region across pop-ulations (9) revealed that although the inversion of this locus and its associated duplication are largely restricted to European-Mediterranean populations with 20% allele frequency, duplications overlap-ping the KIAA1267 gene were more common and definitive of populations of European origin (found in 33 out of 46 individuals at 50% allele fre-quency) but were nonexistent in all other ethnic
groups examined (Fig. 1, B and C). Based on the extent of phased copy number change, we predicted and confirmed a short (155-kbp) duplication occur-ring at 20% allele frequency and a long version (205 kbp) at 30% allele frequency in Europeans (9). Distal to this locus, we identified a larger, more– copy number–polymorphic region (ranging from 2 to 6 copies). This more distal, population-stratified duplication encompassed the first 13 exons of the
N-ethylmaleimide-sensitive (NSF) gene and shows increased copy number among Asians with the six-copy state occurring at ~25% frequency (13 out of 54 individuals) (Fig. 1, B and C). It is noteworthy that this gene is preferentially expressed in the human nervous system; reduction in its expres-sion is associated with schizophrenia (12), and disruptions of its Drosophila ortholog lead to de-fective synaptic transmission (13).
Fig. 1. Landscape of hu-man copy number varia-tion. (A) CNV heatmap of a 734-kbp duplicated region flanking the 17q21.31 MAPT locus in 13 individ-uals (11 sequenced to high coverage). Read depth– based copy number (CN) es-timations (3-kbp windows) are indicated by color (scale provided to the right). FISH at two separate loci vali-dates these absolute CN predictions across five indi-viduals (9). (B) Copy number landscape of the 17q21.31 locus across three differ-ent populations showing marked population stratifi-cation (159 genomes ana-lyzed). A European-enriched duplication overlaps the geneKIAA1267andispresent on two haplotypes—a long form (205 kbp) and a short form (155 kbp). A 210-kbp duplication of theNSF gene ranges from two to six copies with increased copy number in Asians. For val-idation with array CGH, see fig. S31. (C) Copy number frequency histograms of theKIAA1267 and NSF du-plications based on median read depth predict discrete copies. Duplications of the KIAA1267 locus are specific to Europeans at a frequen-cy of 72%. 25% of Asians have six copies ofNSF.
A
Additionally, we identified regions that are du-plicated in most human individuals but previously were incorrectly classified as diploid in the
ref-erence genome, including 10 regions of >100 kbp each. We identified 173 segmentally duplicated regions for which the majority of genomes have
a copy number greater than that of the reference genome. We thus have established a copy number baseline in humans, allowing more accurate geno-typing from SNP microarrays. These data may be used in conjunction with single-channel intensity data from previous array CGH experiments to develop a calibration curve specifically for each region of the genome, allowing multiallelic loci to be more robustly genotyped on array-based platforms (Fig. 2A) (9). This CNV landscape di-versity map may also be used to select an ideal reference genome (from the 1000 Genomes cat-alog) to maximize discriminatory power in array CGH studies, which will open more complex, copy number–polymorphic regions of the genome to further experimental characterization (Fig. 2B). Gene copy number diversity and evolution. To assess the impact of copy number variation spe-cifically on the coding portion of the genome, we genotyped the absolute copy of 25,832 individual RefSeq gene models (University of California, Santa Cruz, genome browser). As expected, our read depth assessment predicts that 99.3% of
hu-50 40 30 20 10 15 20 25 30 A B
Fig. 2. Validation and application. (A) Single-channel array CGH data are highly correlated (r = 0.95) with read depth–based genotypes for the highly duplicated TBC1D3 gene (copy number range 5 to 53). Note the reduced copy number of this gene family among Europeans (color coding as in Fig. 1C). (B) Heatmap of a 340-kbp region proximal to the fascioscapulohumeral muscular dystrophy (FSHD) region on chromosome 4 identifies a polymorphic segmental duplication ranging from 5 to 8 copies. In the human reference genome (build 36) this segment is annotated as a single copy (i.e., unique), but all humans carry duplications mapping to chromosomes 4, 13, 14, and 21.
Fig. 3. Human gene family copy number diversity and evolution. (A) The genes most stratified by copy number in the human genome on the basis ofVstanalysis of Euro-pean, African, and Asian pop-ulations. (B) Human-specific gene family expansions. copy number 2 4 6 8 10 12 LILRA3 (0.63) TRY6 (0.52) NPEPPS (0.50) PDE4DIP (0.48) UGT2B17 (0.47) ESPNP (0.46) LOC644172 (0.45) LGALS9B (0.44) CCL3L1 (0.44) PRSS3 (0.42) DHFRL1 (0.41) CCL4 (0.40) CFHR1 (0.39) NOTCH2NL (0.38) HLA−DPA1 (0.37) RDM1 (0.37) OCLN (0.37) KRT14 (0.36) PGA5 (0.36) PDXDC1 (0.36) PCDHB13 (0.33) MGC57346 (0.33) ACOT2 (0.31) C17orf58 (0.31) PRH1 (0.30) KIAA1267 (0.29) ADAM5P (0.29) GTF2H2 (0.28) UBE2QP2 (0.27) RHD (0.27) 20 40 60 80 100 120 140 TBC1D3C (0.53) DHX40P (0.46) LOC100286793 (0.40) C2orf78 (0.39) SPDYE6 (0.32) POM121L4P (0.30) ZNF717 (0.29) FAM157A (0.28) LRRC37A3 (0.28) LOC392196 (0.27) NPIPL3 (0.26) RASA4P (0.26) (Vst) 2 4 6 8 10 NCF1 (0.00) ARHGEF5 (0.25) FCGR1A (0.03) GTF2IRD2 (0.02) HIST2H2BF (0.02) SRGAP2 (0.01) NAIP (0.10) GTF2H2 (0.28) GPRIN2 (0.02) CHRFAM7A (0.05) C10orf57 (0.09) DUSP22 (0.10) FRMPD2 (0.00) LOC154761 (0.06) FAM115C (0.07) NCRNA00152 (0.03) ZNF322B (0.04) HYDIN (0.01) PTPN20A (0.01) SERF1A (0.01) SMN1 (0.02) ARHGAP11A (0.00) RBM8A (0.04)
Great Apes Humans
copy number A B Population Asian European Yoruba Population Asian Chimp European Gorilla HG18 Neanderthal Orangutan Yoruba
man gene models outside of segmental duplica-tions show a median copy number of two. Limit-ing our set to all genes greater than 10 kbp, we find that 91% of human genes are fixed as diploid in all 159 humans examined. Of the copy number– variable gene families, including those within seg-mental duplications, we found that 80% vary be-tween 0 and 5 copies, which suggests that extreme variation is limited to only a few gene families. We identified the 56 most variable gene families in humans (variance >3.0 among combined popula-tions), ranging in median copy from 5 to ~368 (fig. S33 and table S7). These genes were dramatically enriched for segmental duplications [odds ratio (OR) = 311.3, P < 2.2 × 10⁻¹⁶, Fisher’s exact test]. In 19 of these cases, no individual exhibited a copy number less than or equal to that of the reference genome, which suggests that some of these gene duplicates are underrepresented in the reference. We found 44“hidden” duplicated gene families (fig. S33 and table S6), including the rapidly evolv-ing and high-copy ANKRD (about six missevolv-ing haploid copies), NBPF (more than nine missing copies) and NPIP (about five missing copies) gene families. The missing members of these gene fam-ilies should be targeted for sequence finishing in order to more accurately capture the architecture and diversity of the human genome.
Because significant differences in allele fre-quency can be a signature of selection, we searched for genes with the most extreme differences in copy among the HapMap populations. These include the Yoruba people in Ibadan, Nigeria (YRI), Utah res-idents with ancestry from northern and western Europe (CEU), Japanese in Tokyo, Japan (JPT), and Han Chinese in Beijing, China (CHB). We used the Vststatistic (10) and identified 64 gene families [Vst> 0.2; (Fig. 3A and table S8)]. These genes mapped almost exclusively to segmental duplications (OR = 72.0, P < 2.2 × 10⁻¹⁶) and ranged in copy from 2 to 368 (77%, 49 out of 64 with <12 copies). However, we observed no sig-nificant correlation between Vstand copy number (P = 0.199), which indicated that the differences between populations were not an artifactual product of higher copy numbers. In general, the African YRI showed greater variance in stratified gene copy number compared with either Europeans or Asians (P < 1 × 10⁻⁴and P < 1.2 × 10⁻⁹after multiple-testing correction; Welch’s one-tailed t test), in-cluding genes with known stratification between populations, such as LILRA3 (14) and UGTB17 (15). One of the most stratified genes identified was CCL3L1 (fig. S26), for which the importance of accurate multiallelic copy number genotyping has been recently highlighted because of conflicting reports of association with HIV susceptibility (16). In addition, we discovered stratification among several previously uncharacterized gene families, many of which show reduced copy in Europeans and Asians compared with Africans (Fig. 3A) (9). We characterized the evolutionary context of human gene copy number variation by compara-tively analyzing short-read depth data from a gorilla, a chimpanzee, and an orangutan (9). We identified
53 gene families with increased copy number with-in the human lwith-ineage, 23 of which were diploid with-in each of the great apes, and 8 of which appear to be fixed in humans (Fig. 3B, fig. S38, and tables S10 and S11). Consistent with an origin after the human-ape divergence, the human-specific dupli-cations and expansions displayed higher sequence identity than most duplicated genes (97.0% and 98.7%, respectively; P < 3.5 × 10⁻⁵, Welch’s one-tailed t test). Human-specific duplications include the genes GPRIN2 and SRGAP2, which have been implicated in neurite outgrowth and branching (17, 18); the brain-specific HYDIN2 gene, associated with micro and macrocephaly (19); DRD5, a dopa-mine D5 receptor; the GTF2I transcription factors whose deletion has been associated with visual-spatial and sociability deficits among Williams-Beuren syndrome patients (20, 21); duplication of the SMN1 genes, at which copy increases amelio-rate the severity of spinal muscular atrophy (SMA) deletions; and duplication of the CHRNA7 locus on 15q13.2 recently implicated in cases of intel-lectual disability and epilepsy (22, 23). We note that the fixed duplications we identified at HYDIN and GPRIN2 are not annotated in the reference and thus represent“hidden” duplications (fig. S40).
A singly unique nucleotide (SUN) identifier map. Although our read depth–based genotyping provides absolute, rather than relative, copy number measurements and improved dynamic range rela-tive to other platforms, it still lacks specificity with-in highly homologous segmental duplications. To discriminate among these paralogous sequences, we focused on the positions in the reference ge-nome at which they diverge (Fig. 4A). We identified 4.07 × 10⁶SUN positions within high-identity duplicated regions (table S2). SUNs are a distinct class of paralogous sequence variants that unique-ly tag a specific paralog. By definition, the density
of these markers diminishes with increasing dupli-cation identity, yet we estimated that ~70% of duplications contain sufficient SUN density to allow paralog-specific genotyping (9). Nearby SNPs or rare variants could disrupt short-read mapping at SUN positions, which could confound copy number estimation of the tagged paralog. We examined the extent of such effects among SUNs in 12 unrelated individuals sequenced to high cov-erage (mean = 23.4×). Reads from these individ-uals were mapped to SUN positions, stringently requiring perfect 36-bp matches so as to exclude contamination between paralogous sequences. Es-sentially all autosomal SUNs (99.7%) were present in at least one individual, with most (84.8%) present in all 12 individuals (9). Among these, we noted a strong enrichment for SNPs (274,245 SNPs from the dbSNP version 130, OR = 1.6, P < 2.2 × 10⁻¹⁶), which suggested that some SUNs may be misannotated as allelic variants (1, 24).
Paralog-specific copy number. We used our SUN database to complement our estimates of total copy number by developing genome-wide maps of paralog-specific copy number (psCN). At locations uniquely identified by an overlapping SUN, we counted the number of reads perfectly matching and, as before, inferred copy number using a linear model trained on regions of known copy. We validated the accuracy of our psCN estimates by specifically analyzing 383 high-confidence deletion intervals that had been de-tected and fully resolved by capillary sequencing on the same individuals (4). We found that 99.4% (308 out of 310) of deletions within unique re-gions and 93.2% (68 of 73) of deletions within duplicated regions were accurately predicted, which underscored the specificity of this approach.
Paralog-specific copy number genotyping re-vealed CNVs within duplicated gene families. For Fig. 4. Paralog-specific
copy number resolu-tion and genotyping. (A) Schematic showing SUN identifiers among four high-identity dupli-cations. SUNs (orange) uniquely distinguish one duplicated copy from all others, in contrast to paralogous sequence var-iants (PSVs, blue), which may be shared among copies. (B) Resolving du-plication mirror effects with paralog-specific geno-typing. Total read depth and array CGH fail to dis-tinguish the origin of copy number variation between two high-identity (98.5%) segmental duplications mapping to chromosome 1p13.1 and 7q11.23.
SUN read-depth mapping, however, predicts that copy number variation is restricted to 7q11.23 and not 1p13.1. FISH on these samples confirms copy number gains and losses on 7q11.23 (fig. S51).
A
example, at the complement factor H (CFH) locus, we detected deletions in close agreement with their known boundaries (T~6 kbp on average, fig. S60) (4). Genotyping the resulting psCN at these inter-vals across all 159 samples reveals overall dele-tion allele frequencies for CFHR3/1 and CFHR1/4 of 29% and 4%, respectively, with elevated fre-quency among Africans at both deletions (25). We also identify rare genotypes, such as a reciprocal, single-copy amplification of CFHR1/4 in a single African individual (ABT) and a deletion with novel breakpoints in a single Asian individual (NA18563). Copy number analysis from read mapping depth can potentially lead to misassignment of CNV events to the wrong copy because of cross-mapping between highly identical sequences. Using SUNs to resolve paralogous copies, we re-genotyped 406 large (>50 kbp) CNV events over-lapping segmental duplications, previously called on the basis of total read mapping depth compar-isons (9). We find that 60% (245 out of 406) of these regions show no signature of variation using SUNs and hence represent variation at one of the homologous loci. This“mirror” effect arises from cross-mapping between highly identical sequences but can be resolved by leveraging the SUN tags (Fig. 4B). Similarly, we found that a recently re-ported set of CNVs identified by CGH (2)
con-tained a significant fraction of calls (1547 out of 4412, 35.1%) within duplicated sequences that show no evidence of paralog-specific CNV.
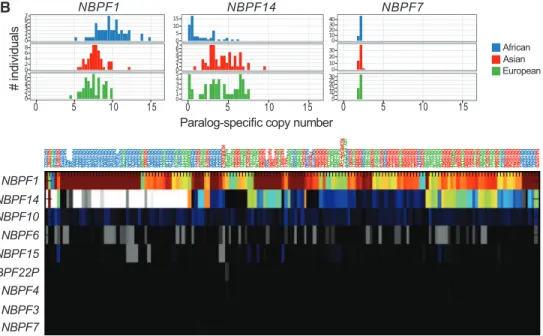
Paralog-specific gene family diversity. A prerequisite to understanding the function of high-ly duplicated gene families is the ability to genotype them for both their copy and content. Using our psCN approach, we reassessed 990 human genes partially or completely contained within segmental duplications (Fig. 5A). This analysis allowed us to distinguish two distinct classes of paralogs: 49.2% of duplicate genes which appear largely copy-invariant within the human species, and the remainder, which show extensive variation in copy number with some bias toward gain or loss. A particularly peculiar set of variable genes are those mapping to“core duplicons” (26) which have undergone recent bursts of expansion within the human lineage, including NPIP, NBPF (Fig. 5B), and others (27). We confirmed these genes’ human-specific expansion but also observed them to be stratified among human populations (fig. S38 and Fig. 3A). We also observed more localized psCN patterns, with small patches showing recip-rocal gain and loss but remaining unchanged in total copy, a signature consistent with interlocus gene conversion (i.e., unidirectional transfer of ge-netic information between duplicate copies)
[re-viewed in (28)]. We validated a small number of these events and confirmed this signature at the Rh blood group antigen genes RHD and RHCE (fig. S71) (9, 29). A scoring metric found 78 regions with a score exceeding that of RHD/RHCE with a significant excess of this signature relative to shuffled controls (P < 2.2 × 10⁻¹⁶, one-sided Kolmogorov-Smirnov). Consistent with known examples and mechanisms of gene conversion, this was nearly exclusive to high-identity duplica-tions (>95% ID) and was preferential to nearby tandem duplications (≤1 Mbp).
Discussion
We have leveraged next-generation sequence data to explore some of the most complex genetic var-iation in the human species and show that we can reliably predict absolute copy number without bias. More important, these data allowed us to assess the copy and content of specific duplicated genes. Ne-vertheless, several limitations remain. Some genes (~30%) show too little paralogous variation or are too small to be reliably genotyped; in other cases, the paucity of markers combined with the low se-quence coverage led to uncertainty in copy number accuracy (our analysis suggests that at least 8× genome-wide sequence coverage is required to achieve copy number accuracy above 97%). Finally,
A B
Fig. 5. Paralog-specific gene family copy number variation. (A) Paralog-specific copy number estimates of 990 duplicated genes show that most, on average, are diploid within the human species (median psCN = 2T 0.5), and nearly half show little variation in copy. Among 49.2% of duplicated genes, deviation from the median copy occurs rarely (≤5% of individuals). By contrast, genes outside of segmental duplications and other known regions of copy number variation are nearly devoid of common CNVs (blue), even when genotyping with randomly subsampled positions (gray) to mimic the restricted density of SUN markers within duplicated genes. (B) Population stratification and paralog-specific copy variability of a human expanded-gene family of unknown function,NBPF (neuroblastoma breakpoint gene family). Certain paralogs (e.g., NBPF1) are highly amplified, extremely variable, and stratified by population, whereas others are nearly fixed and diploid (e.g.,NBPF7).
complexity that it is difficult to interpret the under-lying pattern of genetic variation (e.g., fig. S34). Through our analysis, we identified that dupli-cated regions are more likely to be stratified between human populations when compared with copy num-ber variation within unique regions of the genome. For example, 59 (92%) of the top 64 stratified gene families overlap segmental duplications (P < 2.2 × 10⁻¹⁶). Remarkably, many of these highly polymor-phic genes map to duplications that promote recur-rent rearrangements associated with intellectual disability, autism, schizophrenia and epilepsy. We hypothesize that the extreme polymorphism may contribute to genomic instability associated with disease and may predispose certain populations to different chromosomal rearrangements (30).
We have also defined the ~ 49% of gene du-plicates that are largely invariant in copy among humans. Although this is based only on an as-sessment of 159 genomes from select populations, the fact that this fraction of genes remains copy number invariant in a milieu of recurrent unequal crossover suggests functional importance. Among these, we find a number of genes involved in neu-rological development and disease. We note that many of these duplicated genes are themselves incomplete and may represent nonprocessed pseudogenes, which may modulate the expression of the ancestral gene. The characterization of the most recently duplicated genes should facilitate identification of those that acquired new functions (neofunctionalization) versus those that have be-come pseudogenes or have partitioned their func-tion among duplicate copies (31).
variation maps and where it does not within regions of high sequence identity facilitates breakpoint de-lineation within duplications, allowing us to refine the intervals associated with structural variants such as the recurrent, schizophrenia-associated deletion on 15q11.2 (fig. S70) (32). We anticipate that over-laying our SUN map with functional genomics data (e.g., chromatin immunoprecipitation sequenc-ing or RNA-seq) may begin to resolve the epige-netic and expression landscape of duplicated regions and the ~1000 genes therein that have been largely inaccessible to genetic study of disease (33).
References and Notes
1. J. A. Bailey et al., Science 297, 1003 (2002). 2. D. F. Conrad et al., Nature 464, 704 (2010). 3. A. J. Iafrate et al., Nat. Genet. 36, 949 (2004). 4. J. M. Kidd et al., Nature 453, 56 (2008).
5. G. M. Cooper, T. Zerr, J. M. Kidd, E. E. Eichler, D. A. Nickerson, Nat. Genet. 40, 1199 (2008).
6. N. Craddock et al.; Wellcome Trust Case Control Consortium, Nature 464, 713 (2010). 7. 1000 Genomes project, Nature, 28 October 2010,
10.1038/nature09534.
8. C. Alkan et al., Nat. Genet. 41, 1061 (2009). 9. Materials and methods are available as supporting
material on Science Online.
10. R. Redon et al., Nature 444, 444 (2006). 11. H. Stefansson et al., Nat. Genet. 37, 129 (2005). 12. K. Mirnics, F. A. Middleton, A. Marquez, D. A. Lewis,
P. Levitt, Neuron 28, 53 (2000).
13. L. Pallanck, R. W. Ordway, B. Ganetzky, Nature 376, 25 (1995).
14. K. Hirayasu et al., Am. J. Hum. Genet. 82, 1075 (2008). 15. Y. Xue et al., Am. J. Hum. Genet. 83, 337 (2008). 16. T. J. Urban et al., Nat. Med. 15, 1110 (2009). 17. L. T. Chen, A. G. Gilman, T. Kozasa, J. Biol. Chem. 274,
26931 (1999).
18. S. Guerrier et al., Cell 138, 990 (2009).
21. L. Edelmann et al., J. Med. Genet. 44, 136 (2007). 22. A. J. Sharp et al., Nat. Genet. 40, 322 (2008). 23. M. Shinawi et al., Nat. Genet. 41, 1269 (2009). 24. X. Estivill et al., Hum. Mol. Genet. 11, 1987 (2002). 25. G. S. Hageman et al.; AMD Clinical Study Group, Ann.
Med. 38, 592 (2006).
26. Z. Jiang et al., Nat. Genet. 39, 1361 (2007). 27. T. Marques-Bonet et al., Nature 457, 877 (2009). 28. J. M. Chen, D. N. Cooper, N. Chuzhanova, C. Férec,
G. P. Patrinos, Nat. Rev. Genet. 8, 762 (2007). 29. H. Innan, Proc. Natl. Acad. Sci. U.S.A. 100, 8793 (2003). 30. F. Antonacci et al., Hum. Mol. Genet. 18, 2555 (2009). 31. A. Force et al., Genetics 151, 1531 (1999). 32. H. Stefansson et al.; GROUP, Nature 455, 232 (2008). 33. T. A. Manolio et al., Nature 461, 747 (2009). 34. We thank M. Ventura and M. Ross for sharing
unpublished data; C. Lee for technical assistance; C. Campbell, J. Kidd, P. Green, and M. Hoopman for discussion; and T. Brown for manuscript preparation assistance. This work was supported by a Natural Sciences and Engineering Research Council of Canada Fellowship (P.H.S.), an NSF Graduate Research Fellowship (J.O.K.), and NIH grant HG004120 to E.E.E. E.E.E. is an Investigator of the Howard Hughes Medical Institute. E.E.E is on the scientific advisory board for Pacific Biosciences. A.T., N.S., and L.B. are employees of Agilent Technologies. J.S. is a member of the scientific advisory boards of Tandem Technologies, Stratos Genomics, Good Start Genetics, and Adaptive TCR. Sequence and array data are deposited at the NCBI under accessions SRP002878, SRP003500, SRP000031, SRP000032, and GSE24334.
Supporting Online Material
www.sciencemag.org/cgi/content/full/330/6004/641/DC1 Materials and Methods
SOM Text Figs. S1 to S73 Tables S1 to S16 References
26 August 2010; accepted 4 October 2010 10.1126/science.1197005
REPORTS
Rate of Gas Phase Association
of Hydroxyl Radical and
Nitrogen Dioxide
Andrew K. Mollner,1Sivakumaran Valluvadasan,2Lin Feng,1Matthew K. Sprague,1 Mitchio Okumura,1* Daniel B. Milligan,2William J. Bloss,2Stanley P. Sander,2* Philip T. Martien,3Robert A. Harley,3* Anne B. McCoy,4* William P. L. Carter5*
The reaction of OH and NO2to form gaseous nitric acid (HONO2) is among the most influential in atmospheric chemistry. Despite its importance, the rate coefficient remains poorly determined under tropospheric conditions because of difficulties in making laboratory rate measurements in air at 760 torr and uncertainties about a secondary channel producing peroxynitrous acid (HOONO). We combined two sensitive laser spectroscopy techniques to measure the overall rate of both channels and the partitioning between them at 25°C and 760 torr. The result is a significantly more precise value of the rate constant for the HONO2formation channel, 9.2 (T0.4) × 10−12cm3molecule−1s−1(1 SD) at 760 torr of air, which lies toward the lower end of the previously established range. We demonstrate the impact of the revised value on photochemical model predictions of ozone concentrations in the Los Angeles airshed.
T
he gas phase three-body association reac-tion of hydroxyl radical (OH) with ni-trogen dioxide (NO2) to form nitric acid (HONO2) (Eq. 1a)OH + NO2+ M→ HONO2+ M
(where M is N2or O2in air) is important through-out the lower atmosphere. It sequesters reactive
hydrogen (HOx, the sum of OH and peroxides) and reactive nitrogen (NOx, the sum of NO2and NO) as long-lived nitric acid, shortening their at-mospheric lifetimes and slowing catalytic cycles responsible for photochemically driven formation of air pollution in the troposphere and ozone de-pletion in the stratosphere.
The impact of the reaction in Eq. 1a is es-pecially notable in polluted air masses, where its rate affects the formation of pollutants includ-ing ozone (O3), nitric acid, and fine particulate nitrate. This reaction leads to lower ozone
pro-1Arthur Amos Noyes Laboratory of Chemical Physics, Division
of Chemistry and Chemical Engineering, California Institute of Technology, Pasadena, CA 91125, USA.2Jet Propulsion Laboratory, California Institute of Technology, Pasadena, CA 91109, USA.3Department of Civil and Environmental
Engi-neering, University of California, Berkeley, CA 94720–1710, USA.4Department of Chemistry, The Ohio State University,
Columbus, OH 43210, USA.5College of Engineering, Center
for Environmental Research and Technology, University of California, Riverside, CA 92521, USA.
*To whom correspondence should be addressed. E-mail: [email protected] (M.O.); [email protected] (S.P.P.); [email protected] (R.A.H.); [email protected]. edu (A.B.M.); [email protected] (W.P.L.C.)