Contents lists available atScienceDirect
Critical Reviews in Oncology / Hematology
journal homepage:www.elsevier.com/locate/critrevoncSecond-line cabozantinib versus nivolumab in advanced renal cell
carcinoma: Systematic review and indirect treatment comparison
Camillo Porta
a, Cezary Szczylik
b, Roman Casciano
c, Shuai Fu
c, Billy Amzal
c, Johanna Lister
c,⁎,
Helene Karcher
c, Jie Meng
c, Monika Neumann
c, Jerome Dinet
d,1aDepartment of Internal Medicine, University of Pavia and Division of Translational Oncology, IRCCS Istituti Clinici Scientifici Maugeri, via S. Maugeri 10, 27100 Pavia, Italy
bWarsaw Medical University, Żwirki i Wigury 61, 02-091 Warsaw, Poland
cAnalytica Laser, Certara Company, 5th Floor Audrey House, 16-20 Ely Place, London EC1N, UK dIpsen Pharma SAS, 65 quai Georges Gorse, Boulogne-Billancourt, Ile-de-France, France
A R T I C L E I N F O Keywords:
Individualized cancer therapy Treatment algorithm Advanced modeling
A B S T R A C T
Background: Nivolumab and cabozantinib, two new treatment options for previously-treated advanced/meta-static renal cell carcinoma (aRCC), have recently been approved.
Methods: Two independent reviewers performed study selection, data extraction, and risk of bias assessment. Indirect treatment comparisons were carried out by directly assessing HR differences and statistical modeling of Kaplan-Meier curves from these two trials.
Results: Publications identified showed that no head-to-head comparisons had been carried out. Two indirect treatment comparisons used agreed that there was no significant difference in OS between cabozantinib and nivolumab and that cabozantinib significantly improved PFS compared to nivolumab.
Conclusions: The field of aRCC treatments is evolving rapidly, creating opportunities for individualized treat-ments and challenges for clinicians to keep up with the evidence. In lieu of availability of direct comparisons of all options, advanced modeling results presented herein can help to inform and improve personalized treat-ments.
1. Introduction
Each year, 4.4 out of every 100,000 people worldwide are diag-nosed with renal cell carcinoma (RCC) (Znaor et al., 2015). Curative surgery is an option for those patients who are diagnosed with localized early stage tumors. First-line treatment of advanced/metastatic disease includes sunitinib, pazopanib, bevacizumab in combination with in-terferon, and temsirolimus for those patients with poor prognosis. Second-line treatment options had been quite limited until recently and included agents such as axitinib, everolimus and sorafenib. The anti-PD1 monoclonal antibody nivolumab and cabozantinib, which targets vascular endothelial growth factor receptor (VEGFR) and the MET and AXL receptor tyrosine kinases along with other potentially relevant targets in RCC, have recently been approved for second-line use (Powles et al., 2016; Escudier et al., 2016).
Healthcare decision-makers require comparisons of all relevant treatments, including those that may not have undergone head-to-head comparison in pivotal trials. With increasing amounts of data at hand, these decisions become more and more evidence based. Clinicians must have a deep understanding of all relevant factors and make decisions taking the best evidence, patient preferences, and other specific cir-cumstances into account, a task that needs to be acknowledged to be still more of an art than science.
Concrete questions in clinical practice include identification of the best fast antitumor activity and best strategy for ideal long-term out-comes. If, for example, a given patient requires a quick response, then an agent with a faster response pattern may be a better choice com-pared to slow-responding, long-acting treatments. On the contrary, if it is possible to wait for the occurrence of a long-term response, the choice of a slower-acting treatment may be justified. Medical oncologists have
https://doi.org/10.1016/j.critrevonc.2018.10.004
Received 5 July 2018; Received in revised form 18 October 2018; Accepted 18 October 2018
⁎Corresponding author.
E-mail addresses:[email protected](C. Porta),[email protected](C. Szczylik),[email protected](R. Casciano),
[email protected](S. Fu),[email protected](B. Amzal),[email protected](J. Lister),[email protected](H. Karcher), [email protected](J. Meng),[email protected](M. Neumann),[email protected](J. Dinet).
1Former employee.
1040-8428/ © 2018 The Authors. Published by Elsevier B.V. This is an open access article under the CC BY-NC-ND license (http://creativecommons.org/licenses/BY-NC-ND/4.0/).
already faced this dilemma in the field of BRAF wild type melanomas, and the empirical conclusion drawn to date is that a combination of targeted agents is felt as preferable in patients needing substantial and quick tumor shrinkage, whilst in other patients, the long-term efficacy of immunotherapy treatments suggests the use of immunotherapies (CancerNet, 2018).
If the available evidence consists of multiple randomized controlled trials (RCTs), assessments of relative efficacy can be made by pairwise indirect treatment comparison (ITC) or network meta-analysis (NMA). Survival data-based ITCs are often limited to comparisons of hazard ratios (HRs), a method that does not require assumptions regarding the distribution of data. However, the use of HRs for comparing different treatments assumes that the underlying hazards always remain pro-portional to each other. This assumption can be tested statistically, and Amzal et al. (2017)showed that using direct comparison of HRs as a method for summarizing survival from the CheckMate025 study is not ideal, because the HRs vary over time.
An alternative comparison method is to compare full Kaplan-Meier survival curves after fitting them to parametric functions. The study by Amzal et al. compared cabozantinib and nivolumab as part of a wider network of comparators, using five parametric survival functions (log-normal, loglogistic, Weibull, Gompertz and exponential distributions). To further improve the fit of the model to the data at hand, additional parametric models can be explored (Jansen, 2011). In this study, we assessed whether fractional polynomial distributions more closely fit the underlying study data and used this method to compare the cabo-zantinib and nivolumab progression-free survival (PFS) and overall survival (OS) data.
2. Material and methods 2.1. Literature search
This literature review was conducted according to the methods outlined in the Cochrane Handbook for Systematic Reviews of Interventions (Higgins and Green, 2011). MEDLINE (MEDLINE, 2018), EMBASE (Elsevier, 2018), and Cochrane Central Registry of Controlled Trials (CENTRAL) (CENTRAL, 2018) were searched on 12 June 2017. No time or language restrictions were imposed. The search protocols, which were registered in the PROSPERO register of systematic reviews (CRD4201706885) (PROSPERO, 2018), are shown in the supplemen-tary information. Search terms included extensive controlled vocabu-lary (MeSH and EMTREE) in various combinations, supplemented with keywords including renal cell carcinoma, cabozantinib, and nivolumab. We limited our search to RCTs by applying a Cochrane Highly Sensitive Search Strategy filter for identifying randomized trials in MEDLINE: sensitivity-and precision-maximizing version (PubMed, 2018). We screened systematic literature reviews and health technology assess-ment (HTA) report reference lists manually for any additional studies, carried out additional searches of gray literature (e.g., manufacturer websites, materials provided during HTA assessments) to complement and update the findings.
2.2. Study selection
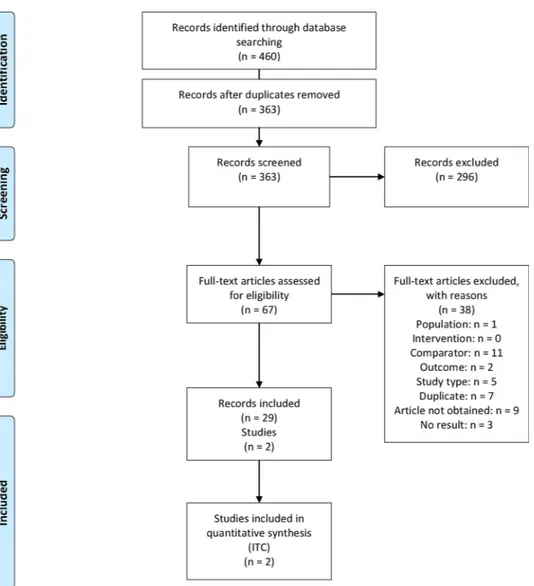
RCTs were included that met the following criteria: 1. Patients with previously treated advanced or metastatic RCC; 2. at least one of the interventions was cabozantinib or nivolumab; and 3. the study reported PFS, OS or both. It is very difficult to design a search algorithm that is both sensitive and specific for second-line use, given the many ter-minologies used to indicate such use and the possibility of trials with mixed total populations and sub-group analyses. We therefore did not attempt to restrict our computer search algorithm to second-line trials. Instead, we included all trials in the first screening and assigned the
task to remove first-line trials to the human reviewers (Figure 1). After duplicates were removed, two reviewers independently screened titles and abstracts and determined eligibility from the full texts. All dis-crepancies were resolved by consensus or with a third reviewer if re-quired.
2.3. Data extraction and risk of bias assessment
Data were independently extracted by two reviewers from each eligible study. For multiple publications or data sources of the same study, we used the longest reported follow-up data reporting results and confidence intervals (CI) for analysis. This included unpublished METEOR trial data based on the final, October 2, 2016, data cut made available by the trial sponsor (NICE, 2018). Subgroup analyses from the same study were not considered (e.g., subgroup of Japanese patients from CheckMate025). Study inclusion and exclusion criteria, baseline population characteristics, OS, and PFS outcomes were extracted. We extracted point estimate of median survival and HRs and corresponding CI. Risk of bias of individual studies was assessed by the two reviewers independently using the Cochrane risk of bias tool (Cochrane Bias, 2018), with disagreements being solved by consensus.
2.4. Published studies
Our systematic literature search identified 460 citations, of which 97 were duplicates. A further 296 records were excluded after title and abstract screening, leaving 67 citations for full text review (Figure 1). We found 29 eligible publications, referring to two studies: METEOR (NCT01865747) and CheckMate025 (NCT01668784), and additional U.S. Food and Drug Administration approval reports presenting data from these two studies. The underlying trials were the same for the PFS and OS endpoints (Supplementary Figure 1). The main publication for CheckMate025 isMotzer et al. (2015), which reports OS results after a minimum of 14 months of follow-up. A publication by Plimack et al., 2016 (NCRI, 2019) reports OS results after a minimum of 26 months of follow-up, however the OS HR had not changed, and no CIs or Kaplan-Meier data were reported. For this reason, we used the Motzer et al., 2015 publication for these analyses. Baseline patient characteristics are summarized in SupplementaryTable 1. For the METEOR trial, we used the final, unpublished data cut (as of October 2, 2016) for overall survival data, which was made available directly by the sponsor and has been used during the UK appraisal process (NICE, 2018). The PFS data for METEOR were taken from the final published RCT report (Choueiri et al., 2016). The PFS (Choueiri et al., 2016) and OS (NICE, 2018) re-sults reported in METEOR and CheckMate025 (Motzer et al., 2015) studies are shown inTable 1.
2.5. Data synthesis and analysis
We analyzed evidence for two outcomes: PFS and OS. We performed indirect comparison with the traditionally used method described by Bucher et al. (1997), which assumes transitivity and proportionality of hazards. It requires only mean HRs and their standard error from the two studies to make an indirect comparison. We report mean HR and its 95% CI. We used the method published by Guyot et al. (Guyot et al., 2012) to estimate the number of deaths and the number of patients censored every month from the published Kaplan-Meier curves. We compared survival curves using parametric methods (Ouwens et al., 2010) and fractional polynomials (Jansen, 2011). While these methods do not rely on the proportional hazard assumption, they are based on the general assumptions common to all indirect comparison methods of similarity, homogeneity, and consistency of the underlying trials (Kiefer et al., 2015). Possible violations of these assumptions are discussed further below. For comparison of survival curves, we performed a
Bayesian ITC using a Markov Chain Monte Carlo method on WinBUGs (WinBUGS, 2018). The analysis used a fixed-effects model, because only one trial provided direct evidence for each comparison. Model fits were compared using the deviance information criterion (DIC). Relative treatment effects are reported using adjusted survival curves for PFS and OS outcomes, along with corresponding 95% credible intervals, which are the Bayesian equivalent of CIs (Kruschke and Liddell, 2017).
3. Results
3.1. Quality of evidence
Due to the small size of the network and its geometry, with one study per comparison, a quantitative heterogeneity assessment, such as the one using the local and global Higgins coefficients, was not possible.
Figure 1. PRISMA flow diagram for systematic literature review.
Table 1
Reported PFS and OS results from METEOR and CheckMate025 studies: median (months) and HRs. METEOR, final RCT results (Choueiri et al., 2016) and October 2, 2016 data
cut (NICE, 2018) CheckMate025, pivotal trial publication (Motzer et al., 2015) ITC result(current study) Cabo, median (months) [95% CI] Evero, median (months) [95% CI] HR [95% CI]
p-value Nivo, median(months) [95% CI]
Evero, median (months) [95% CI]
HR [95% CI]
p-value Cabo vs. Nivo,HR [95% confidence interval] p-value PFS 7.4 [6.6–9.1] 3.9[3.7–5.1] 0.51[0.41–0.62]; P < 0.0001 4.6 [3.7–5.4] 4.4[3.7–5.5] 0.88[0.75–1.03]; P = 0.11 HR 0.58[0.34–0.98] p = 0.04 OS 21.4 [18.6–23.5] 17.1[14.9–18.9] 0.70[0.58–0.85]; P < 0.0002 25.0 [21.8–n.e.] 19.6[17.6–23.1] 0.73[98.5% 0.57–0.93]; P = 0.002 HR 0.96 [0.57–1.62] p = 0.437
Abbreviations: Cabo – cabozantinib; Evero – everolimus; HR – hazard ratio; CI – Confidence Interval; Nivo – nivolumab; ITC – indirect treatment comparison; PFS – progression-free survival; OS – overall survival; n.e. – not estimable.
We therefore performed a qualitative heterogeneity assessment based on a side-by-side comparison of patient inclusion and exclusion criteria, baseline characteristics, and of the risk of bias of the two studies in-cluded in the network. The overall risk of bias of using the identified studies for an indirect comparison was low according to our assessment (Supplementary Figure 2).
3.2. Progression-free survival
The comparison of PFS curves produced consistent results until approximately month 20 (Figure 2). The model that provided the best statistical fit (i.e. the lowest DIC) to METEOR and Checkmate 025 study PFS data was the second order fractional polynomial model (with the parameters P1 = −1, P2 = 0), followed by a lognormal distribution. The DIC for the lognormal model was 3284, with two degrees of freedom, while the DIC for the fractional polynomial model was 3197, with one degree of freedom. A visual check was also conducted of the overlaid curves, see Supplementary eFigure 3, to verify that the selected distributions provided a good fit all throughout the period when trial data were available. The best-fitting fractional polynomial model fur-ther showed that while cabozantinib is associated with favorable PFS until month 20, after this time point PFS gain with nivolumab is pre-dicted to be greater than that of cabozantinib (Figure 2). As indicated earlier, a direct comparison of the HRs with each other is problematic, because the underlying assumption of proportional hazards is violated. However, because these comparisons are used commonly in the field, we checked the outcomes for such comparisons for our data and found that they would have agreed: cabozantinib was associated with longer PFS compared to nivolumab (HR 0.58 95% CIs 0.34–0.98), see final column inTable 1.
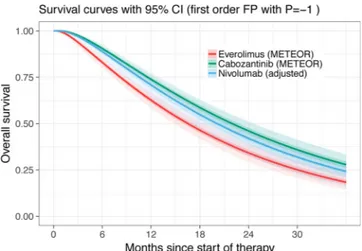
3.3. Overall survival
An analysis of the survival curves showed that the best statistical fit (i.e., lowest DIC) was provided by fractional polynomial model (with parameter P = −1;Figure 3). The second-best statistical fit was pro-vided by a lognormal model (see Supplementary Figure 4). The DIC for the log-normal model was 2375, with two degrees of freedom, while the DIC for the fractional polynomial model was 2367, also with two de-grees of freedom. The higher proportion of patients surviving at a given time point with cabozantinib over nivolumab was not statistically sig-nificant, as seen by the overlapping credible intervals inFigure 3(HR 0.96, 95% CIs 0.57–1.62). OS results were consistent across all the different statistical models tested. In addition to statistical fits, a visual check was also conducted to ensure the goodness of fit all throughout the period of the source clinical trials, see Supplementary Figure 4. Again, because direct comparisons of HRs are widely used, we checked
the outcome of such a test against our results and found agreement: no statistically significant difference for OS was found (HR 0.96, 95% CIs 0.57–1.62).
4. Discussion
Until recently, second-line treatment options for patients with aRCC were limited to axitinib, everolimus and sorafenib. These treatments provided median gains in clinical trials in the range of 1.9–6.8 months and 14.4–20.1 months for PFS and OS, respectively (Escudier et al., 2007; Escudier et al., 2009; Inlvta, 2018; Motzer et al., 2008; Motzer et al., 2010; Motzer et al., 2013; Rini et al., 2011). Cabozantinib and nivolumab are more recently approved and recommended treatment options associated with prolonged OS, with different mechanisms of action. While cabozantinib is a small molecule tyrosine kinase inhibitor (TKI) with VEGF, MET, and AXL inhibition properties, nivolumab is an antibody against programmed cell death protein 1 (anti-PD-1).
Our analysis was based on high quality primary studies, with a low risk of bias. While the inclusion criteria in the two retained trials were similar, the included populations differed in several ways. The METEOR study contained a higher percentage of patients with favorable prog-nosis (45.6% in METEOR vs. 36% in Checkmate 025; p = 0.0006; Chi-squared test). Both studies included patients who failed prior VEGFR-therapy, although in CheckMate025 patients with one or two previous treatments were included whereas METEOR did not limit the maximum number of prior therapies. In the CheckMate 025 study, 72% of patients had received one and 28% had received two prior regimens. The study protocol did not allow for inclusion of patients with three or more prior therapies. In the METEOR study, 70.5% of patients had received one and 29.5% had received two or more prior regimens. While the ever-olimus control curves in both studies had similar slopes (see supple-mentary eFigures 3 and 4), and our methodology can account for dif-ferences between trials by using the respective control group from each trial for the comparison, it is still possible that the observed differences in study populations could affect our results due to a possible violation of the assumption of similarity. Since we did not have access to in-dividual-level data for both trials, we could not account for these dif-ferences in the statistical analysis. Ultimately, a randomized direct comparison trial of cabozantinib and nivolumab would be able to provide an answer that would be free of such possible bias.
OS is improved over everolimus with both cabozantinib and nivo-lumab, complicating the decision making for clinicians and patients in circumstances when both new treatments are available. In this sys-tematic literature review and ITC, we found that OS is similar between cabozantinib and nivolumab. Our study provides the first comparison of cabozantinib and nivolumab using the final cut of METEOR OS data and including the use of fractional polynomial models to compare PFS and
OS for these two therapies. Our ITC analysis found that PFS was sig-nificantly longer with cabozantinib under the best-performing statis-tical models.
It had already previously been established that using HRs may not be an appropriate method for summarizing survival from the CheckMate-025 study (Amzal et al., 2017; Choueiri et al., 2015; Nivolumab, 2018). However, because such comparisons are intuitive to interpret and used widely in the field, we included a comparison of HRs. The results agreed with the fractional polynomial model: there was no significant difference in OS between the two treatments, and PFS was significantly superior for cabozantinib.
Wiecek and Karcher (Wiecek and Karcher, 2016) recently per-formed an ITC of parametric survival curves for cabozantinib and ni-volumab. The probability of cabozantinib having superior OS was above 50% until month 24, and after that time point the probability of nivolumab having superior OS was higher. The authors concluded that numerical differences in OS estimates between the two treatments were small. Their analysis was based on published METEOR data from 2015 (Choueiri et al., 2015), whereas our analysis is based on longer term survival data up until October 2, 2016 (NICE, 2018).
Our analysis is limited by the sparse network of two studies for both PFS and OS. Evidence for cabozantinib and nivolumab was based on two studies. Indirect evidence was derived from the common com-parator everolimus, for which the dose and frequency was similar in both trials, suggesting that it was reasonable to assume transitivity. Publication bias could not be assessed because only two studies were available.
In addition to the efficacy data analyzed herein, clinicians will have to take the different biological properties and safety profiles of the two treatments into account, the severity, temporal patterns, and manage-ment of which show very substantial differences that are beyond the scope of our current work.
Furthermore, clinicians will set treatment goals and choose regi-mens based on individual patient expectations and needs regarding quality of life, as well as practical concerns of disease management.
A recent indirect comparison study in the first-line setting con-cluded that “cabozantinib and nivolumab plus ipilimumab are likely to be the preferred first-line agents for treating mRCC; however, direct comparative studies are warranted” (Wallis et al., 2018). Because the nivolumab/ipilimumab combination, approved by the FDA and avail-able in the USA, has not yet been approved by the EMA for first-line use in Europe (Opdivo, 2018), this option remains presently hypothetical for European oncologists.
5. Conclusions
After decades of slow progress, the field of aRCC treatments is now evolving at a rapid and unprecedented pace that makes it difficult for statisticians and clinicians to keep up with the latest evidence and de-rive the best recommendations and decisions. Our work contributes to the analytic side of this arms race by exploring new and improved ways to compare results indirectly. The findings of our study are based on the latest available complete data and add to the continuous learning about the comparative benefits of cabozantinib and nivolumab. Using the latest available data may have introduced some bias due to the different data cut-offs for the analyses. As more evidence becomes available, including long-term follow-up data and real-world evidence, our ana-lysis can be updated to continuously learn more about the efficacy of these treatments.
Ultimately, identification of biomarkers of response for one or the other treatment may allow prediction ahead of the commencement of treatment and allow additional stratification of patient populations and further optimization of clinical results.
Conflict of interest statement
This research was funded by Ipsen Pharma SAS. CP and CS are working under consulting agreement with Ipsen Pharma. RC, SF, BA, JL, HK, JM, MN are employees of Analytica Laser working under a current consulting agreement with Ipsen Pharm. JD is former employees of Ipsen Pharm. The authors report no other conflicts of interest in this work. Role of the funding source
Ipsen Pharma SAS was the funding source and was involved in all stages of the study conduct and analysis.
Acknowledgements
Editorial assistance in the preparation of this article was provided by Dr. Silvia Paddock. Support for the study and writing assistance was funded by Ipsen Pharma SAS.
Appendix A. Supplementary data
Supplementary data associated with this article can be found, in the online version, athttps://doi.org/10.1016/j.critrevonc.2018.10.004. References
Amzal, B., Fu, S., Meng, J., Lister, J., Karcher, H., 2017. Cabozantinib versus everolimus, nivolumab, axitinib, sorafenib and best supportive care: a network meta-analysis of progression-free survival and overall survival in second line treatment of advanced renal cell carcinoma. PLoS One 12, e0184423.https://doi.org/10.1371/journal. pone.0184423.
Bucher, H.C., Guyatt, G.H., Griffith, L.E., Walter, S.D., 1997. The results of direct and indirect treatment comparisons in meta-analysis of randomized controlled trials. J. Clin. Epidemiol. 50, 683–691.
Melanoma – Treatment Options. CancerNet 2012.https://www.cancer.net/cancer-types/ melanoma/treatment-options(accessed April 9, 2018).
Cochrane Central Register of Controlled Trials (CENTRAL) n.d.http://www. cochranelibrary.com/about/central-landing-page.html(accessed April 9, 2018). Choueiri, T.K., Escudier, B., Powles, T., Mainwaring, P.N., Rini, B.I., Donskov, F., et al.,
2015. Cabozantinib versus everolimus in advanced renal-cell carcinoma. N. Engl. J. Med. 373, 1814–1823.https://doi.org/10.1056/NEJMoa1510016.
Choueiri, T.K., Escudier, B., Powles, T., Tannir, N.M., Mainwaring, P.N., Rini, B.I., et al., 2016. Cabozantinib versus everolimus in advanced renal cell carcinoma (METEOR): final results from a randomised, open-label, phase 3 trial. Lancet Oncol. 17, 917–927.
https://doi.org/10.1016/S1470-2045(16)30107-3.
Assessing Risk of Bias in Included Studies. Cochrane Bias n.d.http://methods.cochrane. org/bias/assessing-risk-bias-included-studies(accessed April 9, 2018).
Elsevier. Embase Coverage and Content. Elsevier n.d.https://www.elsevier.com/ solutions/embase-biomedical-research/embase-coverage-and-content(accessed April 9, 2018).
Escudier, B., Eisen, T., Stadler, W.M., Szczylik, C., Oudard, S., Siebels, M., et al., 2007. Sorafenib in advanced clear-cell renal-cell carcinoma. N. Engl. J. Med. 356, 125–134.
https://doi.org/10.1056/NEJMoa060655.
Escudier, B., Eisen, T., Stadler, W.M., Szczylik, C., Oudard, S., Staehler, M., et al., 2009. Sorafenib for treatment of renal cell carcinoma: final efficacy and safety results of the phase III treatment approaches in renal cancer global evaluation trial. J. Clin. Oncol. 27, 3312–3318.https://doi.org/10.1200/JCO.2008.19.5511.
Escudier, B., Porta, C., Schmidinger, M., Rioux-Leclercq, N., Bex, A., Khoo, V., et al., 2016. Renal cell carcinoma: ESMO Clinical Practice Guidelines for diagnosis, treatment and follow-up. Ann. Oncol. 27, v58–v68.https://doi.org/10.1093/annonc/mdw328. Guyot, P., Ades, A.E., Ouwens, M.J.N.M., Welton, N.J., 2012. Enhanced secondary
ana-lysis of survival data: reconstructing the data from published Kaplan-Meier survival curves. BMC Med. Res. Methodol. 12, 9.https://doi.org/10.1186/1471-2288-12-9.
Higgins, J., Green, S., 2011. Cochrane Handbook for Systematic Reviews of Interventions Version 5.1.0 [updated March 2011]. The Cochrane Collaboration.
European Medicines Agency – Find medicine – Inlyta n.d.http://www.ema.europa.eu/ ema/index.jsp?curl=pages/medicines/human/medicines/002406/human_med_ 001573.jsp&mid=WC0b01ac058001d124(accessed April 9, 2018).
Jansen, J.P., 2011. Network meta-analysis of survival data with fractional polynomials. BMC Med. Res. Methodol. 11, 61.https://doi.org/10.1186/1471-2288-11-61. Kiefer, C., Sturtz, S., Bender, R., 2015. Indirect comparisons and network meta-analyses.
Dtsch Ärztebl Int 112, 803–808.https://doi.org/10.3238/arztebl.2015.0803. Kruschke, J.K., Liddell, T.M., 2017. The Bayesian new statistics: hypothesis testing,
es-timation, meta-analysis, and power analysis from a Bayesian perspective. Psychon. Bull. Rev.https://doi.org/10.3758/s13423-016-1221-4.
Fact SheetMEDLINE® n.d.https://www.nlm.nih.gov/pubs/factsheets/medline.html (ac-cessed April 9, 2018).
Motzer, R.J., Escudier, B., Oudard, S., Hutson, T.E., Porta, C., Bracarda, S., et al., 2008. Efficacy of everolimus in advanced renal cell carcinoma: a double-blind, randomised, placebo-controlled phase III trial. Lancet 372, 449–456.https://doi.org/10.1016/ S0140-6736(08)61039-9.
Motzer, R.J., Escudier, B., Oudard, S., Hutson, T.E., Porta, C., Bracarda, S., et al., 2010. Phase 3 trial of everolimus for metastatic renal cell carcinoma: final results and analysis of prognostic factors. Cancer 116, 4256–4265.https://doi.org/10.1002/ cncr.25219.
Motzer, R.J., Escudier, B., Tomczak, P., Hutson, T.E., Michaelson, M.D., Negrier, S., et al., 2013. Axitinib versus sorafenib as second-line treatment for advanced renal cell carcinoma: overall survival analysis and updated results from a randomised phase 3 trial. Lancet Oncol. 14, 552–562.https://doi.org/10.1016/S1470-2045(13)70093-7. Motzer, R.J., Escudier, B., McDermott, D.F., George, S., Hammers, H.J., Srinivas, S., et al., 2015. Nivolumab versus everolimus in advanced renal-cell carcinoma. N. Engl. J. Med. 373, 1803–1813.https://doi.org/10.1056/NEJMoa1510665.
Two-Year Efficacy and Safety Update: Phase III CheckMate 025 Study of Nivolumab vs Everolimus in Patients With Advanced Renal Cell Carcinoma (aRCC) | NCRI Cancer Conference abstracts n.d. http://abstracts.ncri.org.uk/abstract/two-year-efficacy- and-safety-update-phase-iii-checkmate-025-study-of-nivolumab-vs-everolimus-in-patients-with-advanced-renal-cell-carcinoma-arcc/(accessed April 9, 2019). Cabozantinib for previously treated advanced renal cell carcinoma. Guidance and
guidelines. NICE n.d.https://www.nice.org.uk/guidance/ta463(accessed April 9, 2018).
Nivolumab for previously treated advanced renal cell carcinoma. Guidance and guide-lines. NICE n.d.https://www.nice.org.uk/guidance/ta417(accessed April 9, 2018). Opdivo. European Medicines Agency n.d.https://www.ema.europa.eu/medicines/
human/summaries-opinion/opdivo(accessed October 1, 2018).
Ouwens, M.J.N.M., Philips, Z., Jansen, J.P., 2010. Network meta-analysis of parametric survival curves. Res Synth Methods 1, 258–271.https://doi.org/10.1002/jrsm.25. Powles, T., Staehler, M., Ljungberg, B., Bensalah, K., Canfield, S.E., Dabestani, S., et al.,
2016. Updated EAU guidelines for clear cell renal cancer patients who fail VEGF targeted therapy. Eur. Urol. 69, 4–6.https://doi.org/10.1016/j.eururo.2015.10.017. Evaluation of the clinical efficacy of cabozantinib and nivolumab in previously treated
renal cell carcinoma. PROSPERO 2017 CRD42017068858 n.d.https://www.crd. york.ac.uk/prospero/display_record.php?RecordID=68858(accessed April 9, 2018). PubMed. Cochrane Work. Cochrane Highly Sensitive Search Strateg Identifying
Randomized Trials PubMed n.d.http://work.cochrane.org/pubmed(accessed April 9, 2018).
Rini, B.I., Escudier, B., Tomczak, P., Kaprin, A., Szczylik, C., Hutson, T.E., et al., 2011. Comparative effectiveness of axitinib versus sorafenib in advanced renal cell carci-noma (AXIS): a randomised phase 3 trial. Lancet 378, 1931–1939.https://doi.org/ 10.1016/S0140-6736(11)61613-9.
Wallis, C.J.D., Klaassen, Z., Bhindi, B., Ye, X.Y., Chandrasekar, T., Farrell, A.M., et al., 2018. First-line systemic therapy for metastatic renal cell carcinoma: a systematic review and network meta-analysis. Eur. Urol. 74, 309–321.https://doi.org/10.1016/ j.eururo.2018.03.036.
Wiecek, W., Karcher, H., 2016. Nivolumab versus cabozantinib: comparing overall sur-vival in metastatic renal cell carcinoma. PLoS One 11, e0155389.https://doi.org/10. 1371/journal.pone.0155389.
WinBUGS. MRC Biostat Unit n.d. https://www.mrc-bsu.cam.ac.uk/software/bugs/the-bugs-project-winbugs/(accessed April 9, 2018).
Znaor, A., Lortet-Tieulent, J., Laversanne, M., Jemal, A., Bray, F., 2015. International variations and trends in renal cell carcinoma incidence and mortality. Eur. Urol. 67, 519–530.https://doi.org/10.1016/j.eururo.2014.10.002.