Preliminary engineering analysis
of the August 24
th
2016, M
L
6.0
central Italy earthquake records
IUNIO IERVOLINO 1,GEORGIOS BALTZOPOULOS 2,EUGENIO CHIOCCARELLI 2
1 Dipartimento di Strutture per l’Ingegneria e l’Architettura,
Università degli Studi di Napoli Federico II, Italy. [email protected]
2 Construction Technologies Institute ITC-CNR, URT at
Di-partimento di Strutture per l’Ingegneria e l’Architettura, Università degli Studi di Napoli Federico II, Italy.
[email protected]; [email protected]
Abstract
An earthquake of estimated local magnitude (ML) 6.0 struck central Italy on the 24th of August (01:36:32 UTC) in the vicinity of Accumoli (close to Rieti, central Italy) initiating a long-lasting seismic sequence that also featured events of larger magnitude within a few months. The earthquake caused widespread building damage and around three-hundred fatalities. Ground motion was recorded by hundreds of seis-mic stations. This work uses accelerometric records for a preliminary discussion, from the earthquake en-gineering perspective, of strong motion caused by the earthquake. Peak and integral ground motion inten-sity measures, are presented. The response spectra at some select stations are analysed with respect to the code-mandated design actions for various return periods at the recording sites. Hazard disaggregation for different return periods is discussed referring to the site of the epicentre of the earthquake. Finally, some preliminary considerations are made concerning the impact of rupture propagation on near-source ground motion; i.e., the records are scanned for traces of pulse-like forward-directivity effects.
I.INTRODUCTION
T
h
e national accelerometric network of Italy (RAN), operated by the governmentalDi-partimento delle Protezione Civile (DPC), and the
Italian seismic network (RSN), operated by the
Istituto Nazionale di Geofisica e Vulcanologia
(INGV) have made available, rapidly after the event, the records of the earthquake, with
epi-centre located in the vicinity of Accumoli, cen-tral Italy, that struck on Aug. 24 2016, at 1:36:32 AM – UTC. The moment magnitude (Mw) declared by INGV is 6.0, while other
in-ternational institutions claim Mw 6.2. Corrected
records and processing details are available on the Engineering Strong-Motion database website, while the uncorrected waveforms can be found on the RAN and RSN websites (see section VI). The present short article deals with some aspects of recorded strong ground motion of
ANNALS OF GEOPHYSICS, 59, Fast Track 5, 2016; DOI: 10.4401/ag-7182 earthquake engineering interest. First, shaking
intensity parameters for some of the ground motions recorded nearest to the fault are pre-sented. Then, response spectra for some of the stations closer to the source are compared to the code-mandated spectra. Finally, near-source ground motions are examined for im-pulsive characteristics to be possibly attributed to rupture directivity.
II.GROUND MOTION INTENSITY MEASURES AND RESPONSE SPECTRA
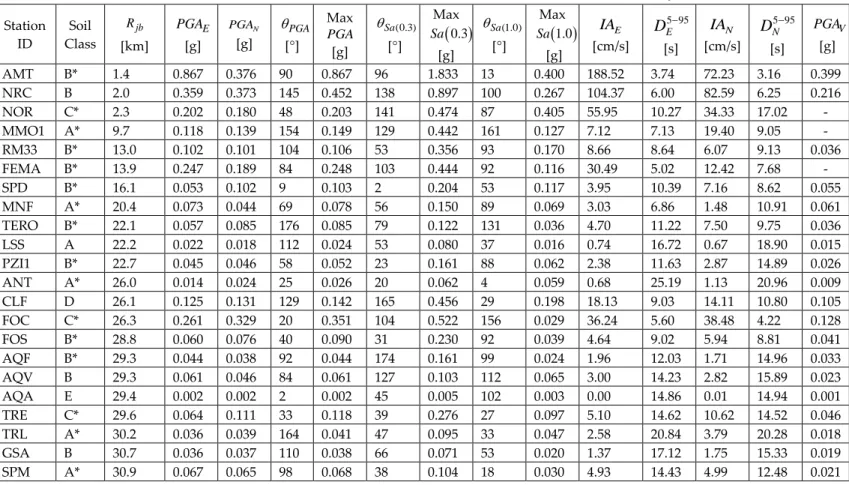
Table 1 shows some peak and integral ground motion intensity measures (IMs) for the records within 30km from the source (i.e., Joyner-and-Boore distance,Rjb). More
specifi-cally, data reported in the table are: the ID of the station, the Rjb distance, the soil class1
ac-cording to the code (CS.LL.PP. 2008, NTC2008 hereafter), the peak ground acceleration of the east-west horizontal component (PGAE), and of the north-south component (PGAN), the an-gle with respect to the north (positive clock-wise) to which corresponds the maximum rec-orded PGA
(
PGA)
, the corresponding PGA(Max PGA). The maximum pseudo-acceleration response spectrum ordinate at 0.3s and 5% damping, Sa
( )
0.3 , is given in the same table along with the angle to which it corre-sponds; i.e., Max Sa( )
0.3 and , respec-tively. The same information is provided, with analogous notation, assuming an oscillation period of 1.0s. Considered integral parameters1 Asterisks indicate that soil classification is based
on inferred, rather than measured, average shear
are the Arias intensity
( )
IA and the significant duration(
D5 95−)
for the horizontal compo-nents, estimated between 5% and 95% of IA. Finally, if available, vertical PGA values are also reported (PGAV).2Data reported in Table 1 show that MAX
PGA and Sa
( )
0.3 recorded by NRC and AMT station were significantly higher than those recorded by all the other stations, while the highest Max Sa( )
1.0 was recorded by the NOR station. In particular, PGAE of the AMT stationis the highest horizontal PGA recorded up to that point in Italy (larger PGAs may have oc-curred later in the sequence, yet this is not yet fully consolidated).
Among other stations, a few records have values somewhat departing from the general trend: FEMA, CLF, FOC and TRE if PGA and
( )
0.3Sa are considered, and RM33 and CLF if
( )
1.0Sa is of concern (see also Section IV). A similar situation applies to integral parame-ters.
To have a more complete picture of the characteristics of the recorded IMs, these have to be compared with ground motion predic-tion equapredic-tions (GMPEs). One of such compari-son can be found in ReLUIS-INGV Workgroup (2016a), that also includes the complete re-sponse spectra (elastic and inelastic) for the records considered here, as well as for others
2 IMs from AMT station are derived from the
re-vised records provided by RAN website several weeks after the event. Moreover, at the time of the submission of this paper, recordings from AQA and NOR stations have been retracted pending possible revision by the DPC. AQA and NOR data analysed here are those available prior to said revision.
(0.3)
Sa
more distant from the source. Another com-prehensive comparison of observed ground motion peak parameters and predicted IMs is provided in Lanzano et al. (2016) with respect to two different GMPEs. In that paper, it is un-derlined that the GMPEs generally fit the ob-servations for low spectral periods and short source-to-site distances and seem to under-predict the observed IMs at distances larger than 80 km.
III.THE RECORDS AND THE ITALIAN SEISMIC CODE
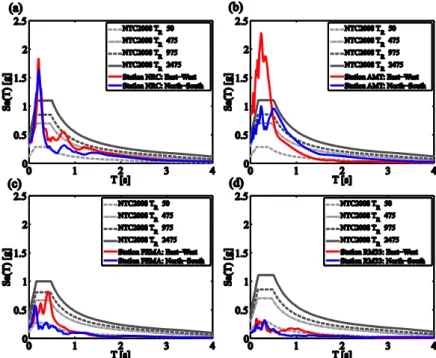
In Figure 1 the pseudo-acceleration re-sponse spectra associated to the horizontal ground motions, recorded by some of the sta-tions with the smallest Rjb distance, are
com-pared with the elastic design spectra provided by the Italian building code, at the correspond-ing sites, for four different return periods (TR):
50, 475, 975 and 2475 years.
Before proceeding any further, it is worthwhile recalling that NTC2008 spectra are a direct approximation of the uniform hazard spectra computed via the probabilistic seismic hazard analysis (PSHA) discussed in Stucchi et al. (2011).
The east-west component of AMT exceeds the 2475 years spectra in the 0s-0.4s range of periods, while at least one component of the same station exceeds the 475 years spectra for spectral periods up to 2.1s. NRC and FEMA (see Figure 2a, for the position with respect to the source) exceed the 475 years spectra in the range of periods 0s-0.3s and 0.35s-0.5s respec-tively. This applies to at least one of the two horizontal components (for NRC record, the exceedance happens also for 0.67s-0.88s). The NRC record also exceeds the 2475 years
spec-trum for periods between 0.13s and 0.28s. However, at all the stations for longer oscilla-tion periods, and as soon as the distance in-creases, spectral ordinates become comparable with code-spectra corresponding to return pe-riods of a few tens of years.
The maximum ratios of the peak of the pseudo-acceleration spectrum (5% damping) and the PGA are equal to 5.1 and 2.7, for NRC and AMT stations, respectively (these refer to the east-west and north-south directions with-out investigating other possible rotations). Notwithstanding the not completely intelligi-ble (so far at least) differences between the two horizontal components of AMT, the shape and the amplitude of these spectra appear compat-ible with extensive damage in some villages, where the population of structures suffered significant damage or total collapse.
It should be also discussed that exceedance of code spectra close to the source of a strong earthquake does not directly imply inadequa-cy of PSHA at the basis of the code spectra (Iervolino, 2013). This is also because spectra from PSHA, are the results of an average of a series of scenarios considered possible (e.g., small and large source-to-site distances). Such an average may be exceeded close to the source of an earthquake, even if the corre-sponding scenario is included in the PSHA.
Referring to the coordinates of the epicen-tre (42.70N; 13.24E), the hazard disaggregation (e.g., Iervolino et al., 2011) was computed, by means of REXEL v 3.5 (Iervolino et al., 2010), for PGA and for Sa
( )
1.0 , for two return peri-ods (475 and 2475 years). The entire set of dis-aggregation distributions is not shown here for the sake of brevity (although it can be found in ReLUIS-INGV Working group, 2016a). Never-theless, the relevant scenarios for theconsid-ANNALS OF GEOPHYSICS, 59, Fast Track 5, 2016; DOI: 10.4401/ag-7182 ered return periods and IMs are summarized
here; they are the magnitude and distance in-tervals that have probability, of being causa-tive for the exceedance of the corresponding IM, larger than 0.5. All of these scenarios are characterized by the same distance range be-tween 0km - 20km. Magnitude intervals for
PGA are 5.3 - 6.3 and 5.9 – 6.8 for 475 years and 2475 years, respectively. For Sa
( )
1.0 , andthe same return periods, magnitude intervals are 6.0–7.0 and 6.3-7.0, respecitively. It may be concluded that, according to the hazard analy-sis the code is based on, exceedance of high-frequency spectral accelerations, correspond-ing to 475 years and 2475 years TR, is most
like-ly caused by a close moderate-magnitude earthquake that is loosely compatible to what was observed.
Figure 1. Comparison between the observed ground motions and the elastic design spectra provided by NTC2008.
IV.ANALYSIS OF PULSE-LIKE DIRECTIVITY EFFECTS
Pulse-like near-source (NS) ground mo-tions may be the result of rupture directivity. This can lead to a constructive wave interfer-ence effect, which is manifested in the form of a double-sided velocity pulse that delivers most of the seismic energy early in the record (Somerville et al., 1997). Clues of impulsive features in near-source ground motions have
been probably found in Italian seismic events of normal faulting style before (e.g., Chioc-carelli and Iervolino, 2010). In this preliminary investigation for such pulse-like effects, the continuous wavelet transform algorithm sug-gested by Baker (2007) was implemented for all recordings (horizontal components) within a closest-to-rupture distance of 30km from the fault and for all orientations.
It should be noted that the adopted ap-proach is purely phenomenological, extracting
empirical evidence of impulsive characteristics directly from the recorded NS signals without attempting to assign a causal relation to specif-ic effects falling under the banner of rupture directivity (i.e., rupture propagation, seismic source radiation pattern, motion polarization). Models regarding the phenomenon through the prism of the physics of finite-fault rupture are also available (e.g., Spudich and Chiou, 2008) but not followed in this preliminary analysis.
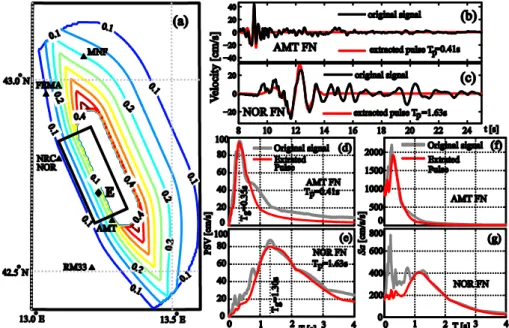
The surface projection of the fault rupture plane (Tinti et al., 2016) is shown in Figure 2a along with the equal-probability contours of the Iervolino and Cornell (2008) model for the probability of observing NS directivity pulses. It can be observed that, interestingly enough, some of the most prominent impulsive wave-forms (NRC, NOR, FEMA, RM33) have been recorded at sites where the empirically-calibrated model assigns low probability of pulse occurrence due to directivity. This is in-dicative of the fact that more research is re-quired into the phenomenon for the case of normal faulting, but it should also be men-tioned that there were hardly any acceleromet-ric stations present in the area where pulse-like effects were most probable to be observed ac-cording to the model.
Out of all the records investigated, six ground motions exhibited impulsive character-istics, as expressed by a Pulse Indicator (PI) score in excess of 0.85 (see Baker, 2007). The AMT record revealed two distinct pulses. One with pulse period
T
p of 0.41s being predomi-nant in the fault-normal (FN) and another, longer duration pulse withT
p = 0.98s in the fault-parallel (FP) direction (Figure 2b). The latter might be attributed to the breakage of anearby asperity on the fault plane (Tinti et al., 2016). The FEMA record was also discovered to exhibit impulsive characteristics in both FN (T = 0.50s) and FP directions. The ground mo-p tions recorded at the MNF station and RM33 were found to contain pulses in the FN direc-tion (T = 1.40s and 1.20s respectively) that also p hinted at rupture directivity effects, despite the lower velocity amplitude due to the greater distance from the fault and consequent attenu-ation. This leaves the two ground motions rec-orded at Norcia, NRC and NOR, that were of particular interest. The NRC record was found to contain a 2.09s period pulse mostly towards orientations that lie between the FN and FP but somewhat more prevalent in the direction perpendicular to the strike. Interestingly, it is known that the NRC site sits upon deep soil deposits characterized by an inversion of ve-locity profile at a depth of more than 30m (see Bindi et al., 2011) and this cannot be disregard-ed when narrow-band characteristics are ob-served in the recordings. However, station NOR was also found to be pulse-like, with a 1.63s pulse in the FN direction (see Figure 2c). Furthermore, records obtained at the base/ground-level of instrumented, seismically monitored buildings distant up to 500m from the two accelerometric stations, contained ve-locity pulses almost identical in orientation and period to the NOR station. This consisten-cy enhances the argument in favour of the presence of a directivity effect.
One prominent characteristic of directivi-ty-induced velocity pulses is that they tend to dominate the spectral shape of the signal’s pseudo-velocity spectrum. This is also con-firmed in the case examined here; see Figures 2(d-e). Furthermore, pulse period T (as de-p
ANNALS OF GEOPHYSICS, 59, Fast Track 5, 2016; DOI: 10.4401/ag-7182 fined via the wavelet transform, see Baker,
2007) is very well correlated with predominant ground motion period T (vibration period g where maximum pseudo-velocity occurs); also confirmed in this case. Note that the extracted pulses typically correspond to some local max-imum also on the pseudo-acceleration spec-trum ( Sa ), but do not necessarily account for the absolute maximum amplitude, which is
usually determined by the higher-frequency content.
Finally, when the pulse periods extracted from the various NS sites examined are com-pared against the empirical regression model from Baltzopoulos et al. (2016), they are found in reasonable agreement with what is expected for a Mw 6.0 event (T geometric mean of 1.02s p
compared to predicted median of 1.29s).
Figure 2. Equal probability of pulse occurrence contours, according to the model of Iervolino and Cornell (2008), plotted against the surface projection of the rupture plane (a), velocity time-history and extracted pulse of AMT FN component (b) and NOR FN (c), pseudo-velocity spectra (PSV) of the extracted pulses
plot-ted against PSV of the original signal for the FN components of AMT (d) and NOR (e), pseudo-acceleration spectra of the extracted pulses plotted against Sa of the original signal for the FN components of AMT (f)
and NOR (g).
V.CONCLUSIONS
This article provided a preliminary engi-neering-point-of-view analysis of the strong motion records obtained during the Amatrice earthquake that struck central Italy on 24th of
August 2016. An overview of the ground mo-tion intensity parameters typically associated with structural response was given,
identify-ing stations with highest IMs, with AMT ex-hibiting the highest horizontal PGA recorded in Italy so far. The comparison of some of the closest-to-rupture records’ spectra and the code spectra showed cases of exceedance of the latter by the former at TR 475 years and
even TR 2475 years. It was then briefly
to claim otherwise can be a common pitfall. Finally, it can be said that some indications of pulse-like NS motions were observed, which could be the result of rupture directivity. Points of interest that merit further investiga-tion include the potential role of site effects in the manifestation of some particular spectral shapes and the juxtaposition of inelastic re-sponse spectra with damages.
VI.POSTSCRIPT
This paper was prepared before the occur-rence of other large earthquakes from same seismic sequence. Indeed, since the first sub-mission of this article, two further strong earthquakes have struck the area, the 26/10/2016 Mw 5.9 Ussita event and the
30/10/2016 Mw 6.5 Norcia event. As such, the
24/08 Mw 6.0-6.2 Amatrice earthquake is
cur-rently regarded as the initiating event of the long-lasting 2016 central Italy sequence, with the Norcia seismic event being typically nomi-nated as the overall mainshock, so far. Herein the first event was discussed, while the reader is referred to ReLUIS-INGV Workgroup (2016b) for a more comprehensive analysis of the sequence as a whole.
VII.DATA AND SHARING RESOURCES
Records used herein were processed and pro-vided to the authors by the ITACA-ESM Working Group of the Istituto Nazionale di Geofisica e Vulcanologia (INGV). They are also available at http://esm.mi.ingv.it/ (last accessed 21/11/2016).
The unprocessed records can be accessed at http://ran.protezionecivile.it for the RAN network and at the European Integrated Data Archive (http://www.orfeus-eu.org/data/eida/) for the RSN.
The parameters of the finite-fault geometry used are available at http://esm.mi.ingv.it and are attributed to Tinti et al. (2016).
Accelerograms recorded at the monitored structures in Norcia are available from the Seismic Observatory of Structures of the Na-tional Civil Protection – www.mot1.it.
VIII.ACKNOWLEDGMENTS
The study presented in this paper was devel-oped within the activities of ReLUIS (Rete dei
Laboratori Universitari di Ingegneria Sismica).
IX.REFERENCES
Baker J.W. (2007). Quantitative Classification of Near-Fault Ground Motions Using Wavelet Analysis. Bull. Seismol. Soc. Am., 97(5):1486– 1501.
Baltzopoulos G., D. Vamvatsikos and I. Iervo-lino (2016). Analytical modelling of near-source pulse-like seismic demand for multi-linear backbone oscillators. Earth. Engin. Struct. Dyn., 45(11):1797–1815.
Bindi D., L. Luzi, S. Parolai, D. Di Giacomo and G. Monachesi (2011). Site effects observed in alluvial basins: the case of Norcia (central Italy). Bull. Earthquake Eng., 9:1941-1959. Chioccarelli E., I. Iervolino (2010). Near-Source Seismic Demand and Pulse-Like Records: a Discussion for L'Aquila Earthquake. Earthq. Engn. Struct. Dyn., 39(9):1039–1062.
CS.LL.PP. (2008). Decreto Ministeriale 14 gen-naio 2008: Norme tecniche per le costruzioni. Gazzetta Ufficiale della Repubblica Italiana, 29 (in Italian).
Iervolino I., C.A. Cornell (2008). Probability of occurrence of velocity pulses in near-source
ANNALS OF GEOPHYSICS, 59, Fast Track 5, 2016; DOI: 10.4401/ag-7182 ground motions. Bull. Seismol. Soc. Am.,
98(5):2262-2277.
Iervolino, I. (2013). Probabilities and fallacies: why hazard maps cannot be validated by indi-vidual earthquakes. Earthq. Spectra, 29(3):125– 1136.
Iervolino, I., C. Galasso and E. Cosenza (2010). REXEL: computer aided record selection for code based seismic structural analysis. Bull. Earthq. Eng., 8:339-362.
Iervolino, I., E. Chioccarelli and V. Convertito (2011). Engineering design earthquakes from multimodal hazard disaggregation. Soil Dyn. Earthq. Eng., 31:1212-1231.
Lanzano G., L. Luzi, F. Pacor, R. Puglia, M. D’amico, C. Felicetta and E. Russo (2016). Pre-liminary analysis of the accelerometric record-ings of the August 24th, 2016 Mw 6.0 Amatrice
earthquake. Annals of Geophysics, 59, Doi: 10.4401/ag-702.
ReLUIS-INGV Workgroup (2016a). Prelimi-nary study of Rieti earthquake ground motion records V5, available at http://www.reluis.it. ReLUIS-INGV Workgroup (2016b). Prelimi-nary study on strong motion data of the 2016 central Italy seismic sequence V6, available at http://www.reluis.it.
Somerville P.G., N.F. Smith, R.W. Graves and N.A. Abrahamson (1997). Modification of em-pirical strong ground motion attenuation rela-tions to include the amplitude and duration effects of rupture directivity. Seismol. Res. Lett., 68:199–222.
Spudich, P., B.S.J. Chiou (2008). Directivity in NGA earthquake ground motions: analysis
us-ing isochrone theory. Earthq. Spectra 24(1): 279-298.
Stucchi, M., C. Meletti, V. Montaldo, H. Crow-ley, G.M. Calvi and E. Boschi (2011). Seismic hazard assessment (2003–2009) for the Italian building code. B. Seismol. Soc. Am., 101:1885– 1911.
Tinti, E., L. Sconamiglio, A. Michelini and M. Cocco (2016). Slip heterogeneity and directivi-ty of the ML 6.0, 2016, Amatrice earthquake es-timated with rapid finite-fault inversion. Ge-ophys. Res. Lett., 43(10): 10,745-10,752.
Table 1. IMs of the recorded ground motions within 30 km from the source (distance in terms of Rjb). Station ID Soil Class jb R [km] E PGA [g] N PGA [g] PGA [°] Max PGA [g] (0.3) Sa [°] Max