1
Unraveling the internal conversion process within the Q-bands
of
a
Chlorophyll-like-system
through
Surface-Hopping
Molecular Dynamics Simulations.
Mariagrazia Fortino
1, a), Elisabetta Collini
2, Julien Bloino
1, Alfonso Pedone
3.
AFFILIATIONS
1
Scuola Normale Superiore, Pisa, 56126, Italy.
2
Università degli studi di Padova, Padova, 35122, Italy.
3
Università di Modena e Reggio Emilia, Modena, 45125, Italy.
a)
Author to whom correspondence should be addressed: [email protected]
ABSTRACT
The non-radiative relaxation process within the Q-bands of Chlorophylls represents a crucial preliminary step during the photosynthetic mechanism. Despite several experimental and theoretical efforts performed in order to clarify the complex dynamics characterizing this stage, a complete understanding of this mechanism is still far to be reached. In this study, non-adiabatic excited-state molecular dynamic simulations have been performed to model the non-radiative process within the Q-bands for a model system of Chlorophylls. This system has been considered in gas phase and then, to have a more representative picture of the environment, with implicit and mixed implicit-explicit solvation models. In the first part of this analysis, absorption spectra have been simulated for each model in order to guide the setup for the non-adiabatic excited-state molecular dynamic simulations. Then, non-adiabatic excited-state molecular dynamic simulations
have been performed on a large set of independent trajectories and the population of the Qx and
Qy states has been computed as the average of all the trajectories, estimating the rate constant for
the process. Finally, with the aim of investigating the possible role played by the solvent in the Qx
-Qy crossing mechanism, an Essential Dynamic Analysis has been performed on the generated
data, allowing finding the most important motions during the simulated dynamics.
This is the aut
hor’s peer reviewed, accepted manuscript. Howe
ver, the online
version of record will be different
from this
version
once it has bee
n copyedited an d typeset. PLEASE CIT E THIS ARTI C LE AS DOI: 10.1063/5.0039949
2
I. INTRODUCTION
Chlorophylls, among the most widespread light-harvesting pigments, play a leading role during the
solar-to-chemical energy conversion in the photosynthetic process1-6. Considering their relevance,
these systems have been widely studied both experimentally and theoretically7-10. Specifically,
much attention has been devoted in recent years to the characterization of the ultrafast relaxation
dynamics of chlorophylls and their implication in energy and charge transport mechanisms11-20.
Within the four-orbital model proposed by Gouterman to describe the UV-vis spectrum of
chlorophylls in general21, the electronic excitation results in four bands: the Q
y and Qx bands found
in the 500-700 nm region and corresponding to the S1S0 and S2S0 electronic transitions,
respectively, while the Bx and By bands located in the 350-450 nm region are assigned to the
S3S0 and S4S0 electronic transitions, respectively. However, recent studies showed that the Qx
and Qy bands are strongly mixed by vibronic coupling, implying that the Gouterman model of
purely independent transitions is not accurate22,23,24. This coupling is the main cause of the ultrafast
relaxation dynamics within the Q-bands of chlorophylls, which is a decisive step with important implications for the ensuing photosynthetic process.
Moreover, it is well known that the environment in the light-harvesting complexes finely tunes chlorophyll electronic transitions to optimize energy transfer. For this reason, a deep comprehension of the environmental effects on the monomeric chlorophylls electronic transitions is crucial. In 2013, Reimers et al. provided a valuable spectral assignment of the Q-bands covering a
wide range of environments for 32 chlorophyllides and related macrocycles22. Shi et al.25 have
experimentally probed the internal conversion timescale within the Q-bands of chlorophyll-a in several solvents by using the time-resolved fluorescence depletion spectroscopy technique. The
time constants in different aprotic solvents for the Qx-Qy relaxation have been found to range from
100 to 226 fs. The internal conversion time was found to increase with the dielectric constant of the solvent. More recently, ultrafast 2D electronic spectroscopy has been used to study the spectral
diffusion and reveal the role of the solvent during the Q-bands relaxation process26, 27, 28.
Specifically, Meneghin et al.26 exploited 2D electronic spectroscopy to get more insights into the
mechanism of internal conversion within the Q-bands of Chl-a in methanol. These experimental measurements have brought out a time constant for the overall internal conversion of 170 fs and have captured the presence of a new ultrafast intermediate step that involves vibronic levels of the lowest excited state, with a time constant of 40 fs. Despite the experimental efforts to clarify the
relaxation process within the Q-bands, a complete understanding of the details determining the Qx
-Qy spacing and driving the relaxation mechanism and a deep comprehension of the role played by
the solvent is still far from being reached.
In this study, the non-radiative process within the Q-bands of a chlorophyll-like system has been modeled by performing non-adiabatic excited-state molecular dynamic (NA-ESMD) simulations.
This is the aut
hor’s peer reviewed, accepted manuscript. Howe
ver, the online
version of record will be different
from this
version
once it has bee
n copyedited an d typeset. PLEASE CIT E THIS ARTI C LE AS DOI: 10.1063/5.0039949
3
NA-ESMD has emerged as an important theoretical tool to simulate accurately photo-induced dynamics in medium-large molecules. This method, belonging to the family of mixed
quantum-classical approaches29 in which nuclear motions are treated classical and the other degrees of
freedom, in particular those associated to the electrons, are computed quantum mechanically, has
matured significantly in the last decades30-34 and can provide complementing information to the
non-radiative relaxation process of chlorophylls.
Indeed, Bricker et al.35 in 2015 used NA-ESMD simulations in conjunction with semi-empirical
methods in order to model the non-radiative process within the Q-bands of chlorophyll-a (Chl-a) and chlorophyll-b (Chl-b), studying the differences in terms of internal conversion rates between the two pigments. However, the use of semi-empirical methods to compute excited-state energies and the oscillator strengths resulted in a low accuracy compared to experiment. Moreover, the role of the solvent was not deeply unraveled, since only an implicit solvation model was used.
In this analysis, we have combined the fewest switches surface hopping (FSSH) approach, that represents the most widespread method for non-adiabatic dynamics for both gas and
condensed-phase simulations36-37, with time dependent-density functional theory (TD-DFT) calculations of
excited-state energies to investigate the non-radiative relaxation process of a chlorophyll-like system within the Q-band, in methanol solvent. As widely shown in literature, TD-DFT allows
getting a very accurate evaluation of excited-state energies for medium-large molecules38-44.
The chlorophyll-like model used in our analysis, red-Chl, contains only the porphyrin moiety, known for determining most photophysical properties of chlorophylls (see Figure 1a). This reduced system is much more similar to Chl-a, which is the most known and studied molecule of the chlorophylls family. As a first step, red-Chl has been considered in the gas phase; then, to have a more accurate description of the complex environment around the chromophore, the spectroscopic behavior of red-Chl has also been investigated in methanol solution, with solvent effects described implicitly (by means of Polarizable Continuum Model, PCM) and with explicit inclusion of the molecules closest to the solute. Indeed, the great ability of chlorophylls to coordinate ligands is an essential structural feature for protein-antenna complexes and it has been observed that in
light-harvesting complexes a hexacoordinated state of chlorophylls is very common45. Previous TD-DFT
studies performed on chlorophylls in solution have shown that site-specific solvation effect and Mg
(II) ion coordination could modulate their photophysical behavior46. For this reason, in this study,
an explicit solvated model of red-Chl, where two methanol molecules generate a hexacoordinated configuration of Mg (II), has been considered (see Figure 1b).
We will refer to the system in the gas phase as red-Chl-gas, the one where solvent effects have been accounted with a totally implicit model as red-Chl-PCM, and the hybrid model with two explicit solvent molecules as red-Chl-2MeOH.
NA-ESMD simulations performed on such models allow simulating the ultrafast intramolecular electronic energy redistribution after photo-excitation.
This is the aut
hor’s peer reviewed, accepted manuscript. Howe
ver, the online
version of record will be different
from this
version
once it has bee
n copyedited an d typeset. PLEASE CIT E THIS ARTI C LE AS DOI: 10.1063/5.0039949
4
The comparison of the relaxation dynamics in totally implicit and mixed implicit-explicit solvent models allows exploring the role played by the solvent molecules during the relaxation mechanism. Specifically, simulated dynamic motions have been further investigated by performing essential
dynamics analysis (EDA)47,48: a principal component analysis of the geometric displacements
intended to find the most important linear motions within the dynamics. This procedure, carried out on all investigated models, is useful to evaluate if the considered explicit solvent molecules participate during the complex relaxation mechanism. In this work, we show how methods based on surface hopping molecular dynamic simulations can be applied to theoretically investigate the
crucial details underlying the Qx-Qy spacing of chlorophylls and the role played by the solvent
during the ultrafast relaxation dynamic.
This paper is organized as follows: in the next section, theoretical and computational details are described. Then, absorption spectra for all models of red-Chl, simulated by using the nuclear ensemble approach to sample the ground-state potential energy surfaces, are presented and analyzed in Section III.A, together with results of NA-ESMD simulations performed on all models of red-Chl. Finally, EDA results are discussed in Section III.B.
II. THEORETICAL AND COMPUTATIONAL SECTION
II.A. Theoretical methods
The NA-ESMD methodology, used in this study, belongs to the family of mixed quantum-classical
approaches29 and it efficiently simulates photo-induced dynamics of molecules where multiple
electronic excited states are involved. This is achieved by merging the fewest switches surface
hopping (FSSH) approach with “on the fly” analytical calculations of excited-state energies,
gradient and non-adiabatic coupling terms. Here, a very brief description of the NA-ESMD
approach is reported. A detailed description of the method can be found in ref.31,49.
In the FSSH approach, the classical trajectory propagates on a single electronic potential energy
surface (PES) and the trajectory has a finite probability of hopping to another surface36,37,50.
An original hopping probability was proposed to simply maintain a good balance between the
quantum population and the actual number of trajectories on the surfaces50.
However, this approach introduced a huge number of hopping events and for this reason, Tully later introduced a hopping rate able to guarantee this balance with the fewest number of hops,
resulting in the so-called FSSH method36,37.
Operatively, in the FSSH approach, the time evolution of the population of different states is achieved in two stages: i) the non-adiabatic transition probability between each pair of states is computed through Tully’s algorithm. Then a stochastic algorithm is used to determine in which state the classical trajectory is spread for the next step; ii) in order to get the occupation in each
This is the aut
hor’s peer reviewed, accepted manuscript. Howe
ver, the online
version of record will be different
from this
version
once it has bee
n copyedited an d typeset. PLEASE CIT E THIS ARTI C LE AS DOI: 10.1063/5.0039949
5
state as a function of time (in terms of fraction of trajectories), statistic over a large set of independent trajectories is performed. Within this procedure, the time-dependent Schrödinger equation is integrated simultaneously with the classical trajectory.
Accurate NA-ESMD simulations require a good description of the initial phase space distribution, i.e. a sampling of the ground-state potential energy surface with an ensemble of initial conditions (initial coordinates and momenta). The initial conditions ensemble can be generated with different procedures. In the method used in this study, phase space distribution has been evaluated by
using a Wigner distribution, since it showed an accurate sampling for medium systems51. This
procedure requires the calculation of the equilibrium geometry and its vibrational normal. The distribution of each normal mode is defined as follows:
|𝜓𝑁𝑛(𝑄𝑛)|2|𝜁𝑁𝑛(𝑃𝑛)|
2
(1)
where 𝜓𝑁𝑛(𝑄𝑛) is the harmonic oscillator wavefunction in the coordinate space, while 𝜁𝑁𝑛(𝑃𝑛) is the
momentum space51.
Before starting NA-ESMD simulations, a recurrent initial step is to perform a benchmark against the experimentally available optical absorption spectra. The latter can be computationally simulated as a histogram of the excited-state energy values, obtained from each initial condition of
the generated nuclear ensemble, weighted by their corresponding oscillator strengths31,52. The
initial conditions are complete for NA-ESMD simulations when the excited states of interest are populated. In practice, only the initial conditions that overcome a specific energy restriction, related to the energy gap or bands of interest, can be used for the NA-ESMD simulations. This procedure allows creating a large set of relevant independent trajectories.
Once propagated the generated trajectories during NA-ESMD simulations, the recorded data can be analyzed and important information can be retrieved, such as the average of the fraction of trajectories in each state as a function of time, corresponding to the average of non-adiabatic population in each state as a function of time.
Further analysis of the recorded data can also be performed. A significant one is the essential
dynamic analysis (EDA)47,48. This is a principal component analysis of the geometric displacements
that allows finding important motions in the dynamics, focusing the attention on the atomic positional fluctuations. Indeed, by diagonalizing the covariance matrix of the atomic displacements, it has been found that most of the positional fluctuations are mainly condensed in a subspace of only a few (no more than 1% of the total) degrees of freedom, while all other degrees of freedom
are involved in far less important fluctuations47,48.
The first step of this analysis is the elimination of the overall translational and rotational motions because these are irrelevant for the internal motion under investigation. To this aim, an averaged trajectory is computed and used to construct a 3Nx3N (where N is the number of atoms) covariance matrix of the positional deviations. Diagonalization of this covariance matrix results in a set of eigenvectors and eigenvalues: the eigenvectors represent the active linear motions and the
This is the aut
hor’s peer reviewed, accepted manuscript. Howe
ver, the online
version of record will be different
from this
version
once it has bee
n copyedited an d typeset. PLEASE CIT E THIS ARTI C LE AS DOI: 10.1063/5.0039949
6
eigenvalues represent the corresponding variance. The eigenvectors with the largest eigenvalues consequently correspond to the largest positional deviation. Generally, most of the positional
fluctuations reside in a very limited subset of eigenvectors47,48.
II.B. Computational details
All simulations have been performed with the NEWTONX suite of programs53, linked to
GAUSSIAN0954 for the on-the-fly computation of electronic properties during dynamics propagation.
These calculations have been performed at the TD-DFT level of theory, using the CAM-B3LYP density functional and the 6-31G(d,p) basis set, since this kind of level of theory has been found to
reproduce well the electronic and optical properties of chlorophylls in previous studies55. As
discussed above, the effect of methanol as solvent has been computationally investigated by means of implicit and mixed implicit-explicit models. The implicit model used is the polarizable
continuum model (PCM)56. The default parameters of GAUSSIAN09 have been used for the
construction of the cavity, built as the envelope of interlocked spheres centered on each atom of the solute. Once geometry optimizations and frequency calculations had been performed for all considered models, 800 initial conditions have been built with the NEWTONX package. For each
initial condition, transition energies from the ground state (S0) to the first three excited ones (S1, S2
and S3) have been computed and the total absorption spectra have been obtained as convolutions
of the single computed transition intensities.
The 800 initial conditions previously generated were used as starting points for the NA-ESMD
simulations. The performed dynamics started in the S2 excited state with 200 initial conditions
selected in the range 2.5 ± 0.15 eV, that is the energy range involving the Q-band. Generally, NA-ESMD simulations require a larger number of independent trajectories. However, in this study the analytical calculations of excited-state energies have been performed at the TD-DFT level of theory that allows getting a very accurate evaluation of excited-state energies but at a relatively high computational cost. For this reason, we have limited the NA-ESMD simulations to a lesser number of initial trajectories. In order to evaluate if the amount of independently considered trajectories is sufficient to get an accurate picture of the average of the occupation in each state over time, a dynamic convergence check was carried out, graphically represented in Figure S1 of the Supplementary Information. In Figure S1, the average over 100, 150 and 200 trajectories of the computed occupation in each state as a function of time is showed for gas, red-Chl-PCM and red-Chl-2MeOH systems: after 200 trajectories, a good convergence has been found for each investigated model.
For each selected initial condition, the trajectory time has been set at 400 fs with a time step of 0.5 fs.
Once the NA-ESMD had been completed for all trajectories, using the default NMA tool of
This is the aut
hor’s peer reviewed, accepted manuscript. Howe
ver, the online
version of record will be different
from this
version
once it has bee
n copyedited an d typeset. PLEASE CIT E THIS ARTI C LE AS DOI: 10.1063/5.0039949
7
NEWTONX, EDA has been performed57.
III. RESULTS AND DISCUSSION
III. A. Simulated Absorption Spectra and NA-ESMD simulations.
In order to guide the setup of excited-state MD simulations, the absorption spectrum for each model of red-Chl has been simulated as a convolution of the single transition intensities from the
ground to the excited states (S1, S2 and S3) combined for each of the 800 initial configurations. In
Figure 2, the starting optimized geometries computed for red-Chl in gas phase (red-Chl-gas) and including solvent effects both with totally implicit and the mixed implicit-explicit models are reported (red-Chl-PCM and red-Chl-2MeOH, respectively). The hexacoordination of the Mg(II) ion with the nitrogen atoms of the porphyrin moiety and the explicit methanol molecules is shown in Figure 2c. Figure 3 shows the simulated absorption spectra for the gas, PCM and red-Chl-2MeOH systems.
The interpretation of the low-energy part of the chlorophylls’ absorption spectra is particularly
complex due to the influence of several aspects such as the strong Qx-Qy non-adiabatic
interactions, the inhomogeneous broadening effects and the activation of low-frequency molecular vibrations. Several theoretical and experimental efforts have been made in order to accurately
characterize and describe the lineshape of the low-energy bands 22,24,58.
The simulated absorption spectra shown in Figure 3 have been computed as a pre-step study in order to guide the NA-ESMD simulations. In these spectra, the width of the bands is slightly overestimated due to the limits of the simulation method, which does not precisely take into account all the above-mentioned effects. Nevertheless, several essential features of the experimental chlorophylls spectra could be captured by these simulations. Specifically, for the spectra calculated with the consideration of solvent effects, a comparison with the Chl-a experimental one, recorded in methanol, is reported.
Chl-a, the most known and heavily studied molecule in the chlorophylls family, represents a reference system since the considered investigated reduced model shows major similarities with the Chl-a structure: other chlorophyll derivatives contain functional groups that may play a fundamental role in the physical-chemical properties of the system, especially when protic solvents are involved.
Table I summarizes the central energy positions found for each manifold, together with the
computed energy difference between the Qx and Qy bands, since these are the bands of particular
interest in this study. A qualitative agreement between theoretical data and experimental results has been obtained. It is noteworthy that red-Chl-2MeOH reproduces better the energy difference
between the Qx and Qy bands: the simulated energy difference is 0.23 eV against an experimental
This is the aut
hor’s peer reviewed, accepted manuscript. Howe
ver, the online
version of record will be different
from this
version
once it has bee
n copyedited an d typeset. PLEASE CIT E THIS ARTI C LE AS DOI: 10.1063/5.0039949
8
value of 0.15 eV. The absorption spectrum of Chl-a obtained with semi-empirical methods showed
a more considerable energy difference between the two bands35. Furthermore, it is worth
emphasizing two aspects emerging from this first simulation: i) a strong mixing between the Qx and
Qy bands has been found in each model for red-Chl; ii) the solvent causes the bands to be closer
and guarantees that the mixing is much more effective when solvent effects have been included into the model, especially with the mixed implicit-explicit method.
Table I. Simulated and experimental central energy positions of Qx, Qy and Bx bands (reported in eV and in [nm]) and energy gap between the Qx and Qy bands (reported in eV).
Qx Qy Bx |ΔQx-Qy|
Gas phase 2.16 [575] 2.46 [503] 3.42 [362] 0.30 PCM 2.12 [584] 2.41 [515] 3.21 [386] 0.29 PCM+2MeOH 2.07 [600] 2.30 [540] 4.00 [310] 0.23 exp 1.86 [666] 2.01 [616] 2.87 [432] 0.15
To investigate the electronic energy redistribution after photo-excitation within the Q-bands, NA-ESMD simulations have been performed on the three considered models of red-Chl, starting from the 200 initial conditions properly selected from the ensemble.
After the initial excitation of the Qx band (S2 excited state), the evolution of the population over time
was recorded and plotted in Figure 4 for all considered models of red-Chl. The population of the
Qy and Qx bands has been calculated as the average over all the considered trajectories as a
function of time. As expected, the Qx population (black curve) decreases over time while the Qy
population (S1 excited state, red curve) increases for all the considered models of red-Chl.
Focusing our attention on the first tens of femtoseconds of the dynamic process, it is worth highlighting that, for all the investigated models, the crossing between the curves describing the
calculated populations of the Qx and Qy excited states can be observed at the very beginning of the
simulation: 30.2 fs for red-Chl-gas, 19.9 fs for red-Chl-PCM and 10.1 fs for red-Chl-2MeOH. A general trend for this crossing can be highlighted: a more complete inclusion of solvent effects reduces the time at which the crossing occurs. This evidence can be justified considering that the
mixing between Qx and Qy has been found to be more effective when solvent effects have been
included in the simulations and it becomes more evident with the inclusion of explicit solvent molecules. Considering these interesting results, a more in-depth investigation of the first tens of fs of NA-ESMD simulations has been performed and the relative time-constants have been computed for all considered models of red-Chl.
This is the aut
hor’s peer reviewed, accepted manuscript. Howe
ver, the online
version of record will be different
from this
version
once it has bee
n copyedited an d typeset. PLEASE CIT E THIS ARTI C LE AS DOI: 10.1063/5.0039949
9
In order to compute the non-radiative decay time-constant, a first order irreversible transformation
Qx→Qy has been assumed, with a rate constant k. In this framework, the population of each
excited state can be given as35:
𝑃𝑄𝑥(𝑡) = 𝑃𝑄𝑥0 𝑒
−𝐾𝑡 (2)
𝑃𝑄𝑦(𝑡) = 𝑃𝑄𝑥0+ 𝑃𝑄𝑦0− 𝑃𝑄𝑥(𝑡) (3)
where 𝑃𝑄
𝑥0and 𝑃𝑄𝑦0represent the initial populations (at t=0) of Qx and Qy, respectively. The fitting
procedure is carried out via a least-squares regression analysis on the first tens of fs of the Qx
population dynamics. The results of the fitting are shown in Figure 5 and the computed time constants for red-Chl-gas, red-Chl-PCM and red-Chl-2MeOH are listed in Table II.
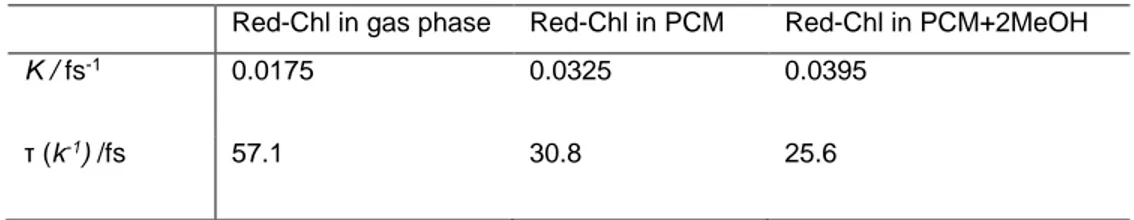
Table II Computed rate and time constants for red-Chl in gas phase and with consideration of solvent effects both with implicit and mixed implicit-explicit models.
Red-Chl in gas phase Red-Chl in PCM Red-Chl in PCM+2MeOH
K / fs-1 0.0175 0.0325 0.0395
τ (k-1) /fs 57.1 30.8 25.6
The trend observed for the crossing of the average populations is also found in the calculated time-constants. Indeed, moving from the gas phase to the solvated models, decreasing values of the time constant have been computed: for the gas phase a value of 57.1 fs was found, while when solvent effects have been taken into account, time constants of 30.8 fs and 25.6 fs have been obtained, for totally implicit and mixed implicit-explicit solvation models, respectively.
These results support the experimental findings that have captured the presence of an ultrafast intermediate step during the non-radiative relaxation process with an associated time constant of
40 fs26, and they may represent the evidence of a possible role played by the solvent during the
non-radiative decay mechanism.
III.B. Essential dynamic analysis
In order to verify a possible contribution of the solvent molecules during the relaxation mechanism, essential dynamic analysis has been performed on the data recorded after NA-ESMD simulations and, through this procedure, a set of eigenvectors and eigenvalues has been obtained for all considered models of red-Chl.
The computed eigenvalues are plotted against eigenvectors, as shown in Figure 6. Eigenvectors have been ordered in decreasing order of corresponding eigenvalues.
This is the aut
hor’s peer reviewed, accepted manuscript. Howe
ver, the online
version of record will be different
from this
version
once it has bee
n copyedited an d typeset. PLEASE CIT E THIS ARTI C LE AS DOI: 10.1063/5.0039949
10
Figure 6a shows the eigenvalues from the matrix constructed for the red-Chl-gas system, while Figures 6b and 6c show the eigenvalues from the matrices constructed for the red-Chl-PCM and red-Chl-2MeOH models, respectively. The eigenvalues computed from the simulations in which solvent effects have been taken into account show larger values than those computed from the simulation in the gas phase. This result is much more evident when explicit solvent molecules have been included in the simulation, showing a possible involvement of the solvent during the simulated dynamics.
Moreover, Figure 6 shows that the first eigenvectors account for the largest positional deviation for all investigated models of red-Chl. For this reason, in Figure 7 the fluctuations of the first 50 eigenvectors against time are reported for the red-Chl-gas, red-Chl-PCM and red-Chl-2MeOH systems. It is clear from this figure that the majority of the motions that have not reached their equilibrium fluctuation belong to the first eigenvector (named Eigenvector1), followed by the second eigenvector (named Eigenvector2) for which small oscillations have been found. This evidence allows focusing the attention only on Eigenvector1. Specifically, a comparison of its behavior during the simulation time for the three investigated models of red-Chl could be useful to verify if explicit solvent molecules are involved, activating the atomic fluctuations during the non-radiative decay.
Eigenvector1 in Figure 7 corresponds to a very small range of atomic fluctuations for red-Chl-gas and red-Chl-PCM (from about 0.001 to 0.006 Å), while a larger range of atomic fluctuations can be observed for the red-Chl-2MeOH model (of about 0.01 and 0.06 Å). To facilitate the comparison, the evolutions of the first eigenvector of all the considered models of red-Chl are gathered in Figure 8. The figure clearly shows more important atomic fluctuations when explicit solvent molecules have been included in the simulation. Moreover, it is worth emphasizing that the major atomic fluctuations are observed during the first 30 fs of simulations, then followed by less fluctuating positional variation, supporting a probable role of the solvent during the time range in
which most of the Qx-Qy crossing occurs. Starting from these pieces of evidence, in order to better
explore the role played by the solvent molecules during the simulated dynamics and to verify if the
considered explicit solvent molecules may influence the Qx-Qy crossing mechanism, the average
Mg-O(MeOH) distances over all the simulated trajectories have been computed for red-Chl-2MeOH.
The basic idea is to analyze the most relevant geometrical data to describe a possible chromophore-solvent interaction and to demonstrate that the atomic fluctuations described by Eigenvector1 are mainly related to this important Mg-O(MeOH) distance.
In Figure 9, the average Mg-O(MeOH) distances over all simulated trajectories as a function of time are reported. The distance fluctuations observed in this profile indicate that the relaxation
between the Qx and Qy bands is associated with a lengthening of the Mg-O(MeOH) distance from
2.23 Å to 2.30 Å occurring within 30 fs of the ESMD trajectory.
This is the aut
hor’s peer reviewed, accepted manuscript. Howe
ver, the online
version of record will be different
from this
version
once it has bee
n copyedited an d typeset. PLEASE CIT E THIS ARTI C LE AS DOI: 10.1063/5.0039949
11
Such evidence suggests that the atomic fluctuations described by Eigenvector1 are primarily related to the Mg-O(MeOH) distance and, moreover, indicates a potential role of the solvent during
the most crucial stage of the non-radiative Qx-Qy decay.
IV. CONCLUSIONS
Several recent studies have demonstrated the central role of solvation during the Qx-Qy
relaxation22,25,26-28. With this analysis we have paved the way for a computational strategy that
allows unraveling the essential details determining the Qx-Qy spacing and driving the ultrafast
Q-bands relaxation process.
Specifically, in this study, we have shown how methods based on surface-hopping molecular dynamic simulations in conjunction with TD-DFT method, can be applied to theoretically investigate the non-radiative relaxation process within the Q-band of chlorophylls, unraveling a possible role played by the solvent during these complex ultrafast dynamics. For this analysis, a chlorophyll-like model (red-Chl), containing the region that most determines its photophysical properties, has been considered.
At the very beginning, red-Chl has been studied in gas phase, then, to have a more accurate description of the environment around the chromophore and in order to verify if explicit solvent
methanol molecules may have a role during the Qx-Qy crossing mechanism, totally implicit and
mixed implicit-explicit solvation models have been used to take into account methanol solvent effects.
As a first step, in order to guide the set-up for NA-ESMD simulations, the absorption spectrum for each model has been simulated and compared with the experimental Chl-a spectrum recorded in methanol. Chl-a, the most known and studied molecule of the chlorophylls family, was chosen as reference because of its major similarities with the investigated reduced model. Generally, a good qualitative agreement between theoretical data and experimental result has been found and strong
vibronic coupling between the Qx and Qy bands has been observed especially when solvent effects
have been taken into account. Moreover, the energy difference between the Qx and Qy peaks
computed for the model including explicit solvent molecules better reproduces the experimental value. These findings represent the first evidence for a probable direct role of the solvent during the non-radiative decay process.
To have a description of the ultrafast intramolecular energy distribution after the photo-excitation within the Q-bands of red-Chl, NA-ESMD simulations have been performed on a large set of independent trajectories for each considered model.
The population of each state during the time has been computed as the average over all
trajectories: the crossing between the computed Qx and Qy population curves has been observed
at earlier time when explicit solvent molecules have been included in the simulations.
This is the aut
hor’s peer reviewed, accepted manuscript. Howe
ver, the online
version of record will be different
from this
version
once it has bee
n copyedited an d typeset. PLEASE CIT E THIS ARTI C LE AS DOI: 10.1063/5.0039949
12
In order to better explore the possible role of the solvent during the Qx-Qy crossing in red-Chl, an
essential dynamic analysis has been performed on the recorded data allowing finding the most important motions during the dynamics, expressed in terms of positional atomic fluctuations. This analysis has indicated a possible implication of the solvent molecules during the most crucial stage
of the non-radiative Qx-Qy decay of chlorophylls and a deeper investigation has shown that the
principal atomic fluctuations observed are mainly related to the Mg-O(MeOH) distance.
This analysis represents a preliminary step for further investigations, for instance on analysis of the active vibrational normal modes. Moreover, as a future perspective, it would be interesting to compare the timescales computed for the internal conversion with the typical timescale involved in the energy transfer processes between chlorophylls in antenna complexes. This will contribute to reach a deeper insight into the mechanism of the energy transport, assessing the possible
contribution of the Qx state in this essential process.
SUPPLEMENTARY MATERIAL
See the supplementary material for the dynamic convergence check (Figure S1).
DATA AVAILABILITY STATEMENT
The data that support the findings of this study are available within the article and its supplementary material.
ACKNOWLEDGEMENTS
This work is financially supported by the “Ministero dell’Istruzione, dell’Università e della Ricerca” MIUR through the PRIN2015 project (Prot. No. 2015XBZ5YA) entitled: Toward quantum photovoltaic: ultrafast energy and charge transport in hybrid nanomaterials. The high performance computer facilities of University of Modena and Reggio Emilia and of the SMART Laboratory of Scuola Normale Superiore di Pisa (https://smart.sns.it) are acknowledged for providing computer
resources. EC acknowledges also MIUR PRIN2017 project (Prot. No. 2017A4XRCA)
.
This is the aut
hor’s peer reviewed, accepted manuscript. Howe
ver, the online
version of record will be different
from this
version
once it has bee
n copyedited an d typeset. PLEASE CIT E THIS ARTI C LE AS DOI: 10.1063/5.0039949
13
REFERENCES
1. B. Grimm, R. J. Porra, W. Rüdiger, H. Scheer, H., Chlorophylls and Bacteriochlorophylls (Advances in Photosynthesis and Respiration), Springer, Dordrecht, (2006).
2. L. O. Björn, G. C. Papageorgiou, R. E. Blankenship, & Govindjee, Photosynth. Res. 99, 85 (2009). 3. J. Z. Zhang, K. P. Sokol, N. Paul, E. Romero, R. van Grondelle, Nat. Chem. Biol. 12, 1046 (2016) 4. R. E. Blankenship, Molecular Mechanisms of Photosynthesis, Blackwell Publishing: Williston, VT,
USA, (2002).
5. R. Croce, H. van Amerongen, Nat. Chem. Biol. 10, 492 (2014).
6. G. D. Scholes, G. R. Fleming, A. Olaya-Castro, R. van Grondelle, Nat. Chem. 3, 763 (2011). 7. H. Scheer, Chlorophylls and Bacteriochlorophylls, 1-26 (2006).
8. T. Renger, Prim. Process. Photosynth. Part 1, (Royal Society of Chemistry, Cambridge), chap. 2, 39–97 Royal Society of Chemistry, Cambridge (2007).
9. H. van Amerongen, R. van Grondelle, L. Valkūnas, Photosynthetic excitons (World Scientific) (2000).
10. E. Romero, V. I. Novoderezhkin, R. van Grondelle, Nature 543, 355 (2017).
11. F. Zheng, S. Fernandez-Alberti, S. Tretiak, Y. Zhao, J.Phys. Chem. B 121, 5331 (2017). 12. R. F. Kelley, M. J. Tauber, T. M. Wilson, M. R. Wasielewski, Chem. Commun. 42, 4407 (2007). 13. R. van Grondelle, V. I. Novoderezhkin, Phys. Chem. Chem. Phys. 8, 793 (2007).
14. G. S. Engel et al, Nature 446, 782 (2007). 15. E. Collini et al, Nature 463, 644 (2010).
16. G. Panitchayangkoon, G. et al. Proc. Natl. Acad. Sci. 108, 20908 (2011). 17. K. L. M. Lewis, J. P. Ogilvie, J. Phys. Chem. Lett. 3, 503 (2012).
18. E. Collini, Chem. Soc. Rev. 42, 4932 (2013). 19. E. Romero, Nat. Phys. 10, 676 (2014). 20. G. D. Scholes, et al, Nature 545, 647 (2017). 21. M. Gouterman, J. Mol. Spectrosc. 6, 138 (1961). 22. J. R. Reimers et al, Sci. Rep. 3, 2761 (2013).
23. M. Rätsep, J. Linnanto, A. Freiberg, A. J. Chem. Phys. 130, 194501 (2009). 24. J. R.Reimers, M. Rätsep, A. Freiberg, Dynamics. Front. Chem. 8, 588289 (2020). 25. Y. Shi, L.-Y, Liu, & K. –L Han, Chem. Phys. Lett. 410, 260 (2005).
This is the aut
hor’s peer reviewed, accepted manuscript. Howe
ver, the online
version of record will be different
from this
version
once it has bee
n copyedited an d typeset. PLEASE CIT E THIS ARTI C LE AS DOI: 10.1063/5.0039949
14
26. E. Meneghin, C. Leonardo, A. Volpato, L. Bolzonello, E. Collini, Sci. Rep. 7, 11389 (2017). 27. K. L. Wells, Z. Zhang, J. R. Rouxel, H.-S. Than, J. Phys. Chem. B, 117 8, 2294 (2013) 28. S. Seckin Senlik, V. R. Policht, J. P. Ogilvie, J. Phys. Chem. Lett., 6 13, 2413 (2015) 29. R. Crespo-Otero, M. Barbatti, Chem. Rev. 118, 7026 (2018).
30. P. M. Shenai, S. Fernandez-Alberti, W. P. Bricker, S. Tretiak, Y. Zhao, J. Phys. Chem. B 120, 49 (2016).
31. T. R. Nelson, A. J. White, J. A. Bjorgaard, A. E. Sifain, Y. Zhang, B. Nebgen, S. Fernandez-Alberti, D. Mozyrsky, A.E. Roitberg, S. Tretiak, Chem. Rev. 120, 2215 (2020).
32. H. Song, S. A. Fischer, Y. Zhang, C. J. Cramer, S. Mukamel, N. Govind, S. Tretiak, J. Chem. Theory Comput, 16 (10), 6418 (2020).
33. I. Conti, G. Cerullo, A. Nenov, M. Garavelli, J. Am. Chem. Soc. 142 (38), 16117 (2020). 34. E. V. Stolyarov, A. J. White, D. Mozyrsky, J. Chem. Phys. 153, 074116 (2020).
35. W. P. Bricker, P. M. Shenai, A. Ghosh, L. Zhengtang, M. G. M. Enriquez, P. H. Lambrev, H. Tan, S. L. Cynthia, S. Tretiak, S. Fernandez-Alberti, Y. Zhao, Sci. Rep. 5, 13625 (2015).
36. J. C. Tully, J. Chem. Phys. 137, 22A301 (2012). 37. J. C. Tully, J. Chem. Phys. 93, 1061 (1990).
38. M. Fortino, J. Bloino, E. Collini, L. Bolzonello, M. Trapani, F. Faglioni, A. Pedone, Phys. Chem. Chem. Phys. 21, 3512 (2019).
39. M. Fortino, E. Collini, A. Pedone, J. Bloino, Phys. Chem. Chem. Phys. 22, 10981 (2020).
40. P. Cimino, A. Pedone, E. Stendardo and V. Barone, Phys. Chem. Chem. Phys. 12, 3741 (2010). 41. A. Pedone, M. Biczysko and V. Barone, ChemPhysChem, 11, 1812 (2010).
42. A. Pedone, G. Prampolini, S. Monti and V. Barone, Phys. Chem. Chem. Phys. 13, 16689 (2011). 43. A. Pedone, G. Prampolini, S. Monti and V. Barone, Chem. Mater. 23, 5016 (2011).
44. D. Presti, F. Labat, A. Pedone, M. J. Frisch, H. P. Hratchian, I. Ciofini, M. C. Menziani and C. Adamo, J. Chem. Theory Comput. 10, 5577 (2014).
45. L. Fiedor, Biochemistry, 45 (6), 1910 (2006)
46. V. Barone, M. Biczysko, M. Borkowska-Panek, J. Bloino, J. Chem. Phys. Chem. 15, 3355 (2014). 47. A. Amadei, A. B. M. Linssen, H. J. C. Berendsen, PROTEINS: Structure, Function, and Genetics 17,
412 (1993).
48. I. Daidone, A. Amadei, WIREs Comput Mol Sci doi: 10.1002/wcms.1099 (2012). 49. M. Barbatti, WIREs: Comp. Mol. Sci. 1, 620, (2011).
This is the aut
hor’s peer reviewed, accepted manuscript. Howe
ver, the online
version of record will be different
from this
version
once it has bee
n copyedited an d typeset. PLEASE CIT E THIS ARTI C LE AS DOI: 10.1063/5.0039949
15
50. J. C. Tully, R. K Preston, J. Chem. Phys. 55, 562 (1971). 51. M. Barbatti, M., K. Sen, Int. J. Quantum Chem. 116, 762 (2016).
52. S. Fernandez-Alberti, A. E. Roitberg, V. D. Kleiman, T. Nelson, S. Tretiak, S. Shishiodoshi, J. Chem. Phys. 137, 22A526 (2012).
53. M. Barbatti, M. Ruckenbauer, F. Plasser, J. Pittner, G. Granucci, M. Persico, H. Lischka, WIREs: Comp. Mol. Sci. 4, 26 (2014).
54. M. J. Frisch, G. W. Trucks, H. B. Schlegel, G. E. Scuseria, M. A. Robb, J. R. Cheeseman, G. Scalmani, V. Barone, B. Mennucci, G. A. Petersson, et al. Gaussian 09, Revision D.01. Gaussian, Inc., Wallingford CT (2013).
55. V. Barone, M. Biczysko, M. Borkowska-Panek, J. Bloino, J. Chem. Phys. Chem. 15, 3355 (2014). 56. E: Cancès, B. Mennucci, J. Tomasi, J. Chem. Phys. 107, 3032 (1997).
57. F. Plasser, M. Barbatti, A. J. A. Aquino, H. Lischka, J. Phys. Chem. A 113, 8490 (2009). 58. A. Sirohiwal, R. Berraud-Pache, F. Neese, R. Izsàk, D. A. Pantazis, J. Phy. Chem. B 124, 8761
(2020).
59. T. Pullerits, V. Sundstrom, Acc. Chem. Res. 29 (8), 381 (1996).
Figure 1. a) Simplified model of the Chl-a molecule (red-Chl). b) Model of red-Chl with the inclusion of two explicit methanol solvent molecules.
Figure 2. Equilibrium geometries of red-Chl a) in gas phase Chl-gas) b) including solvent effects with a totally implicit model (red-Chl-PCM) and c) including solvent effects with a implicit-explicit model (red-Chl-2MeOH), optimized at the CAM-B3LYP/6-31G(d,p) level of theory.
Figure 3. Absorption spectra built considering transitions from the ground state to the excited states (S1, S2, S3) for Chl-gas,
red-Chl-PCM and red-Chl-2MeOH. The spectra have been simulated as convolutions of the single transition intensities computed for the constructed 800 initial configurations at the CAM-B3LYP/6-31G(d,p) level of theory.
Figure 4. Population of the Qx and Qy bands averaged over all trajectories as a function of the time for red-Chl-gas, red-Chl-PCM and
red-Chl-2MeOH.
Figure 5. Population of the Qx band as a function of time for red-Chl-gas, red-Chl-PCM and red-Chl-2MeOH (circles = simulated
points; line = fit).
Figure 6. Eigenvalues against Eigenvectors index obtained from covariance matrices of a) Chl-gas, b) Chl-PCM and c) red-Chl-2MeOH. Eigenvectors have been ordered in decresing order of corresponding eigenvalues.
This is the aut
hor’s peer reviewed, accepted manuscript. Howe
ver, the online
version of record will be different
from this
version
once it has bee
n copyedited an d typeset. PLEASE CIT E THIS ARTI C LE AS DOI: 10.1063/5.0039949
16
Figure 7. Motion along several eigenvectors obtained from the covariance matrices of a) gas, b) PCM and c) red-Chl-2MeOH.
Figure 8. Motion along the first eigenvector (Eigenvector1) obtained from the covariance matrices of a) red-Chl-gas, b) red-Chl-PCM and c) red-Chl-2MeOH.
Figure 9. The average Mg-O(MeOH) distances over all simulated trajectories during the time for red-Chl-2MeOH.
This is the aut
hor’s peer reviewed, accepted manuscript. Howe
ver, the online
version of record will be different
from this
version
once it has bee
n copyedited an d typeset. PLEASE CIT E THIS ARTI C LE AS DOI: 10.1063/5.0039949
MeOH MeOH
![Table I. Simulated and experimental central energy positions of Q x , Q y and B x bands (reported in eV and in [nm]) and energy gap between the Q x and Q y bands (reported in eV)](https://thumb-eu.123doks.com/thumbv2/123dokorg/4784538.48552/8.1020.217.950.336.533/table-simulated-experimental-central-energy-positions-reported-reported.webp)