School of Industrial and Information Engineering
Department of Chemistry, Materials and Chemical Engineering “Giulio Natta”
Master Degree in Materials Engineering and Nanotechnology
ANALYSIS OF THE EFFECTS OF DIFFERENT CARBONACEOUS
PHASES IN THE MICROPOROUS LAYER COMPOSITION ON THE
RELIABILITY AND DURABILITY OF PEM FUEL CELLS
Supervisor: Dr. Saverio LATORRATA
Co-supervisor: Prof. Paola GALLO STAMPINO Co-supervisor: Prof. Giovanni DOTELLI
Master Thesis of:
Marco MARIANI Matr. 875542
Edoardo RIVA Matr. 873825
List of Figures 7
List of Tables 13
Abstract 15
Sommario 16
Introduction 19
1 Introduction to Fuel Cells 21
1.1 Historical Development of Fuel Cells . . . 21
1.2 What is a Fuel Cell? . . . 23
1.3 Classification of Fuel Cells . . . 25
1.3.1 Low Temperature Fuel Cells . . . 26
1.3.1.1 Polymer Electrolyte Membrane Fuel Cell (PEMFC) . . . 26
1.3.1.2 Direct Methanol Fuel Cell (DMFC) . . . 28
1.3.1.3 Alkaline Fuel Cell (AFC) . . . 29
1.3.1.4 Phosphoric Acid Fuel Cell (PAFC) . . . 30
1.3.2 High Temperature Fuel Cells . . . 32
1.3.2.1 Molten Carbonate Fuel Cell (MCFC) . . . 32
1.3.2.2 Solid Oxide Fuel Cell (SOFC) . . . 34
1.4 Hydrogen . . . 39
1.4.1 Production . . . 40
1.4.1.1 Fuel Processing . . . 40
1.4.1.1.1 Steam Methane Reforming . . . 40
1.4.1.1.2 Partial Oxidation of Hydrocarbons . . . 42
1.4.1.1.3 Autothermal Reforming . . . 42
1.4.1.1.4 Thermal Decomposition of Hydrocarbons . . . 42
1.4.1.1.5 Onboard Reforming of Hydrocarbons to Hydrogen 44 1.4.1.2 Hydrogen from Water . . . 44
1.4.1.2.1 Electrolysis . . . 44
1.4.1.2.2 Thermolysis . . . 44
1.4.1.2.3 Photocatalytic Water-Splitting . . . 45
1.4.2 Storage . . . 48
1.4.2.1 Gas Phase . . . 48
1.4.2.2 Liquid Phase . . . 50
1.4.2.3 Solid Phase . . . 50
1.4.2.3.1 Carbon Materials . . . 51
1.4.2.3.2 Other HSA Materials . . . 51
1.4.2.3.3 Hydrides . . . 52
2 Polymer Electrolyte Membrane Fuel Cells 55 2.1 Fuel Cell Structure . . . 55
2.1.1 Polymeric Membrane . . . 56
2.1.2 Electrodes . . . 61
2.1.3 Gas Diffusion Medium (GDM) . . . 63
2.1.3.1 Gas Diffusion Layer (GDL) . . . 64
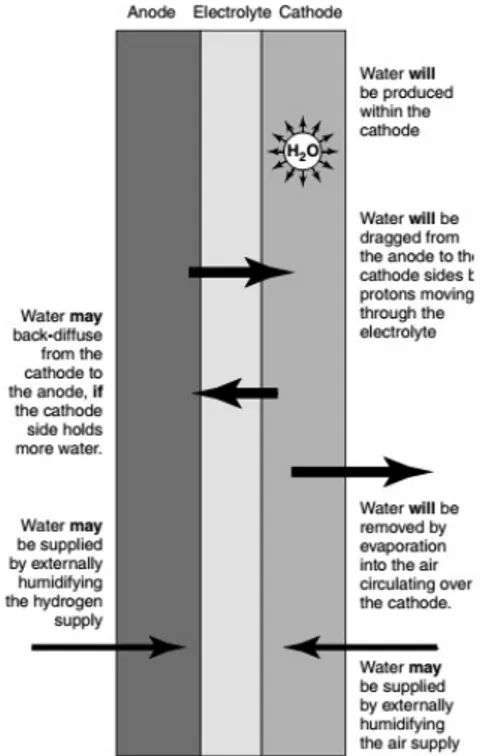
2.1.3.2 Microporous Layer (MPL) . . . 67 2.1.4 Gaskets . . . 69 2.1.5 Bipolar Plates . . . 69 2.2 Water Management . . . 72 2.3 Electrochemistry . . . 72 2.3.1 Thermodynamics . . . 73 2.3.2 Kinetics . . . 75 2.3.3 Polarization Curves . . . 76 2.3.3.1 Activation Polarization . . . 77
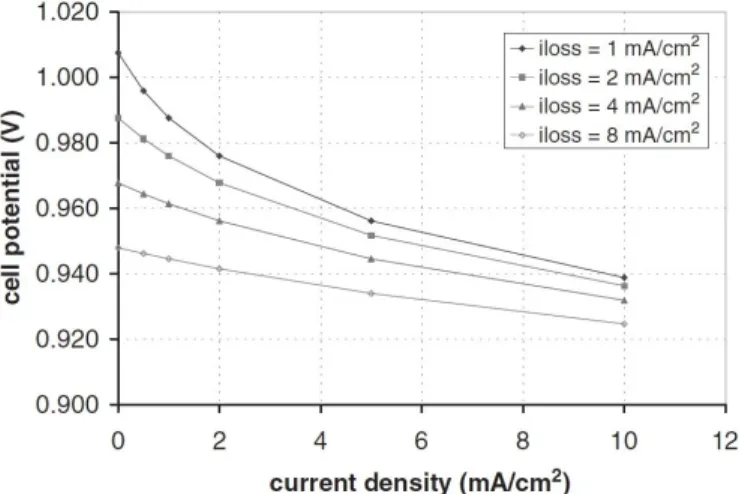
2.3.3.2 Internal Currents and Crossover Losses . . . 78
2.3.3.3 Ohmic Losses . . . 79
2.3.3.4 Concentration Polarization . . . 80
2.3.4 Efficiency . . . 80
2.3.4.1 Comparison with Internal Combustion Engines . . . 82
3 Degradation and Durability of the Cell 83 3.1 Introduction on the State of the Art . . . 83
3.2 Evaluation Techniques . . . 83 3.2.1 In-Situ . . . 83 3.2.2 Ex-Situ . . . 84 3.3 Degradation Causes . . . 84 3.3.1 Membrane . . . 85 3.3.1.1 Mechanical Degradation . . . 85 3.3.1.2 Thermal Degradation . . . 85 3.3.1.3 Chemical/Electrochemical Degradation . . . 86 3.3.2 Catalyst Layer . . . 86 3.3.2.1 Coarsening/Oxidation . . . 86 3.3.2.2 Carbon Corrosion . . . 87
3.3.3.1.2 Freeze-Thaw . . . 88 3.3.3.1.3 Erosion . . . 89 3.3.3.2 Physico-Chemical Degradation . . . 89 3.3.3.2.1 Chemical Dissolution . . . 89 3.3.3.2.2 Electrochemical Degradation . . . 89 3.3.4 Bipolar Plates . . . 90 3.4 Accelerated-Stress-Tests for GDM . . . 90
4 Materials and Methods 93 4.1 Introduction . . . 93
4.2 Gas Diffusion Layer . . . 93
4.2.1 Carbon Cloth . . . 93
4.2.2 GDL Hydrophobizing Solution Composition. . . 93
4.2.3 GDL Preparation and Hydrophobizing Treatment. . . 95
4.3 Microporous Layer . . . 96
4.3.1 Ink Composition . . . 96
4.3.1.1 Carbon Black-based Ink . . . 96
4.3.1.2 Graphene Nanoplatelets-based Ink . . . 98
4.3.2 Ink Preparation and Deposition . . . 99
4.4 Membrane Electrode Assembly . . . 102
4.5 GDM Characterization Methods . . . 103
4.5.1 Optical Microscopy . . . 103
4.5.2 Static Contact Angle Measurements . . . 103
4.5.3 Mercury Intrusion Porosimetry . . . 105
4.5.4 Water Permeability Measurement . . . 107
4.5.5 Electrochemical Characterization . . . 108
4.5.5.1 Fuel Cell Assembly and Test Station . . . 109
4.5.5.2 Polarization Curves Experimental Derivation and their Implications . . . 110
4.6 Ex-Situ Accelerated Stress Tests . . . 113
4.6.1 Chemical Accelerated Stress Test . . . 113
4.6.2 Mechanical Accelerated Stress Test . . . 114
5 Analysis of the Results 117 5.1 Characterization of the GDM with CB-based MPL . . . 117
5.1.1 Characterization after Electrical Repeatability Test . . . 121
5.1.2 Characterization after Chemical AST . . . 126
5.1.3 Characterization after Mechanical AST . . . 130
5.2 Characterization of the GDM with GNPs-based MPL . . . 134
5.2.1 Characterization after Electrical Repeatability Test . . . 137
5.2.2 Characterization after Chemical AST . . . 140
5.2.3 Characterization after Mechanical AST . . . 143
1.1 Scheme of: (a) original Grove’s cell for the first fuel cells; (b) a single
electrodes couple. . . 22
1.2 Energy Partners Green Car, the first PEMFC-powered passenger automobile, 1993. . . 22
1.3 Processes: (a) electrolysis of water; (b) recombination of hydrogen and oxygen. . . 23
1.4 Generic scheme of material and energy flows exchanged between a fuel cell and the environment. . . 24
1.5 Classification of thermodynamics systems. . . 25
1.6 Scheme of the reactants, the by-products and the charge carriers for the different types of fuel cells. . . 26
1.8 Schematic representation of a direct methanol fuel cell (DMFC). . . 28
1.9 Schematic representation of a alkaline fuel cell (AFC). . . 29
1.10 Schematic representation of a phosphoric acid fuel cell (PAFC) . . . 31
1.11 Schematic representation of: (a) a molten carbonates fuel cell (MCFC); (b) a plant combining an MCFC and a fuel-product recycling system. . . 33
1.12 Schematic representation of a solid oxide fuel cell (SOFC). . . 35
1.13 (a) End view of tubular type SOFC by Siemens Westinghouse. (b) Ring-type SOFC with metal cell interconnects by Sulzer Hexis Ltd. . . 37
1.14 Map of the possible hydrogen production’s strategies. . . 41
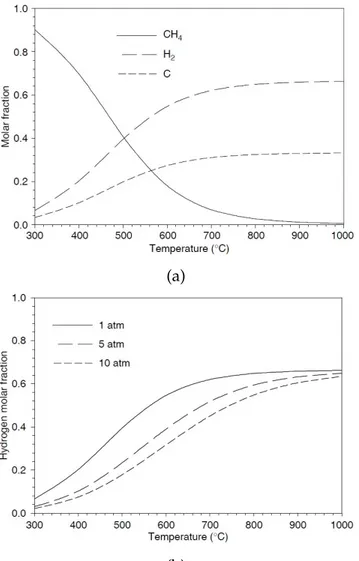
1.15 (a) Thermodynamic equilibrium data for methane decomposition reaction at atmospheric pressure. (b) Thermodynamic equilibrium molar fraction of hydrogen at different pressures as a function of temperature. . . 43
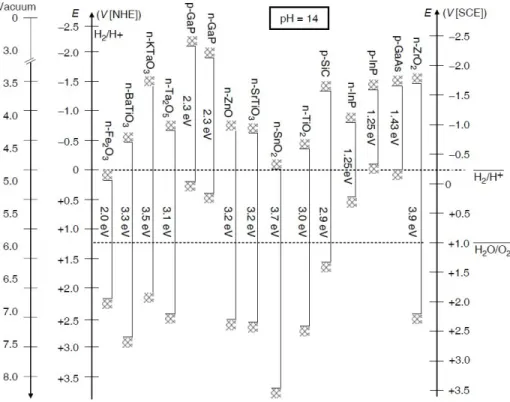
1.16 Positions of band edges of various semiconductors in acqueous electrolytes with pH = 14. . . 46
1.17 Pathways from biomass to hydrogen. . . 46
1.18 Important gasification reactions. . . 47
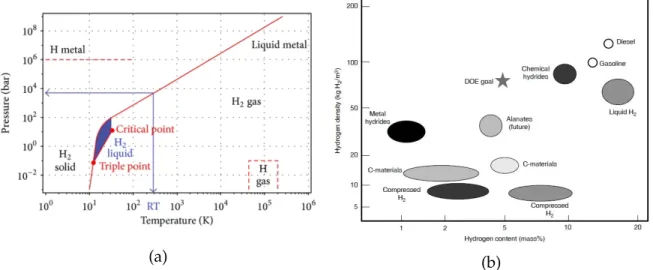
1.19 (a) Hydrogen phase diagram. (b) Volumetric versus mass densities achieved by various hydrogen-storage technologies. . . 48
1.20 Tank model for storage of gaseous hydrogen. . . 49
fullerenes; (d) Calculated amount of adsorbed hydrogen in weight percent on CNTs assuming condensation of hydrogen: 1) Monolayer adsorbed at the surface of nanotubes as a function of the number of shells (NS) (markers and line, axis: left and bottom) and 2) hydrogen condensed in the cavity of nanotubes as a function of the diameter (dashed lines, axis: left and top) for various number of shells, NS = 1 (SWNT), NS = 2, NS =
5, NS = 10. . . 52
2.1 (a) PEMFC constituents. (b) Complete scheme of a functioning PEMFC. . . 57
2.2 Generic chemical structure of a PFSA membrane. Nafion features x = 6 -10, y = 1000 and z = 1. . . 58
2.3 Water clusters in the ionomer. . . 58
2.4 Conductivity of various proton conductive membranes at 30◦C as a function of state of membrane hydration. . . 59
2.5 Scheme of: (a) the proton hopping mechanism; (b) the water transport by vehicular mechanism. . . 60
2.6 Scheme of the three-phase boundary in the catalyst layer. . . 61
2.7 (a) TEM image of a PEM fuel cell catalyst. (b) Schematic structure of a carbon-supported catalyst. . . 62
2.8 Possible strategies for the preparation of the MEA. . . 62
2.9 (a) Scheme of the three-layer structure comprehending from the top to the bottom: gas diffusion layer, catalyst layer and ionomer. (b) SEM micrograph of a PEMFC MEA cross-section (false colours applied for clarity). 63 2.10 Scheme of the half cell, comprehending the Microporous Layer and the Gas Diffusion Layer. . . 64
2.11 SEM micrographs of a carbon cloth, on the left, and a carbon paper, on the right. . . 65
2.12 Fuel cell performance with treated and untreated carbon fiber paper. . . 66
2.13 SEM images of the MPL surface and section. . . 67
2.14 Fuel cell performance with and without MPL. . . 68
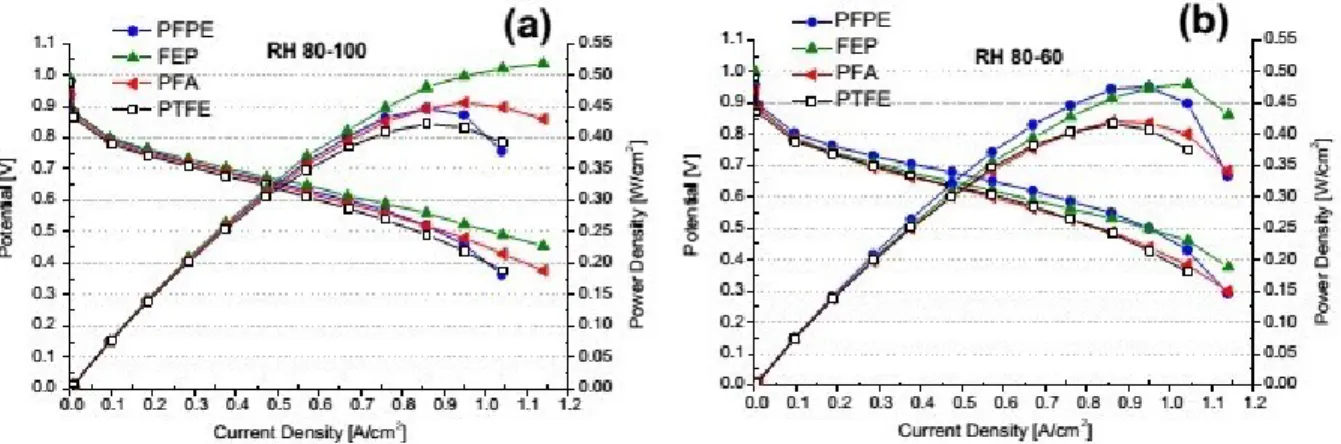
2.15 Polarization and power density curves of running fuel cells assembled with the GDMs hydrophobized with different polymers at 60◦C and (a) RH 80-100 and (b) 80-60. . . 69
2.16 Example of bipolar plate. . . 70
2.17 Example of differenti flow fields patterns on the bipolar plates. . . 71
2.18 Schematic representation of the flows of water inside the fuel cell. . . 73
2.19 Polarization curve model divided by ranges of potential losses. . . 77
2.20 Effect of the exchange current density on the voltage drop. . . 78
2.21 Graphic representation of the Tafel equation and identification of the parameters. . . 78
2.22 Effect of the current loss on the voltage drop as a function of the current density. . . 79
3.1 Stress–strain curves of as-fabricated MEA tested at 25◦C and 50 % RH. . . 85
3.2 Representation of anodic7cathodic voltage as a function of the distance from the anode inlet and of the electrochemical reactions in a normal feeding area (region A) and in a fuel-poor area (region B) of the cell, in case of local fuel starvation. . . 90
4.1 SEM images of a carbon cloth sample: (a) top view; (b) side view. . . 94
4.2 FEP moleculare structure. . . 94
4.3 Cabot Carbon Black powder. . . 98
4.4 SEM image of GNPs powder . . . 99
4.5 ULTRA-TURRAX T50 components. . . 100
4.6 Aspect of the CB-based ink after mixing. . . 100
4.7 Blade coater "K Control Coater model 101" . . . 101
4.8 Blade coating scheme. . . 101
4.9 Thermal treatment cycle. . . 102
4.10 Pictures captured at the optical microscope of: (a) CB-based MPL; (b) GNP-based MPL. . . 103
4.11 Picture of the CCM used for the tests. . . 103
4.12 Optical Microscope used to capture the pictures of the GDM. . . 104
4.13 Equipment used to measure the static contact angle. . . 104
4.14 Picture of a single drop on an hydrophobic surface. . . 105
4.15 Picture and scheme of a mercury penetrometer. . . 106
4.16 Picture of the instrumentation used for the mercury intrusion porosimetry. 107 4.17 Scheme of the permeability’s measurement system. . . 108
4.18 Picture of the disassembled fuel cell. . . 109
4.19 Schematic representation of the fuel cell testing system. . . 110
4.20 Picture of the fuel cell test station and electronic load. . . 111
4.21 (a) Polarization and power density curves as a function of the current density; (b) Efficiency curve as a function of power density. . . 112
5.1 (a) Logarithmic differential pore size distribution and (b) cumulative pore volume of the GDL and the GDM with pristine CB-based MPL. . . 118
5.2 OM images of pristine CB-based MPL. . . 119
5.3 (a) Variation of the water permeability value and (b) average value of the permeability for GDM with pristine CB- and GNPs-based MPLs. . . 119
5.4 Pristine CB-based MPLs: (a) Polarization curve; (b) Power density curve; (c) Efficiency curve; (d) Resistances comparison. . . 120
5.5 OM images of CB-based MPL after the first repeatability test. . . 122
5.6 Repeatability cycle for first couples of pristine CB-based MPLs: (a) Polarization curve; (b) Power density curve; (c) Efficiency curve; (d) Resistances comparison. . . 123
Resistances comparison. . . 124
5.8 Porosimetry of CB-based MPLs after first repeatability cycles: (a)
Logarithmic differential pore size distribution; (b) Focus on the
microporosity; (c) Cumulative pore volume. . . 125
5.9 OM images of CB-based MPL after acid AST. . . 127
5.10 Acid-treated CB-based MPLs: (a) Polarization curve; (b) Power density curve; (c) Efficiency curve; (d) Resistances comparison. . . 128 5.11 Porosimetry of acid-treated CB-based MPLs: (a) Logarithmic differential
pore size distribution; (b) Focus on the microporosity; (c) Cumulative pore volume. . . 129 5.12 OM images of CB-based MPL after mechanical AST . . . 131 5.13 Mechanically-treated CB-based MPLs: (a) Polarization curve; (b) Power
density curve; (c) Efficiency curve; (d) Resistances comparison. . . 132 5.14 Porosimetry of mechanically-treated CB-based MPLs: (a) Logarithmic
differential pore size distribution; (b) Focus on the microporosity; (c) Cumulative pore volume. . . 133 5.15 OM images of pristine GNPs-based MPL. . . 135 5.16 (a) Logarithmic differential pore size distribution and (b) cumulative pore
volume of the GDMs with pristine CB-based and GNPs-based MPLs. . . . 135 5.17 Thermogravimetric analysis of the carbon black and the graphene
nanoplatelets. . . 136 5.18 Pristine GNPs-based MPLs: (a) Polarization curve; (b) Power density
curve; (c) Efficiency curve; (d) Resistances comparison. . . 136 5.19 OM image of GNPs-based MPL after the first repeatability test. . . 137 5.20 Repeatability cycle for first couple of pristine GNPs-based MPLs:(a)
Polarization curve; (b) Power density curve; (c) Efficiency curve; (d) Resistances comparison. . . 138 5.21 Repeatability cycle for second couple of pristine CB-based MPLs: (a)
Polarization curve; (b) Power density curve; (c) Efficiency curve; (d) Resistances comparison. . . 139 5.22 Porosimetry of pristine GNPs-based MPLs after first repeatability test: (a)
Logarithmic differential pore size distribution; (b) Cumulative pore volume. 139 5.23 OM images of GNPs-based MPL after acid AST. . . 141 5.24 Acid-treated GNPs-based MPLs: (a) Polarization curve; (b) Power density
curve; (c) Efficiency curve; (d) Resistances comparison. . . 141
5.25 Porosimetry of acid-treated GNPs-based MPLs: (a) Logarithmic
differential pore size distribution; (b) Cumulative pore volume. . . 142 5.26 OM images of GNPs-based MPL after mechanical AST. . . 144 5.27 Mechanically-treated GNPs-based MPLs: (a) Polarization curve; (b) Power
density curve; (c) Efficiency curve; (d) Resistances comparison. . . 144 5.28 Porosimetry of mechanically-treated GNPs-based MPLs: (a) Logarithmic
5.30 Comparison of: (a) power density achieved at i = 0.55 A cm ; (b) peak power density; (c) ohmic resistance; (d) mass transfer resistance. . . 148 5.31 (a) Logarithmic differential pore size distribution and (b) cumulative pore
1.1 Comparison of technical characteristics of fuel cell technologies. . . 38
1.2 Higher and Lower Heating Values of different fuels. . . 39
1.3 Estimated costs of hydrogen production, transportation and distribution [$/kg] . . . 40
1.4 Water-reactive hydrides storing densities. . . 53
1.5 Thermally-reactive hydrides storing densities. . . 53
3.1 AST procedures for GDM durability evaluation. . . 92
4.1 Properties of the carbon cloth. . . 94
4.2 Properties of PTFE and FEP. . . 95
4.3 Properties of the FEP water dispersion. . . 95
4.4 CB-based ink composition. . . 96
4.5 IPA properties. . . 97
4.6 Carbon nanotubes properties. . . 98
4.7 GNP-based ink composition. . . 98
4.8 GNPs powder properties. . . 99
4.9 Sulphuric acid properties. . . 114
4.10 Mass loss due to adhesion. . . 115
5.1 Variation of the parameters calculated from the polarization curve of acid-treated CB-based MPLs with respect to the pristine sample. . . 126
5.2 Variation of the parameters calculated from the polarization curve mechanically-treated CB-based MPLs with respect to the pristine sample. . 130
5.3 Variation of the parameters calculated from the polarization curve acid-treated GNPs-based MPLs with respect to the pristine sample. . . 140
5.4 Variation of the parameters calculated from the polarization curve
Proton exchange membrane fuel cells (PEMFCs) are energy conversion systems constituted of a series of distinguished components. One of the most recently introduced is the microporous layer (MPL), that coats the gas diffusion layers (GDLs) and improves dramatically the performance and the water management of the cell.
Two formulations based on conventional carbon black (CB) and graphene nanoplatelets (GNPs), both containing carbon nanotubes (CNTs), were selected for the production of MPLs inks, in order to evaluate how the two different carbonaceous phases affect the electrical performances of PEMFCs and the durability of the microporous coatings. GNPs have been recently proposed in some studies as an effective alternative to CB in MPLs, which might lead to the development of a more compact layer with enhanced PEMFC performances and durability.
Gas diffusion media (GDMs) were obtained by the blade coating deposition technique of the MPLs onto carbon cloth GDLs, exploiting fluorinated ethylene propylene (FEP) as fluorinated polymer for the tissue treatment and as hydrophobic phase of the MPL ink, because of its demonstrated enhancement in the water management compared to the commonly employed polymer nowadays, PTFE.
The electrical output of fuel cell assembly, mounting CB- or GNPs-based pristine MPLs, was analysed by recording polarization curves under different operating conditions of relative humidity (RH) and temperature. Moreover, the best performing operative condition for the two kinds of samples was selected for repeatability tests, in order to evaluate their reliability.
The durability of the GDMs was assessed by performing accelerated stress tests (ASTs) on both CB- and GNP-based samples aiming to detect the main degradation mechanism. A chemical AST was carried out by exposing GDMs to a concentrated sulphuric acid solution for 1000 h and a mechanical AST was performed by subjecting samples to elevated air flow rates in a dummy cell, again for 1000 h. Then, the polarization curves of the degraded samples were recorded, in order to evaluate the effects of the two kinds of degradation mechanisms on the electrical output of the fuel cell.
In each case, the electrochemical characterization was matched with optical microscopy,
static contact angle analysis, mercury intrusion porosimetry and permeability
measurements, in order to relate the morphology of the MPLs of different compositions to the cell performance and to better understand the effects of the degradation mechanisms on the samples.
Le proton exchange membrane fuel cells (PEMFCs) sono sistemi di conversione
dell’energia costituiti da una serie di diversi componenti. Tra quelli introdotti più
recentemente si ha il microporous layer (MPL), che riveste i gas diffusion layers (GDLs) e migliora drasticamente le prestazioni e la gestione dell’acqua della cella.
Due formulazioni basate sull’uso di carbon black (CB) e nanoplatelets di grafene (GNPs), entrambe contenenti nanotubi di carbonio (CNTs), sono state selezionate per la produzione di inchiostri per MPLs, così da valutare come le due differenti fasi carboniose influenzino le prestazioni elettriche delle PEMFCs e la durabilità dei rivestimenti microporosi. GNPs sono stati recentemente proposti da alcuni studi come un’efficace alternativa al CB nei MPLs, che potrebbe portare allo sviluppo di strati più compatti con più elevate prestazioni e durabilità delle PEMFCs.
I gas diffusion media (GDMs) sono stati ottenuti tramite la tecnica di deposizione del blade coating di MPLs su tessuti carboniosi, utilizzati come gas diffusion layers (GDLs). É stato sfruttato l’etilen-propilene fluoronato (FEP) come polimero fluoronato per il trattamento del tessuto e come fase idrofobica nell’inchiostro del MPL, come risultato del dimostrato miglioramento nella gestione dell’acqua rispetto al polimero attualmente più impiegato, il PTFE.
Il segnale elettrico prodotto dalla cella a combustibile assemblata, con MPL vergini a base di CB o GNPs, è stato analizzato attraverso la misurazione delle curve di polarizzazione in diverse condizioni operative di umidità relativa e temperatura. Inoltre, le condizioni operative che hanno garantito i migliori risultati per i due campioni sono state selezionate per test di ripetibilità, in modo tale da valutarne l’affidabilità.
La durabilità dei GDMs è stata determinata per mezzo di stress test accelerati (ASTs) volti a individuare il principale meccanismo di degrado. Un AST chimico è stato realizzato tramite esposizione dei GDMs a una soluzione concentrata di acido solforico per 1000 h e un AST meccanico è stato ottenuto tramite esposizione dei GDMs a flussi elevati di aria in una finta cella, nuovamente per 1000 h. Poi sono state registrate le curve di polarizzazione dei campioni degradati, così da poter valutare gli effetti dei due meccanismi di degrado sulle prestazioni elettriche della cella.
In ogni caso, alla caratterizzazione elettrochimica sono state affiancate microscopia ottica, analisi dell’angolo di contatto statico, porosimetria a intrusione di mercurio e misure di permeabilità, in modo tale da associare la morfologia dei MPLs di diverse composizioni alla prestazione della cella e chiarire gli effetti dei meccanismi di degrado sui campioni.
During the last decades, it has been highlighted more and more the fact that the actual global energetic system, strongly dependent on fossil fuels, is intended to get no longer sustainable, firstly, from an environmental point of view, and secondly, as a matter of global sources depletion. Indeed, the primary key problem coming from the continuous use of fossil hydrocarbons for the production of energy is related to the protracted emission of pollutants and greenhouse gases associated to the combustion of this type of fuels, with demonstrated consequences affecting the environment, such as global warming, climate changes, acid rains and so on.
The second issue is related to the limited amount of natural oil and gas on our planet, a fact that must inevitably deal with the increasing energy demand, due to the rise of the population that gets access to this source.
In this context, it is evident that a nearly immediate solution to alleviate this global dependence is required and it can effectively come from the conversion of the fossil fuels energetic system into a new sustainable one, based on alternative forms of energy. Among all the possibilities, hydrogen turns out to be a valid alternative, first of all, because of the efficiency in energy conversion and the nearly-zero emissions related to its exploitation as fuel. Furthermore, hydrogen is, in principle, one of the most available substances on our planet coming from renewable sources and, even if its extraction can involve in some cases modest expenses in terms of energy, many efforts are being focused on this direction. With the expectation that hydrogen can play a significant role in the global energy economy, governments are committing funds for the implementation of its extraction and, at the same time, of the commercialization of technologies intended to the energy production.
One of the most emerging devices for this application is the fuel cell, an electrochemical energy converter able to generate electrical power from a redox reaction between hydrogen and oxygen gases (in general), without any combustion, releasing water as a by-product. The main advantages concerning this technology are the limited emissions, the high efficiency of energy conversion, low noises and the absence of moving parts. Even if different types of fuel cells have been developed, nowadays the research interest results particularly oriented towards the improvement of proton exchange membrane fuel cells (PEMFCs), which appear to be a valid technology for power generation in the automotive and portable applications, thanks to their lightweight, reduced dimensions, fast response and low working temperature. This device is composed of many parts and its core is the membrane electrode assembly (MEA), a union of a polymeric layer, acting as the electrolyte, and of two catalyst layers, working as electrodes, one at each
when they are organized into stacks. Another important part of this technology is the gas diffusion medium, which is placed between the MEA and the bipolar plates, at each side of the fuel cell assembly, and it is composed of a macroporous substrate, the gas diffusion layer (GDL), coated with a microporous layer (MPL). The main functions of the GDM are related to the homogenization of the reactants distribution and to the principal disadvantage of this technology, which is the management of the water produced by the electrochemical reactions, which requires to be expelled in an optimized and controlled way. The MPL relevance is strictly associated with the water management and it has been demonstrated that its presence helps in the alleviation of such a drawback, leading to remarkable improvements of performances. Because of the crucial importance of the MPL accomplished functions, many efforts in the research and development have been focused on the study of new materials for this component, in order to guarantee an optimal generation of electrical power.
At this point, one of the major issues that can delay the commercialization of PEMFCs is represented by the durability and the lifetime of the single components of the assembly, which determine the reliability of performances in the long-term use. Generally, targets of few thousands or tens of thousands of hours are fixed as references for durability under working conditions of PEMFCs and their parts. Anyway, from a point of view of time consumption, it is more convenient to evaluate durability on a lab scale by carrying out the so-called accelerated stress tests (ASTs). They consist in the exposure of the analysed component of a fuel cell to a specific degradation mechanism under extreme conditions, namely more aggressive than those found in the working device, in order to simulate in a shorter time the related effects on the long-term use. The durability of components such as the MEA and the bipolar plates have been already investigated in many studies, while something more is required to better understand the mechanisms of degradation of GDL and MPL, for which the development of standardized ASTs would be desirable.
In this thesis work the chemical and mechanical durability of two MPL types of different composition were studied and compared, thanks to the evaluation of the effects of ad hoc ASTs on the coatings characteristics and the PEMFC performances. The composition of the two MPL kinds was based on conventional carbon black (CB) and graphene nanoplatelets (GNPs), which have been recently proposed in some studies as an effective alternative to CB in MPLs, due to the development of a more compact coating that seems to enhance PEMFCs properties and durability.
The thesis work is structured into six chapters: a preliminary knowledge of the topic is supplied in the first sections, while the experimental part of the work is described in the last chapters.
In the first chapter, a general definition of a fuel cell and its functioning is given, preceded by a brief description of the historical development of the technology. Then, an overview of the existing types of fuel cells is supplied. Finally, the critical issues regarding the use of hydrogen as a fuel are discussed, followed by the explication of the different methods of production and storage of the source.
thermodynamics and kinetics governing the electrochemical process of the technology is supplied.
In the third chapter, durability issues are introduced and the most common forms of degradation mechanisms affecting PEMFCs components are briefly treated, together with some of the standard characterization techniques which are generally used to analyse their effects on GMDs. Furthermore, a list of some of the most common ASTs and related ageing conditions is given, classifying them according to the degradation mechanisms which involve GDMs.
In the fourth chapter, the experimental procedure of the research is described in detail, with a particular focus on the material and methods exploited. Carbon cloth GDLs were treated in order to enhance their wettability characteristic, by dipping them into an FEP solution. This fluorinated polymer was used instead of conventional PTFE for the tissue treatment, because of its demonstrated enhancement in the water management. Subsequently, the GDL samples were coated with MPLs by the blade coating technique and the obtained GDMs were mounted into the cell assembly of a fuel cell testing station, in order to evaluate the electrochemical performances of the system under different conditions of temperature and RH. The MPL deposition formulations were of two types: one containing CB and carbon nanotubes (CNTs), and one containing GNPs and again CNTs. Both the two inks contained FEP for a matter of hydrophobicity enhancement. The characterization condition that had given the best performing electrical output for each of the two MPL types was selected for multiple characterization analyses under the same operative parameters of temperature and RH, in order to evaluate the reliability of the obtained results. The durability of MPLs was investigated by carrying out chemical and mechanical ASTs on pristine GDM samples: the first kind of test was obtained by dipping GDMs into a sulphuric acid solution for 1000 h, while the second one consisted in exposing the samples, mounted into a dummy cell, to elevated air flow rates, for 1000 h. The electrochemical performances of the cell related to the use of such degraded samples were characterized and the results were analysed taking into account measures of static contact angle, optical microscopy, mercury intrusion porosimetry and water permeability.
The fifth chapter is devoted to the display of the data resulting from the characterization
techniques and to their interpretation. The CB and GNPs samples are separately
treated, and, for each composition type, the polarization curves from the electrochemical characterization are analysed considering the results of the other characterization methods, in order to relate material and structure properties to the obtained performances. In each case, the data of pristine samples are compared to those of stressed GDMs, in order to clarify the effects of the degradation mechanisms. Finally, the CB-and GNPs-based MPLs are compared CB-and, in the sixth chapter, conclusions regarding performances and durability are made.
Introduction to Fuel Cells
1.1
Historical Development of Fuel Cells
Even though fuel cells are considered as an innovative technology, the electrochemical operation they are based on was known since the first part of the XIX century, and the first prototype was developed in the same period [1]. However, the research and development technological efforts for these energy converters have been focused only during the last century, in particular starting from the last three decades, when an energy system based on hydrogen was proposed to solve global problems related to fossil fuels depletion and environmental issues [2].
The first discovery of the electrochemical working principle is attributed to the German-Swiss scientist Christian F. Schönbein, in 1838. A year later, in 1839, the Welsh scientist Sir William R. Grove experienced this principle in the first rudimental fuel cell and obtained electrical energy released by the reaction of hydrogen with oxygen [3][4].
In this experiment Grove placed a series of platinum strips couples as electrodes in electrical contact inside tubes, closed at their upper ends with cement and with the lower extremities immersed in a sulphuric acid solution working as the electrolyte. For each pair, one tube contained oxygen gas and the other one hydrogen gas. Thanks to this equipment, Grove could observe a small current generated by the series of electrodes [5]. Figure 1.1 shows the original Grove’s device and a schematic representation of a single electrodes couple.
However, fuel cells remained only a scientific curiosity for almost a century, during which no improvements or applications were considered and carried out, primarily due to the fact that the traditional energetic system based on oil and coal was considered the unique source for the global demand.
We have to wait until 1932 to see a reinvention of the technology, by the English engineer Francis T. Bacon, who started his work in that year, leading to the development of a 5 kW fuel cell stack in 1952. Bacon modified the original project of Grove by introducing a less corrosive alkaline electrolyte based on a potassium hydroxide solution, and by replacing platinum with nickel in the electrodes.
In the following years, fuel cells started to have a large application in the aerospace field for the U.S. space program. The first practical use was in the early 1960s, when this technology was exploited in the Gemini Program, thanks to the introduction of the
(a) (b)
Figure 1.1: Scheme of: (a) original Grove’s cell for the first fuel cells; (b) a single electrodes couple.
first polymer membrane fuel cell, developed by General Electric, and later in the Apollo Program. Nowadays, they are still used in the U.S. space program, mainly because of their light weight, reduced dimensions and low operative temperatures.
Regarding the automotive field, General Motors worked on a van based on fuel cells already in the mid-1960s, but we have to wait until the 1990s to observe a real boost for vehicles powering. Some of the most important results were in 1993 when the Canadian company Ballard Power Systems demonstrated the first application for buses, and, at the same time, Energy Partners presented its Green Car (Figure 1.2) powered by PEM fuel cells [6].
Starting from these first achievements, many car manufacturers have developed and presented prototypes and models powered by this new technology, moved in particular by the forecast of a future conversion of the energy system into a new hydrogen-based power generation field. This trend has been followed during the last 20 years and nowadays every important car producer has demonstrated and presented at least one prototype vehicle.
Figure 1.2: Energy Partners Green Car, the first PEMFC-powered passenger automobile, 1993.
1.2
What is a Fuel Cell?
A fuel cell is an electrochemical energy converter that directly transforms chemical energy into electrical energy, by means of an electrochemical reaction between a fuel and an oxidant species. Even if the most common and applied reactant gases are hydrogen and oxygen, respectively as fuel and oxidant, other substances can be involved in specific fuel cells configurations.
The driving force at the basis of the working principle of this galvanic cell is the energy released by the spontaneous oxidation-reduction reactions between the reactant gases, which leave water as the only by-product, when hydrogen and oxygen are involved. This no-impact emission of wastes from the reaction is one of the major points concerning the environmental advantages of fuel cells. It must be taken into consideration the fact that the overall electrochemical process exploited in this cell can be seen as the opposite of what happens in the water electrolysis, which is an electrochemical non-spontaneous conversion of externally supplied electricity into chemical energy, in order to force the splitting of water. Figure 1.3 outlines the comparison between these two processes.
Figure 1.3: Processes: (a) electrolysis of water; (b) recombination of hydrogen and oxygen.
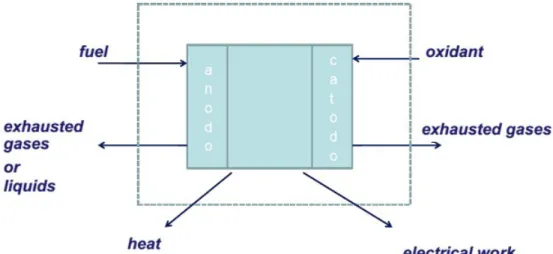
Even if different kinds of fuel cells are present, as a general scheme they are multi-component devices composed of two electrodes, separated by an ionic conductive and electron-insulating electrolyte and an external circuit. One of the main differences among various fuel cell designs is the chemical nature of the electrolyte [7]. Anyway, the overall electrochemical process always involves the reduction of the oxidant species at the cathode, and the oxidation of the fuel at the anode, with the consequent release of electrons that can flow through the external circuit, generating electrical work. From the redox, we have also heat and exhausted substances release, as we can see in the reported scheme in Figure 1.4.
Figure 1.4: Generic scheme of material and energy flows exchanged between a fuel cell and the environment.
and that can operate with different composition of the gas sources, but the most common configurations (including PEMFCs) are based on hydrogen and oxygen feeding. For these situations, the global reaction is the following:
2 H2(g) + O2(g) 2 H2O ( + energy) (1.1)
It should be considered the fact that devices with different electrolytes, even if working with the same chemical sources, can have different half-reactions at the electrodes, depending on the nature of available ions inside the ionic conductor. This issue will be discussed in a more detailed way in Section 1.3.
After having defined the fuel cell and its functioning, some considerations regarding a comparison with the traditional battery should be done. Apparently, these two devices seem very similar because both are composed by the same type of parts (electrodes, electrolyte and external circuit) and generate current by means of an electrochemical reaction. However, some differences are present and the most important one is the fact that a fuel cell is an open system, that exchanges energy, in form of electricity and waste heat, and matter, in form of gas sources and by-products, with the environment; the battery is a closed system that is involved only in energy transmissions with its surroundings. A scheme highlighting the different kinds of thermodynamic systems with their exchange flows with the environment is represented in Figure 1.5.
Starting from the previous thermodynamic definition, it is evident that a fuel cell requires a continuous supply of reactants, while the battery already contains all the necessary to produce energy inside the system, with electrodes that are involved in chemical changes and depleted, unlike fuel cells. It follows that, in principle, batteries are discharged by their running, while fuel cells cannot be discharged if continuously fed by external gases. Another difference is related to the output flows of the two devices and, in particular, a fuel cell is characterized by the release of waste material into the environment; both of the devices produce waste heat, but in the case of the battery the rate of generation is much lower.
In Section 2.3.4 a comparison with the traditional thermal engine will be presented, in the light of a discussion about the thermodynamics of fuel cells.
Figure 1.5: Classification of thermodynamics systems.
1.3
Classification of Fuel Cells
Many types of fuel cells have been tested from the first Grove’s prototype and the research and development efforts have been focused to solve two of the main technological drawbacks, namely the slow reaction rate and the availability of hydrogen. Nowadays different categories of devices (see Figure 1.6) are present and they can be classified according to the nature of the electrolyte and to the range of operating temperature.
The first division is based on the ionic species involved in the charge carriage through the ionic conductor and thus on the electrolyte composition. The following types can be identified:
• polymer electrolyte (or proton exchange) membrane fuel cells (PEMFCs) and direct methanol fuel cells (DMFCs);
• alkaline fuel cells (AFCs);
• phosphoric acid fuel cells (PAFCs); • molten carbonate fuel cells (MCFCs); • solid oxide fuel cells (SOFCs).
It must be specified the fact that PEMFCs and DMFCs should be classified as the same kind of technology if the categorization based on the electrolyte is considered, because both exploit a polymeric conductor. The only difference between them remains the fuel composition (hydrogen in the first case, methanol in the second one).
The second division is based on the fuel processing temperature, and the following groupings are considered:
• low temperature fuel cells, which work at temperatures near or below 200◦C
(PEMFCs, DMFCs, AFCs and PAFCs);
• high temperature fuel cells, which work at temperatures above 600◦C (MCFCs and
SOFCs).
Figure 1.6: Scheme of the reactants, the by-products and the charge carriers for the different types of fuel cells.
1.3.1
Low Temperature Fuel Cells
1.3.1.1 Polymer Electrolyte Membrane Fuel Cell (PEMFC)
This model, firstly developed by General Electric in the 1960s, was exploited in the Gemini space program for the first manned space vehicles and, nowadays, it is still
the preferred option for NASA [8]. Moreover, thanks to their light weight,
low-temperature operation, rapid start-up and cost they find possible applications in small-scale distributed stationary or portable power generation and in the automotive.
The core of the technology is the so-called membrane electrode assembly (MEA), placed between two bipolar plates that collect charges and distribute reactant gases, as shown in Figure 1.7. The MEA is composed of a gas diffusion medium, a polymeric membrane and a catalyst dispersed onto its surface. The single components of PEMFCs will be described in more details in Section 2.1.
Figure 1.7: Schematic cross-section of a typical PEM fuel cell.
The device is fed by hydrogen and oxygen, and the involved electrochemical process is schematized in Figure 1.7 [9].
At the anode, hydrogen molecules are oxidized, releasing electrons, according to the following reaction:
H2(g) 2 H++ 2 e– (1.2)
At the cathode, oxygen reacts with protons travelling through the membrane and with the electrons circulating across the external circuit, according to the reaction:
1
2O2(g) + 2 H
++ 2 e– H
2O(l) (1.3)
The redox reaction is guaranteed by the membrane, which acts as the electrolyte by
carrying protons (in form of H+ ions) from the anode to the cathode, and blocks
electrons and reactants passage. The proton conductive membrane is generally rather
thin (< 50 µm) and the most common material selected for this component is Nafion,
a perfluorosulfonic polymer developed in 1967 by DuPont that shows a good specific conductivity and lifetime.
The catalyst responsible for the reaction initiation and working as the electrode is
generally platinum, supported on carbon particles with loadings of about 0.3 mg cm−2.
Sometimes Pt-Ru alloys are exploited, when the hydrogen source contains traces of CO. The operating temperature is reduced (60-80◦C), and this is one of the advantages of this technology. In principle the device could work in a rather wider range of temperatures
(50-120◦C), but it must be taken into account the fact that too low temperatures would
give reduced efficiency, while too high temperatures would decrease the conductivity of the membrane, which depends on its hydration degree, because of water evaporation.
1.3.1.2 Direct Methanol Fuel Cell (DMFC)
As introduced previously, this kind of fuel cell is similar to the PEMFC but with methanol instead of hydrogen as fuel. This model was introduced in order to face one of the main drawbacks related to PEMFCs, namely the availability of hydrogen gas, in particular for portable devices applications [10]. This issue is discussed in Section 1.4, where problems regarding H2production and availability are treated.
Also in this case it is present a polymeric membrane, again Nafion in most of the cases,
as ionic conductor, responsible for the carriage of H+ ions released at the anode, where
methanol is reformed into CO2, according to the reaction:
CH3OH + H2O CO2+ 6 H+ + 6 e– (1.4)
At the cathode steam or water is formed from oxygen, by means of the following reaction: 3
2O2+ 6 H
+ + 6 e– 3 H
2O (1.5)
A schematic representation of the cell is illustrated in Figure 1.8
Figure 1.8: Schematic representation of a direct methanol fuel cell (DMFC).
Methanol feed can be in form of vapour or liquid phase and, in the first case,
performances are higher in terms of cell voltage and power density. Anyway, the
second technology is preferred because a high temperature is not required for methanol vaporization, and this is the reason why a PEMFC apparatus, operating at reduced temperatures, is exploited with this kind of fuel. Moreover, the main advantage comes from the easier possibility to produce and store the fuel in a liquid form, so that one of the limiting drawbacks of the hydrogen gas based technology can be overcome, with consequent benefits in particular for portable applications.
Among all the alternative fuels that can be selected instead of hydrogen, methanol shows a rather high energy density, similar to that one of gasoline, low cost and good availability.
reaction speed at the anode, compared to that one of the hydrogen case, and the permeability of the membrane to methanol in presence of reaction water that leads to reactant passage towards the cathode, a phenomenon called fuel crossover. These two problems are the primary factors limiting DMFCs performances.
1.3.1.3 Alkaline Fuel Cell (AFC)
Alkaline fuel cells were firstly demonstrated by Francis T. Bacon in the 1950s and have been used in NASA space program since the 1960s to supply drinking water and electricity (for example during the Apollo mission), even if they are losing importance in this field, being progressively replaced by PEMFCs [11]. Other current applications are in submarines, boats, forklift trucks and niche transportations.
The electrolyte is a hydroxide aqueous solution, commonly KOH, retained in a matrix,
usually made of asbestos, and it can be exploited at low temperatures (< 120◦C) if
present at reduced concentrations (35-50 wt%), while it operates at high temperatures (> 250◦C) when concentrated (85 wt%). Figure 1.9 illustrates the functioning scheme of the cell.
Figure 1.9: Schematic representation of a alkaline fuel cell (AFC).
In this case, the electrolyte is involved in OH– ions transport, so that they can be
combined with H2at the anode giving the following oxidation:
2 H2+ 4 OH– 4 H2O + 4 e– (1.6)
At the cathode, electrons released by the previous reaction and travelling through the external circuit are responsible for the production of OH–ions, which can flow across the solution and towards the anode. The reduction reaction is the following:
O2+ 2 H2O + 4 e– 4 OH– (1.7)
The electrocatalyst for the reaction can be of many types, such as Ni, Ag, metal oxides and noble metals. In modern electrodes, catalyst is generally carbon-supported onto a conductive Ni mesh.
Alkaline fuel cells show some advantages, first of all the reduced cost of production determined by the use of relatively cheap electrolyte, catalyst and electrodes materials and by a simple structure which does not contemplate the presence of bipolar plates. Furthermore, the faster reduction kinetics of oxygen in an alkaline system, with respect to the case of an acid medium, allows a restraint in the catalyst amount, with a further decrease in the production costs. One other advantage is the fact that water management issue is less severe than in the PEMFC case, where the hydration degree of the electrolyte is strongly required for conductivity.
Nevertheless, some drawbacks limiting the technology are present and the most relevant is related to the poisoning of the electrolyte by the action of CO2coming from either fuel or oxidant. The reaction of the process is the following:
2 KOH + CO2 K2CO3+ H2O (1.8)
The conversion of the potassium hydroxide into its carbonate determines a depletion in
the OH– ions concentration, reducing strongly the ionic conductivity and consequently
the cell performances. One possible solution is an air purification mechanism, such as a
CO2scrubber in the air supply system of the cathode. Anyway, not all the gas impurities
can be completely removed and the electrolyte should be replaced and renewed at a given point, otherwise the cell should become useless.
Of course there are same safety issues regarding the presence of an asbestos matrix and its hazardous action on health, that imply the necessity to develop a new alternative material for public commercialization.
1.3.1.4 Phosphoric Acid Fuel Cell (PAFC)
In the 1970s this fuel cell was introduced by the American company United Technologies for terrestrial power plants in order to face the major problem concerning AFCs, namely the electrolyte sensibility to CO2. In PAFCs the ionic conductivity is given by phosphoric acid, which shows good chemical and thermal stability [12], with a consequent tolerance
to CO2 in the air, also at rather high temperatures. Nowadays this technology finds
application for stationary electrical generation and many plants all over the world exploit this fuel cell model (for example hospitals, military bases, leisure centres, offices, factories, and even prisons).
The structure of a PAFC is similar to that one of a PEMFC:
• in both the two cases the electrolyte is of acidic nature and conducts protons in form of H+ions. The phosphoric acid is used with a concentration around 100 % and it is retained inside a porous matrix of SiC that should have an optimized thickness (0.1-0.2 mm) in order to balance the effects of ohmic losses reduction and reactant gases crossover prevention. Moreover a higher thickness means also a higher mechanical stability;
• the reactions taking place at the anode and the cathode are the same in the two cell types;
• also in this case gas diffusion electrodes are present, with a structure very similar to that one of the PEMFCs and with catalyst again composed of Pt or Pt alloy particles, supported on carbon black powders. A carbon cloth impregnated with PTFE acting as gas diffusion medium and charges collector is present;
• both the two devices exploit bipolar plates. Figure 1.10 shows the fuel cell scheme.
Figure 1.10: Schematic representation of a phosphoric acid fuel cell (PAFC)
PAFCs generally operate at a temperature range higher than that one of the previously
described fuel cells (100-250◦C, so that sometimes they are ascribed as medium
temperature fuel cells. This level of working temperature is required in order to reach a good ionic conductivity through phosphoric acid and it is allowed by the low volatility of the electrolyte, as well as by the absence of water.
Some advantages of this kind of device can be listed and one has been already mentioned,
that is the phosphoric acid resistance to CO2. Furthermore, the high temperatures
exploited allow a higher tolerance to CO traces that can be present in particular in reformed fuels and that can poison electrodes activity: the larger temperature with respect to PEMFCs ensures a reduced absorption of this gas on catalyst. Finally, the heat and water produced by the fuel cell reaction can be exploited for water heating and steam generation in the so-called combined heat and power (CHP) systems, that in this case can reach an efficiency of about 85 % in energy conversion.
The principal disadvantage of a PAFC is related to the solid state of the electrolyte
at temperatures below 42◦C. Operative conditions involving a passage through this
temperature, such as start-up and shut-down of the system, can lead to the development of deleterious thermomechanical stresses, induced by phosphoric acid freezing and thawing. Another drawback comes from the fact that some electrolyte, even if it is
characterized by a low volatility, could be lost during long fuel cell operations, because of the high temperatures reached. This problem implies the necessity to refill the amount of the acid when the devices work for too long periods.
1.3.2
High Temperature Fuel Cells
1.3.2.1 Molten Carbonate Fuel Cell (MCFC)
This technology was already known before the 1970s, years that were involved in a fundamental transition from the early materials for the electrodes (generally precious metals) to the new generation compositions, based on oxides at the cathode and nickel alloys at the anode [13]. Since the mid-1970s, the materials for this fuel cell have remained practically unchanged.
Nowadays this technology is actively developed in America, Asia and Europe and it is currently used for stationary cogeneration power plants in electric utility and for military and industrial applications. Among the main European MCFC developers, also an Italian company can be cited, Ansaldo Fuel Cells SpA.
MCFCs exploit a liquid electrolyte composed of a molten mixture of alkali metal
carbonates, which is retained in a ceramic matrix of γ LiAlO2, showing a structure
similar to that one of the PAFCs and AFCs. The molten bath is generally a binary mixture of Li and K (or Li and Na) carbonates and the high operating temperatures
(600-800◦C) of the cell are required to get liquid and highly conductive molten salts,
containing CO32– ions for the ionic conduction.
The anode in contact with the electrolyte is made of a porous sintered NiCr/Ni-Al alloy, with the Cr addition (generally 10-20 %) responsible for the reduction of Ni sintering tendency and with Al introduced to enhance creep resistance at the working temperatures. The cathode is a porous structure of nickel oxide that can give some problems because of a partial solubility in the electrolyte. It must be highlighted the fact that the electrodes do not require the presence of noble metal catalysts, thanks to the high working temperature of the device that ensures quick electrochemical reactions and lower activation voltage losses.
Again, in this kind of fuel cell bipolar plates are present and they are generally made of stainless steel, with the side exposed to anode covered with Ni, in order to give resistance against the strong reducing environment.
The MCFC electrochemical process involves, as usually, the reaction between oxygen
and hydrogen gases but, differently from the other fuel cell kinds, also CO2is supplied
to the cathode, in order to have a continuous generation of CO32– ions for the electrolytic
conduction. Once they reach the anode, they are converted back to CO2 gas, which can
be collected and recycled for the cathode feeding after proper treatments of the exhaust gas, for example by combustion inside a burner. The overall traditional reaction with the net transfer of CO2is the following:
H2+ 1
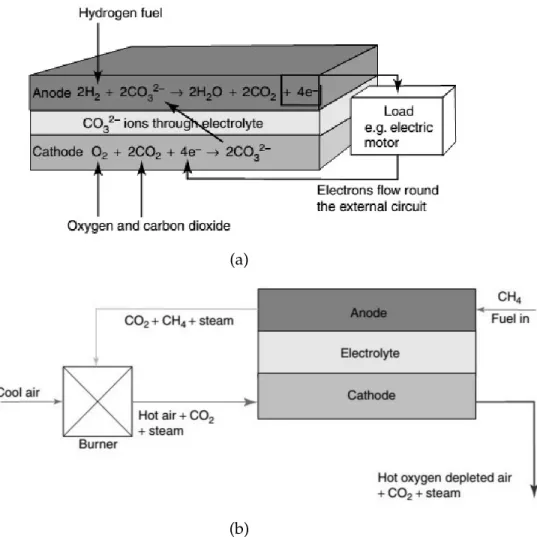
The elevated working temperatures of this fuel cell are responsible for two of the main advantages of this technology: first of all the possibility to exploit directly methane as fuel source, thanks to the so called internal reforming that will be explained in Section 1.4.1.1.1. Furthermore, also CO coming from air or reforming reaction can be used as fuel instead of H2. It should be considered the fact that this last alternative is permitted by
the absence of Pt as catalyst, which would be poisoned by the CO presence. A schematic representation of the MCFC is shown here in Figures 1.11a and 1.11b:
(a)
(b)
Figure 1.11: Schematic representation of: (a) a molten carbonates fuel cell (MCFC); (b) a plant combining an MCFC and a fuel-product recycling system.
In detail, at the anode there are the preliminary reforming reactions involving CH4and
CO (if this last one compound is present):
(Reform1) CH4+ H2O CO + 3 H2 (1.10)
(Reform2) CO + H2O CO2+ H2 (1.11)
oxidation reactions are present at the anode, starting from reformed/fed H2or CO:
(Oxidation1) H2+ CO32– H2O + CO2+ 2 e– (1.12)
(Oxidation2) CO + CO32– 2 CO2+ 2 e– (1.13)
At the cathode there is the production of CO32–ions, by means of the following reduction:
1
2O2+ CO2+ 2 e
– CO2–
3 (1.14)
All the benefits of this technology come from the already explained issues related to the high temperature and to the absence of Pt as catalyst. In addition, the waste heat and water production allow the cogeneration of energy, with higher efficiencies.
Unfortunately, the elevated temperatures impose severe demands on the corrosion resistance and lifetime of cell components, in particular in presence of such aggressive electrolyte. For example, the NiO based cathode shows some solubility into the molten
bath in presence of CO2, giving Ni2+ ions that migrate towards the anode, where they
are reduced to metallic Ni. The reaction is the following:
NiO + CO2 Ni2++ CO32– (1.15)
This condition generates internal short-circuit losses of power, so that new alternative materials with lower solubility have been investigated, such as LiCoO2or LiFeO2.
1.3.2.2 Solid Oxide Fuel Cell (SOFC)
In this kind of fuel cell the electrochemical process is based on the conduction of O2–
ions through zirconia (ZrO2) and thus one of the first developments of this technology
can be attributed to Nernst, who described the ionic conductivity of this solid state medium in the 1899 [14]. A relevant improvement in the history of this device was reached in the 1970s, during which the US Westinghouse Electric Corporation (now Siemens Westinghouse Power Corporation) studied and presented a particular model of the SOFC, with a tubular configuration. Nowadays, even if it has been interested in some changes, the SWPC design remains the most advanced among the tubular types. In parallel, a planar configuration has been developed and, although its improvement has been abandoned by many organizations, some companies are still working on this design.
SOFCs could find application in power generation and co-generation systems and moreover smaller units are being developed for portable power and auxiliary power in the automotive (for example by BMW). Unfortunately, this technology is still in the pre-commercial/demonstration stage, because of its high production cost and operating temperature [15].
This device is the simplest in concept among all the fuel cell types, since it is a completely solid-state device that involves only two phases in the overall process: gas phase (fuel, oxidant and waste steam) and solid phase (cell components). The electrolyte is commonly
yttria-stabilized zirconia (YSZ), with 8-10 mol% of yttria, which shows high stability in both the reducing and oxidising environments in correspondence of the anode and the cathode and a relevant O2–conduction starting from 800◦C, with a conductivity similar to that one of the other liquid electrolytes (0.02 S cm−1at 800◦C and 0.1 S cm−1 at 1000◦C). The anode material is usually a cermet composed of nickel particles inside a YSZ skeleton, with a porosity of 20-40 % which enables mass transport flow of gases. The selected metal is characterized by a high electronic conductivity, stability under reducing conditions and catalytic action for internal reforming. The YSZ avoids Ni particles sintering at high temperature and differential thermal expansions between the anode and the electrolyte, due to their similar coefficient of thermal expansion.
The state-of-art SOFC cathode can be made of electronically conducting oxides or mixed electronically conducting and ion-conducting ceramics and the most common material belonging to the second category is strontium-doped lanthanum manganite
(La0,84Sr0,16)MnO3, a p-type semiconductor with perovskite structure. LaMnO3 is an
intrinsic p-type semiconductor and the electronic conductivity can be enhanced by doping with Sr2+, which is selected as dopant cation due to the small ionic size mismatch between Sr2+and La3+. The mixed conductivity is preferred in order to increase both the transfer of O2–anions to the electrolyte and the circulation of electrons coming from the external circuit. It must be added the fact that the structure of the cathode must be porous, for the same reasons of the anode case.
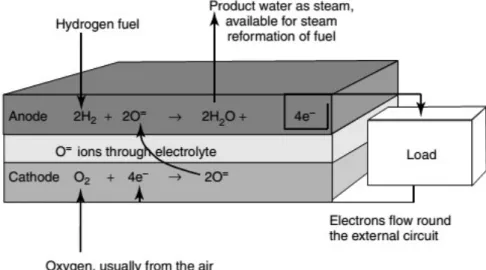
Figure 1.12 represents a scheme of the SOFC and of its functioning.
Figure 1.12: Schematic representation of a solid oxide fuel cell (SOFC). At the anode the oxidation is present, according to the reaction:
O2–(s) + H2(g) H2O(g) + 2 e– (1.16)
The reduction reaction involved at the cathode is the following: 1
2O2(g) + 2 e
Similarly to MCFCs, also in this case there is the possibility to exploit an internal
reforming with CH4 feeding and CO as fuel, thanks to the elevated temperature inside
the cell and the consequent absence of Pt catalyst. The anodic reaction in the SOFC with CO fuelling will be:
O2–(s) + CO(g) CO2(g) + 2 e– (1.18)
In this situation the CO2 produced is not useful and so the fuel cell system is simplified
by the absence of a recycling mechanism, differently from an MCFC.
Considering in general SOFCs, the advantages and disadvantages are all those already mentioned for MCFCs, related to the high temperature of the process. It must be taken into account the fact that, in this case, the temperature range reached is higher and so the criticality of some issues gets heavier, in particular the material selection for a suitable durability of components. Many efforts are being focused on the transition towards lower temperatures, first of all by studying new solid-state electrolytes which
can ensure suitable conductivity at less extreme operating conditions, such as Sc2O3
doped ZrO2 (ScSZ), which at 850◦C can show a 1.5 times higher performance in terms
of ionic conduction with respect to YSZ.
As mentioned before, two device configurations have been developed and they strongly affect the interconnection mode to give fuel cells stacks, exploited in order to increase in an additive way the generated power.
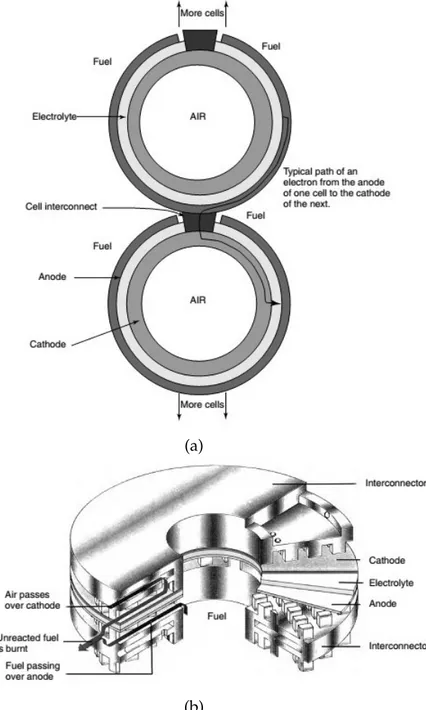
The first design is the tubular SOFC and the most famous structure is produced by Siemens Westinghouse. It consists of a coaxial disposition of cylindrical hollow elements that, starting from the centre, follow the order: air electrode (cathode), electrolyte, fuel electrode (anode). At the origin the structure was fabricated on a zirconia support tube that has been recently eliminated, with a consequent reduction of production
costs and the actual device is called air-electrode-support (AES) cell. The stacking
mode of this type of SOFCs is represented in Figure 1.13b, where it is shown the cell
interconnect, generally made of lanthanum chromite (LaCrO3) doped with Mg, which
features a good electrical conductivity and a suitable coefficient of thermal expansion. The main disadvantages of this technology are the fabrication costs, gravely enhanced by the expensive electrochemical vapour deposition technique for the electrolyte and the electrodes, and the low power density, coming from the long path for produced electrons and the presence of large voids within the stack.
The other design is the so-called planar SOFC, with a configuration similar to that one of PEMFCs and PAFCs, where fuel cell stacking is built up by interposing bipolar plates between two subsequent planar fuel cells, with the role of charge collectors, heat exchangers and gas dispensers. One of the most common stacking configurations is the ring-type arrangement, developed by Sulzer Hexis and shown in Figure 1.13b: it consists of a series of circular SOFCs stacked one on the top of the other so that a cylindrical disposition is obtained. The presence of bipolar plates decreases the electronic path and the ohmic losses, leading to a greater power density with respect to the tubular design. Anyway, one of the major challenges to be faced for this stacking is related to the differential thermal expansion between different components.
and performance parameters, together with some advantages and applications, is finally summarized in Table 1.1.
(a)
(b)
Figure 1.13: (a) End view of tubular type SOFC by Siemens Westinghouse. (b) Ring-type SOFC with metal cell interconnects by Sulzer Hexis Ltd.
T able 1.1: Comparison of technical characteristics of fuel cell technologies. Fuel cell Operating System Electrical CHP Applications Adv antages T ype T emperatur e [°C] Output [kW] Ef ficiency [%] Ef ficiency AFC 90-100 10-100 60 > 80 Militar y, Space Cathode reaction faster in alkaline electr olyte, leads to higher perfor mance PCFC 150-200 50-1000 > 40 > 85 Distributed Generation Higher o v erall ef ficiency with CHP Incr eased tolerance to impurities in hy dr ogen SOFC 600-1000 < 1-3000 35-43 < 90 A uxiliar y po w er Can use a v ariety of catalysts Electric utility High ef ficiency Lar ge distributed generation Fuel flexibilty S olid electr olyte reduces electr olyte management pr oblems Suitable for CHP Hybrid/GT v ehicles MCFC 600-700 < 1-1000 45-47 > 80 Electric utility High ef ficiency Lar ge distributed generation Fuel flexibility Can use a v ariety of catalysts Suitable for CHP PEMFC 50-100 < 1-250 53-58 70-90 Backup po w er S olid electr olyte reduces corr osion and Portable po w er electr olyte management pr oblems Small distributed generation Lo w temperatur e Specialty v ehicles Quick start-up T ransportation DMFC 60-200 0.001-100 40 80 Replace batteries in mobiles, No need for fuel refor mer computers and other de vices
1.4
Hydrogen
As already said in the previous chapters, PEMFCs exploit hydrogen as fuel. Among the different fuels available for energy production, hydrogen offers a series of advantages that makes it ideally game-changing in terms of reduction of air pollution and global warming. Indeed, hydrogen has the highest energy content per unit of mass of any fuel (HHV = 142 MJ kg−1[16]), which can be used with a high efficiency and zero or near-zero emissions at the point of use.
Some chemical-physical properties of molecular hydrogen must be considered. Its higher heating value per unit of volume is the lowest between fuels, due to its extremely low density, as we can see in Table 1.2.
Table 1.2: Higher and Lower Heating Values of different fuels.
Fuel Density HHV LHV [kg m−3] [MJ kg−1] [MJ m−3] [MJ kg−1] [MJ m−3] Gases at 173K, 1bar Hydrogen 0.090 141.7 12.7 120.0 10.8 Acetylene 1.097 49.9 54.7 Methane 0.716 55.5 39.8 50.0 35.8 Natural gas 0.777 52.2 40.6 47.1 36.6 [kg L−1] [MJ kg−1] [MJ L−1] [MJ kg−1] [MJ L−1] Liquids at 288K, 1bar Diesel 0.846 45.6 38.6 42.6 36.0 Gasoline 0.737 46.4 34.2 43.5 32.0 LNG 0.428 55.2 23.6 48.6 20.8 [MJ kg−1] [MJ kg−1] Solids at 288K, 1bar Carbon 32.8 Charcoal 39.6 28.4 Coke 26.0
In addition, H2 has high diffusion coefficient (D = 0.61 cm2s−1) and buoyancy that
promotes a rapid dilution in other gases or mixtures and represents a great safety asset: possible leakages would disperse quickly in air, preventing accumulation of excessive amounts of this gas in small volumes [17][18]. This is fundamental since hydrogen is much more flammable than other fuels (flammable in 4-75 % concentrations in air) and it is detonable over a wide range of concentrations when confined, due to its low ignition energy of 0.02 mJ (0.24 mJ for gasoline and 0.28 mJ for methane).
Not just safety concerns due to extreme flammability are currently hindering the usage of hydrogen on a large scale. For instance, there are not natural sources of molecular hydrogen (H2). Hydrogen is mainly stored in its oxidized form (H2O) on Earth surface or
combined with carbon in organic compounds. Different methods are currently adopted to extract it, but still the volume of the overall production is reduced in comparison to other chemicals. The other main challenge involves storing it. Storing it at the gas state implies facing large volumes and high pressures, in addition to the problem of
leakages due to large diffusivity; alternatively, liquid or solid phases can be stored, but these features different energy contents and overall properties. Finally, the overall costs of production-distribution-storing are way higher than traditional sources as fossil fuels [19].
Table 1.3: Estimated costs of hydrogen production, transportation and distribution [$/kg]
Primary energy source Production Transportation Distribution Total
Natural gas reformin 1,03 0,42 0,54 1,99
Coal gasification 0,96 0,42 0,54 1,91
Wind electrolysis 6,64 0,42 0,54 7,60
Biomass gasification 4,63 1,80 0,62 7,04
Gasoline (for reference) $0,93/gal. $0,19/gal. $1,12/gal.
Note: Energy content of 1kg of hydrogen approximately equals that of 1gal. of gasoline.
1.4.1
Production
Nowadays, hydrogen is an industrial gas exploited in different fields such as hydrocracking, desulphurization, ammonia synthesis and fertilizer production, in addition to fuelling PEMFCs and other systems. The generation market is expected to be valued at 115.25 billion USD in 2017, with a continuous growth in the next decade. Many sources are suitable for hydrogen extraction [20] as can be seen in Figure 1.14, but the main processes are fuel processing, water electrolysis and production from biomasses.
1.4.1.1 Fuel Processing
Hydrogen can be produced from different fossil fuels. These types of feedstock are the most widely used due to their large availability, low costs and reduced energy consumption for extraction. However, long-term projections predict a strong shift of the production toward electrolysis and biomasses due to two main issues of fossil fuels.
The first is the emission of CO or CO2 as by-products of the reactions: CCS techniques
must be applied to achieve the “zero-emission” goal. The second is the limited amount of feedstock at our disposable, which distinguish these fuels from typical renewables (solar, wind, hydro) which have ideally no limit.
1.4.1.1.1 Steam Methane Reforming
The steam methane reforming (SMR) is the most important process, accounting for more than the 40 % of the overall production [21]. The main stages of the process are:
• Feedstock desulfurization, to avoid the poisoning effect of sulphur-organic compounds on the reforming, in a desulfurization unit (DSU). The compounds
Figure 1.14: Map of the possible hydrogen production’s strategies.
are first converted in H2S, then scrubbed by a ZnO bed at 340-390◦C according to the reaction:
H2S + ZnO ZnS + H2O (1.19)
• Feeding of preheated CH4 to a catalytic reforming reactor where it reacts with
steam to produce a syn-gas, according to the reaction:
CH4+ H2O CO + 3 H2 ∆H0 + 206.28 kJ mol–1 (1.20)
The steam methane reactor (SMR) features externally heated tubes filled with Ni
catalyst, operating at T = 850◦C and P = 35 bar. Part of the heat produced by the
furnace surrounding the unit is recovered for steam production and preheat duties. • The gas mixture of H2, CO and steam is cooled to 350◦C and fed to water-gas shift
reactors (WGS), where the following mildly exothermic reaction occurs: