Abstract
Purpose. The aim of our study was to assess the regional cerebral blood flow (rCBF) of basal ganglia and thalami in patients with Parkinson’s disease (PD) using perfusion-weighted magnetic resonance imaging (PW-MRI).
Material and methods. Twenty subjects affected by idiopathic PD according to the United Kingdom Brain Bank criteria were enrolled in the study. Twenty normal subjects matched for age and gender were included as controls. After 20-day therapy
withdrawal, the PD patients underwent PW-MRI. The rCBF was calculated both in patients and in controls. The regions of interest were manually positioned on rCBF maps over the caudate nucleus, the putamen, the external and internal globus pallidus, and over the ventrolateral nucleus of the thalamus. Data were normalised with those obtained from parieto-occipital white matter (POWM). Statistical analysis was performed using a parametric ANOVA test.
Results. Patients showed a significant (p<0.01) interhemispheric asymmetry; rCBF values were higher on the more severely affected side. Controls showed no interhemispheric asymmetry. Conclusion. Our study suggests that PW-MRI is a valuable tool for assessing haemodynamic changes in PD patients.
Haemodynamic change pattern may be useful in the early diagnosis of PD.
Key words Parkinson’s disease •Perfusion-weighted magnetic resonance imaging •Basal ganglia
Riassunto
Obiettivo. Lo scopo del nostro studio è stato quello di valutare il flusso ematico cerebrale (rCBF) a livello dei gangli della base e dei talami nei soggetti affetti da morbo di Parkinson (MdP) mediante risonanza magnetica perfusionale (pRM).
Materiali e metodi. Sono stati studiati 20 soggetti affetti da MdP idiopatico secondo i criteri della Brain Bank. Sono stati inoltre studiati 20 soggetti-controllo per età e sesso. I pazienti con MdP hanno effettuato la pRM dopo 20 giorni di wash out terapeutico. Il rCBF è stato calcolato sia nei pazienti affetti da MdP che nei controlli. Sono state posizionate manualmente delle regioni di interesse (ROI) sulle mappe di rCBF a livello del caudato, putamen, pallido interno/esterno e a livello del nucleo ventro-laterale del talamo. I dati ottenuti sono stati normalizzati con quelli ottenuti a livello della sostanza bianca parieto-occipitale (WPOM). L’analisi statistica è stata effettuate mediante test ANOVA di tipo parametrico.
Risultati. I pazienti con MdP hanno mostrato una significativa asimmetria interemisferica (p<0,01). I valori di rCBF sono risultati più alti nel lato maggiormente affetto dalla patologia. I controlli non hanno mostrato nessuna asimmetria perfusionale interemisferica.
Conclusioni. Il nostro studio propone la pRM come valida metodica nella valutazione di modificazioni emodinamiche nei soggetti affetti da MdP. Tali modificazioni emodinamiche potrebbero essere utili nella diagnosi precoce del MDP. Parole chiave Malattia di Parkinson •Risonanza magnetica perfusionale •Gangli della base
NEURORADIOLOGY
NEURORADIOLOGIA
DOI 10.1007/s11547-006-0028-1
Evaluation of basal ganglia haemodynamic changes with perfusion-weighted
magnetic resonance imaging in patients with Parkinson’s disease
Valutazione delle modificazioni emodinamiche a livello dei gangli della base
me-diante risonanza magnetica perfusionale nei soggetti affetti da morbo di Parkinson
F. Gaudiello
1•F.G. Garaci
1•S. Marziali
1•A. Ludovici
1•L. Brusa
2•P. Stanzione
2•R. Floris
1G. Simonetti
11Dipartimento di Diagnostica per Immagini e Radiologia Interventistica, Università degli studi di Roma Tor Vergata, Viale Oxford 81,
I-00133 Roma, Italy
2Dipartimento di Neuroscienze, Università degli Studi di Roma Tor Vergata, Roma, Italy
Correspondence to: F. Gaudiello, Tel.: +39-06-20902401, Fax: +39-06-20902404, e-mail: [email protected] Received: 21 February 2005 / Accepted: 18 October 2005 / Published online: 3 March 2006
Introduction
Parkinson’s disease (PD) is a neurodegenerative disease marked by a degeneration of the dopaminergic neurons in the pars compacta of the substantia nigra (SN) [1] and of other brainstem pigments, as well as by the appearance of cell inclusions known as “Lewy’s bodies” in the degenerat-ing neurons.
Diagnosis of PD is currently a clinical diagnosis only based on history, disease course, and finding of at least two of the three basic symptoms of the disease, i.e. rigidity, hy-po-bradykinesia, and resting tremor, with typical asymmetry between the two sides of the body in terms of time of onset and symptom intensity. Furthermore, response to dopamin-ergic drugs over time is extremely important for diagnostic purposes. On the other hand, in the early stages of disease, it is impossible to arrive at a firm differential diagnosis be-tween idiopathic PD and atypical vascular or degenerative Parkinsonisms on the sole basis of clinical data and initial re-sponse to treatment. Indeed, early PD, when symptoms are extremely mild and blurred, may show only a subtle, if any, response to dopaminergic therapy, just as subjects with atyp-ical Parkinsonism may exhibit a limited response to therapy, which can persist for 1–2 years. Diagnosis based only of such criteria was found to be incorrect in 25% of cases sub-jected to post-mortem histological examination at the United Kingdom Brain Bank in London [2]. Interest in such a dif-ferential diagnosis lies mainly in the different course of these diseases and in the significant difference in how they re-spond to treatment.
The neuroimaging techniques that have been used in the differential diagnosis mainly rely on nuclear medicine meth-ods, such as single proton emission computed tomography (SPECT) and positron emission tomography (PET) [3–8]. Although these methods are extremely sensitive in the early detection of depleted nigrostriatal nerve endings and useful in the follow-up [9–11], their limited availability (in particu-lar in the case of PET), high costs, limited supply of tracers, and poor spatial resolution make them unsuitable as a routine aid in the early diagnosis of PD.
For instance, PET is unable to distinguish, within the basal nuclei, the putamen from the globus pallidus and even less the lateral from the medial pallidus. Many PET studies of PD have, in fact, analysed changes in receptor density, dopaminergic fibres, or metabolic changes in the “lenticular nucleus”. This anatomical entity corresponds in humans to the putamen and external and internal globus pallidus taken as a whole. Current theories on the pathogenesis of PD as-sign often diametrically opposed functions to these struc-tures.
An examination comprising them without differentiation [12, 13] carries a risk of underestimating those alterations. The reduced metabolism of the external pallidus should cor-respond to increased activity of the internal pallidus without affecting total activity [14].
The purpose of this study was to use perfusion-weighted magnetic resonance imaging (PW-MRI) as a diagnostic method to identify a specific perfusion pattern in the basal ganglia of PD subjects.
Introduzione
Il morbo di Parkinson (MdP) è una patologia neurodegene-rativa caratterizzata da una preferenziale degenerazione dei neuroni dopaminergici a livello della pars compacta della sostanza nigra (SN) [1] e di altri pigmenti tronco-encefalici, nonché dalla comparsa, nei neuroni coinvolti nel processo degenerativo, di inclusioni citoplasmatiche note come “cor-pi di Levy”.
La diagnosi di morbo di Parkinson è attualmente una dia-gnosi clinica basata solo sulla anamnesi, sul decorso della malattia e sul riscontro obiettivo di almeno due dei tre sinto-mi cardine della patologia, vale a dire della rigidità, di una ipo-bradicinesia e del tremore a riposo con caratteristica asimmetria tra i lati corporei in termini di epoca di compar-sa ed intensità dei sintomi; inoltre è di estrema rilevanza, sempre ai fini diagnostici, la risposta ai farmaci dopaminer-gici nel tempo. D’altro canto, in fase iniziale è del tutto im-possibile arrivare a porre una diagnosi differenziale certa tra il morbo di Parkinson idiopatico ed i parkinsonismi ati-pici su base vascolare o degenerativa, sulla sola base dei da-ti clinici e della risposta farmacologica iniziale; infatda-ti, nei pazienti con Parkinson iniziale (early PD) il cui quadro cli-nico sia quindi estremamente lieve e sfumato, la risposta al-la terapia dopaminergica può non essere ecal-latante anche quando presente, così come in soggetti affetti da parkinsoni-smi atipici si può osservare una risposta alla terapia farma-cologica che, ancorché ridotta, perdura per uno-due anni. Una diagnosi effettuata esclusivamente sulla base di tali cri-teri, ha portato ad errore nel 25% dei casi sottoposti post-mortem ad esame autoptico-istologico presso la Brain Bank di Londra [2]. L’interesse per una tale diagnosi differenzia-le risiede principalmente nella differente evoluzione deldifferenzia-le patologie sopra citate e nella notevole differenza della ri-spettiva risposta ai farmaci.
Fino ad oggi le tecniche di neuroimaging utilizzate per la valutazione di tale diagnosi differenziale si sono basate prin-cipalmente sulla utilizzazione di metodiche di medicina nu-cleare quali la SPECT e la PET [3–8]. Pur essendo tali me-todiche altamente sensibili nel rilevare precocemente una deplezione delle terminazioni nervose nigro-striatali e utili nel follow-up della malattia [9–11], la loro ridotta disponi-bilità (in particolare della PET), gli alti costi, la ridotta di-sponibilità di traccianti e la scarsa risoluzione spaziale le rendono inadatte come supporto routinario alla clinica nel-la diagnosi precoce di MDP. Infatti, ad esempio, nel-la PET non permette di distinguere all’interno dei nuclei della base il putamen dal globo pallido e tanto meno il pallido laterale da quello mediale.
Molti degli studi effettuati con PET nel MdP hanno in ef-fetti studiato le variazioni di densità recettoriale, fibre dopa-minergiche o le variazioni di metabolismo nel “nucleo lenti-colare”. Questa entità anatomica corrisponde nell’uomo all’insieme del putamen, globo pallido esterno e globo palli-do interno. Le correnti teorie sulla fisiopatogenesi del MdP assegnano funzioni spesso diametralmente opposte a queste strutture. Un esame che le comprenda nel loro complesso senza una adeguata differenziazione [12, 13], rischia sicu-ramente di produrre una sottostima delle alterazioni. Infatti,
Materials and methods
We studied 20 subjects with idiopathic PD (11 men, nine women; mean age 68±3.2 years) according to the Brain Bank criteria [15]. Disease duration was 5±2.4 years. Only patients presenting with at least two of the three PD cardinal symptoms and a proven response to dopaminergic therapy were included. Subjects who presented with other neurolog-ical diseases and who did not respond to acute therapy were excluded from the study. In order to avoid any interferences caused by the effect of dopaminergic drugs on the basal gan-glia flow [16], the subjects were studied after at least 20 days’ withdrawal of dopaminergic treatment. Twenty nor-mal subjects matched by age and gender were studied as a control group. Before the MRI examination, all patients pro-vided informed consent. This study was approved by our Ethics Committee. The study was conducted using a 1.5 Tes-la Philips Gyroscan ACS-NT MRI magnet (Philips Medical Systems, Best, The Netherlands) with a 30-mT gradient in-tensity and a sinusoidal profile, and a standard quadrature brain coil. A sagittal T2-TSE sequence (slice thickness 3 mm, number of averages 3) was used to identify the two commissures on which we performed an axial T1-SE se-quence, a T2-weighted sequence using cerebral spinal fluid (CSF) suppression [axial fluid attenuated inversion recovery (FLAIR)] with a FOV 230 mm, TE 150 ms, TR 6,000 ms, TI 2,000 ms, slice thickness 5 mm, gap 1 mm, matrix 256x256, number of averages 1, acquisition time approximately 3 min.
The PW-MRI study was carried out using a gradient echo (GE), T2*-weighted sequence with TR 620 ms, TE 30 ms,
al diminuito metabolismo del pallido esterno dovrebbe cor-rispondere un aumento di attività in quello interno con una somma dei due probabilmente invariata [14].
Lo scopo di questo studio è stato quello di utilizzare la RM perfusionale come metodica diagnostica per identificare uno specifico pattern di perfusione a livello dei gangli della base nei soggetti affetti da MdP.
Materiali e metodi
Sono stati studiati 20 soggetti affetti da Parkinson idiopatico (11 maschi, 9 femmine; età media 68±3,2 anni) secondo i criteri della Brain Bank [15], con una durata di malattia va-riabile tra i 5±2,4 anni. Sono stati inclusi solo pazienti che presentavano almeno due dei tre sintomi cardinali del MdP e che presentavano una dimostrata risposta alla terapia do-paminergica. Sono stati esclusi da questo gruppo di pazienti in studio, soggetti che presentavano altre patologie neurolo-giche e che non rispondevano alla terapia acuta.
Per evitare interferenze possibili dovute all’azione dei farmaci dopaminergici sul flusso dei gangli della base [16], i soggetti sono stati studiati dopo un periodo di interruzione del trattamento dopaminergico di almeno venti giorni. Sono stati inoltre studiati 20 soggetti normali come gruppo di con-trollo selezionati per sesso ed età. Prima di effettuare l’esa-me RM, tutti i pazienti hanno firmato un consenso informato. Questo studio è stato approvato dal nostro comitato etico. È stato utilizzato un magnete RM Philips Gyroscan ACS-NT da
Fig. 1a,b Axial T1-weighted (a) and corresponding regional cerebral blood flow map (b). Regions of interest were manually placed over basal ganglia and parieto-occipital white matter.
Fig. 1a,b Immagine assiale T1 pesata (a) e corrispettiva mappa di perfusione (b). Le ROI sono state posizionate manualmente a livello dei gangli della base
e sulla sostanza bianca parieto-occipitale.
slice thickness 7, gap 0 mm, number of averages 1, flip angle 40°, matrix 128x128, acquisition time 1.17 min, providing a set of dynamic T2-weighted contrast susceptibility images acquired during the passage of contrast material. Finally, the axial T1 sequence was repeated after administration of gadolinium. Gadolinium diethylene triamine pentaacetate (G-DTPA) paramagnetic contrast material (Magnevist, Schering, Berlin, Germany) was injected as a bolus, 0.4 mmol/kg, while the subjects held their eyes closed, via an 18-gauge needle cannula inserted into an antecubital vein of the arm using an automatic injector with a 4 ml/s flow rate.
Perfusion data were processed by dedicated software on an independent console to obtain perfusion maps to calculate cerebral blood flow (rCBF) according to the technique pviously reported by Apruzzese et al. [17]. Then, ten-pixel re-gions of interest (ROIs) were manually placed on the rCBF maps in the following regions: head of the caudate nucleus (CN), putamen (PU), external and internal globus pallidus (eGP/iGP) separately, and ventrolateral nucleus of the thala-mus (TH). Perfusion data were also measured in the parieto-occipital white matter (POWM) for normalisation (Fig. 1). Pixels with signal intensity exceeding by 2 standard devia-tions (SD) the average values of the brain were excluded, as they probably corresponded to blood vessels. Perfusion data were calculated as the average of every ROI positioned on the basal nuclei and POWM on every side and values ob-tained were transformed into logarithms and normalised as a percentage of the value obtained with the ipsilateral POWM. In order to determine asymmetries (“contrast” effect), the normalised data of each nucleus were expressed as the ratio between the nucleus being studied and the corresponding con-tralateral nucleus according to the formula: (R nucleus – L nu-cleus) / (R nucleus + L nunu-cleus)*100. In PD patients, the for-mula was expressed as: [(less affected side – more affected side) / (less affected side + more affected side)*100] based on their clinical asymmetry. We used the third section of the Uni-fied Parkinson’s Disease Rating Scale (UPDRS) as a score of PD motor disability, ranging from 0 (normal) to 180 (maxi-mum disability) [18]. The asymmetry index was calculated by subtracting the score of the less affected side from that of the more affected side. Data were analysed using STATISTICA software for Windows. Normalised data were analysed using parametric ANOVA tests, which include the following prima-ry factors: “group” (‘between’ factor: PD vs. control subjects); “lateralization” (‘within’ factor: right side or better side vs. left side or worse side); “nuclei” (‘within’ factor: caudate, thala-mus, putamen, external globus pallidus, internal globus pal-lidus). Greenhouse-Geisser correction was used when neces-sary. If a factor with more than two levels was significant or if interactions between factors were significant, Tukey’s test was used as a post hoc test. In order to compare “contrast” data in the two groups, the factors “group” and “nuclei” were used.
Results
All patients with PD showed a significant (F(1/37)=7.98;
p<0.01) difference in the average rCBF on the better side (bs)
1,5 Tesla (Philips Medical-System, Best, Olanda) con inten-sità di gradiente di 30 mT con profilo sinusoidale e con una bobina in quadratura standard dedicata per lo studio dell’encefalo.
Abbiamo eseguito una sequenza T2 TSE sul piano sagit-tale (spessore di strato 3 mm, numero di medie 3) per la in-dividuazione delle due commessure sulle quali abbiamo im-postato una sequenza T1 SE assiale, una sequenza T2 pesa-ta con la tecnica della soppressione liquorale (FLAIR assia-le) con FOV 230 mm, TE di 150 ms, TR=6000 ms, TI=2000 ms, spessore di strato 5 mm gap di 1 mm, matrice 256x256, numero di medie 1 con un tempo di acquisizione di 3 minuti circa.
Lo studio RM perfusionale è stato effettuato utilizzando una sequenza Gradient Echo (GE) T2* pesata con un TR=620 ms, TE=30 ms, spessore di strato=7, gap=0 mm, numero di medie 1, Flip Angle=40°, matrice=128x128, tem-po di acquisizione=1,17 min, al fine di ottenere una serie di immagini dinamiche a suscettibilità di contrasto T2 pesate acquisite durante il passaggio di MdC. Infine abbiamo ripe-tuto una sequenza T1 assiale dopo gadolinio. Il MdC para-magnetico gadolinio-DTPA (Magnevist, Shering, Berlino, Germania) è stato iniettato a bolo, 0,4 mmol/kg mentre i soggetti tenevano gli occhi chiusi, mediante iniettore auto-matico con una velocità di flusso pari a 4 ml/s ed attraverso un ago-cannula del calibro di 18 gauge posizionato in una vena antecubitale del braccio. I dati di perfusione sono stati elaborati tramite software dedicato su consolle indipenden-te, ottenendo quindi mappe di perfusione per il calcolo del flusso ematico cerebrale (rCBF), in accordo a quanto già descritto da Apruzzese et al. in un precedente lavoro [17]. Sono state quindi posizionate manualmente sulle mappe dell’rCBF delle ROI di 10 pixel a livello della testa del nu-cleo caudato (CN), a livello del putamen (PU), a livello del globo pallido esterno ed interno (GPe/GPi) separatamente, ed a livello del nucleo ventrolaterale del talamo (TH). Inol-tre, i dati di perfusione sono stati misurati a livello della so-stanza bianca parieto-occipitale (WPOM) per eseguire la normalizzazione dei dati (Fig. 1).
Sono stati esclusi i pixel con intensità di segnale che su-perava di 2 DS i valori medi dell’encefalo, poiché probabil-mente rappresentanti vasi sanguigni. I dati della perfusione sono stati calcolati come la media di ogni ROI posizionata a livello dei nuclei della base e di quelle posizionate a livello della WPOM di ogni lato, i valori ottenuti sono stati trasfor-mati in logaritmo, e quindi normalizzati come percentuale del valore ottenuto con la WPOM omolaterale. Per la deter-minazione delle asimmetrie (effetto “contrasto”) le norma-lizzazioni dei dati relativi a ciascun nucleo sono stati espres-se come rapporto tra il nucleo in esame ed il corrispondente controlaterale, secondo la formula: (nucleo dx-nucleo sn)/(nucleo dx+nucleo sn)*100. Nei pazienti con morbo di Parkinson la formula è stata espressa come: [(lato meno af-fetto-lato più affetto)/(lato meno affetto+lato più affet-to)*100] in accordo con la loro asimmetria clinica. Abbiamo usato la sezione III dell’UPDRS (Unified Parkinson’s Di-sease Rating Scale) come score di disabilità motoria nel Parkinson che va da 0 (normale) a 180 (massimo livello di disabilità) [18]. L’indice di asimmetria è stato calcolato
sot-vs. the worse side (ws) as compared with control subjects
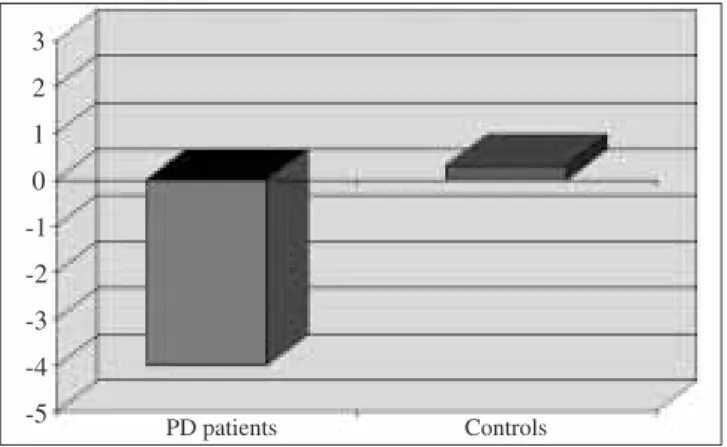
(“group” x “side” interaction) (Fig. 2). In patients with PD, this is due to a higher average baseline rCBF on the ws (117.6) as compared with the bs (107.3) (Fig. 3), a finding which proved statistically significant (post hoc p<0.001). This variation was not observed in control subjects (110.9 vs. 111.2). This was confirmed by the “contrast” analysis, which showed a significant difference (F(1/37)=9.44; p<0.01) in mean contrast in the two groups (–4.39 vs. –0.064; PD vs. controls). The difference is similar in all the nuclei studied, with no significant “group”x“nuclei” interaction being found.
Sixteen of the 20 PD patients showed an abnormal “con-trast index” in the putamen while 13 showed the same anom-aly in the thalamus. Only five control subjects showed abnor-mal values in the putamen and none in the thalamus. Seven patients with PD had abnormal contrast values in all nuclei un-der study whereas these were normal in all control subjects.
Discussion
The diagnosis of PD remains largely clinical and is based on the presence of the three characteristic pathognomonic symp-toms. The use of neuroimaging techniques has increased great-ly over the last 10 years and has contributed to advancing the knowledge about the pathophysiology of many neurological diseases. In PD, today, brain MRI and SPECT and PET func-tional studies are usually applied for clinical and scientific pur-poses. PET and SPECT are still, however, very costly meth-ods, use of which is restricted to a small number of highly spe-cialised centres; hence, they cannot be proposed as screening tests. MRI, on the other hand, is far more widespread, less costly, and available in a number of radiology facilities. Over the last few years, various researchers have used PW-MRI to measure CBF in several diseases of neuroradiological concern. The literature does not provide information on possible altered flow values detected in degenerative diseases such as PD with
traendo lo score del lato meno affetto da quello del lato più affetto.
Per l’analisi dei dati è stato utilizzato un software STATI-STICA per Windows. I dati normalizzati sono stati analizza-ti mediante dei tests ANOVA di analizza-tipo parametrico che inclu-dano i seguenti fattori principali: ”gruppo” (fattore beetwen: MdP vs soggetti controllo); “lateralizzazione” (fattore within: lato dx o lato migliore vs. lato sn o lato peg-giore); “nuclei” (fattore within: caudato, talamo, putamen, globo pallido esterno, globo pallido interno). La correzione di Greenghouse Geisser è stata utilizzata quando necessario. In caso di significatività di un fattore con più di due livelli od in caso di significatività di interazioni tra fattori è stato uti-lizzato il Tukey test come post hoc.
Per comparare i dati “contrasto”, nei due gruppi sono stati usati i seguenti fattori: “gruppo”, “nuclei”.
Risultati
Nella totalità dei pazienti con MdP si è dimostrato una si-gnificativa (F(1/37)=7,98; p<0,01) differenza dell’rCBF medio nel lato migliore (bs) vs. il lato peggiore (ws), rispet-to ai soggetti controllo (interazione “gruppo” x “larispet-to”) (Fig. 2). Questo è dovuto, nei pazienti con MdP, ad un più alto rCBF medio, in condizioni basali, nel ws (117,6) rispet-to al bs (107,3) (Fig. 3), darispet-to che è risultarispet-to essere statisti-camente significativo (post hoc p<0,001). Tale variazione non è stata osservata nei soggetti controllo (110,9 vs. 111,2). A conferma di ciò, l’analisi di “contrasto” ha mostrato una differenza significativa (F(1/37)=9,44; p<0,01) del contra-sto medio nei due gruppi (-4,39 vs. -0,064; MdP vs. control-li). La differenza risulta essere simile in tutti i nuclei studia-ti così che nessuna interazione significastudia-tiva “gruppo”x “nu-clei” è stata riscontrata.
Sedici dei 20 pazienti con MdP hanno mostrato un anor-male “indice di contrasto” nel putamen e 13 hanno mostra-to la stessa anormalità nel talamo.
Solamente 5 soggetti controllo hanno mostrato valori anormali nel putamen e nessuno nel talamo. Sette pazienti con MdP hanno mostrato valori anormali di contrasto in tut-ti i nuclei studiatut-ti, mentre in nessuno dei soggettut-ti controllo si è evidenziato tale riscontro.
Discussione
La diagnosi di morbo di Parkinson rimane prevalentemente clinica e si basa sulla presenza della caratterizzazione della triade sintomatologia patognomonica. L’uso delle tecniche di neuroimaging si è notevolmente esteso nell’ultimo decen-nio ed ha contribuito ad accrescere le conoscenze nella fi-siopatologia di numerose malattie neurologiche. Nel MdP sia la risonanza magnetica cerebrale che le indagini funzio-nali SPECT e PET sono oggi applicate comunemente per scopi clinici e scientifici. La PET e la SPECT, tuttavia, ri-mangono metodiche molto costose, il cui utilizzo è limitato a Fig. 2 Interhemispheric asymmetry of regional cerebral blood flow values in
the basal ganglia of Parkinson’s disease patients that was not observed in control subjects.
Fig. 2 Il grafico evidenzia una asimmetria interemisferica dei valori di
rCBF nei gangli della base nei pazienti con MdP non presente nei soggetti controllo. 3 2 1 0 -1 -2 -3 -4 -5 PD patients Controls
PW-MRI. Our study, unique in its kind, aimed at evaluating perfusion alterations in the basal nuclei of PD subjects. Our da-ta show a marked rCBF asymmetry between the more affected and the less affected side in the basal nuclei of patients with PD. A possible explanation of this result might be the loss of dopamine in the affected side, which could result in a maxi-mum increase in the baseline rCBF on this side, an asymmetry that was never observed in control subjects. A relative asym-metry of rCBF in the basal ganglia has also been reported in other studies using PET in patients with unilateral or bilateral PD. Wolfson conducted a cerebral perfusion study using PET on patients affected by mild-to-moderate forms of unilateral and bilateral PD, finding blood flow asymmetry in the basal ganglia on both sides and with respect to controls. In this study, patients with bilateral PD showed no flow variation be-tween the two sides. Other PET studies, on the other hand, did not find any asymmetry between homologous basal ganglia regions but only when the rCBF in basal ganglia was com-pared with the flow in critical cortical areas [19]. Our study partially confirms these findings, as previously described, by using a far less expensive method, such as PW-MRI. We were also able to detect a perfusion asymmetry in most PD patients (65%–80%) by analysing homologous sub-regions of basal nuclei, thanks to the higher resolution of MRI relative to PET. We believe that future studies analysing the ratio between cor-tical areas and basal ganglia might be useful to better demon-strate the abnormalities found in our investigation.
Conclusions
PW-MRI appears to be a valid method in the diagnosis of PD since it can identify blood flow asymmetry in the basal nu-clei in both hemispheres. The low cost of this method, its wide availability, and its higher resolution compared with other functional imaging modalities (PET, SPECT) make PW-MRI extremely useful and expedient as a support tool for the early diagnosis of PD.
pochi Centri ad elevata specializzazione, non è quindi pro-ponibile il loro impiego come esame di screening.
La RM è, al contrario, una metodica molto più diffusa, meno dispendiosa e disponibile in numerosi centri di dia-gnostica per immagini. Negli ultimi anni numerosi ricerca-tori hanno utilizzato la RM con tecnica perfusionale per mi-surare il flusso ematico cerebrale, per lo studio di svariate patologie di interesse neuroradiologico. Tuttavia, a tutt’og-gi, non sono riportati dati in letteratura circa la possibilità di evidenziare alterati valori di flusso nell’ambito di patolo-gie degenerative come la MdP mediante la RM perfusionale. Il nostro lavoro, unico nel suo genere, si propone di valuta-re alterazioni perfusionali a livello dei nuclei della base, nei soggetti con MdP.
I nostri dati mostrano una notevole asimmetria dell’rCBF tra il lato più affetto ed il lato meno affetto nei nuclei della base dei pazienti con MdP. Una possibile spiegazione di ta-le risultato, a nostro giudizio, potrebbe essere dovuta alla maggior perdita di dopamina nel lato affetto, che potrebbe indurre un incremento massimale del rCBF in questo lato in condizioni basali. Tale asimmetria non è stata, infatti, mai osservata nei soggetti controllo.
Una relativa asimmetria dell’rCBF nei gangli della base, è stata riportata anche in altri studi con PET nei pazienti con MdP unilaterale o bilaterale. Wolfson ha condotto uno studio di perfusione cerebrale, valutata con la PET, su pa-zienti affetti da forme lievi/moderate di MdP mono e bilate-rale ed ha evidenziato una asimmetria del flusso a livello dei gangli della base di entrambi i lati e rispetto ai controlli. In questo studio, i pazienti con MdP bilaterale non dimostrava-no alcuna variazione di flusso tra i due lati. Altri studi con PET, invece, non hanno mostrato asimmetria tra regioni dei gangli della base omologhe, ma solamente se l’rCBF dei nu-clei della base erano comparati con quelli di aree corticali critiche [19].
Il nostro studio conferma in parte questi dati, come pre-cedentemente descritto, attraverso una metodica molto me-no dispendiosa quale è la risonanza magnetica perfusiona-le. È stato inoltre possibile, grazie alla più alta risoluzione della RM rispetto alla PET, rivelare un’asimmetria perfu-sionale nella maggioranza dei pazienti con MdP (65%–80%) esaminando subregioni omologhe dei nuclei della base. Riteniamo che studi futuri, che analizzeranno la ratio tra le aree corticali ed i gangli della base, potrebbero essere utili per dimostrare ancor meglio le anormalità evi-denziate nel nostro lavoro.
Conclusioni
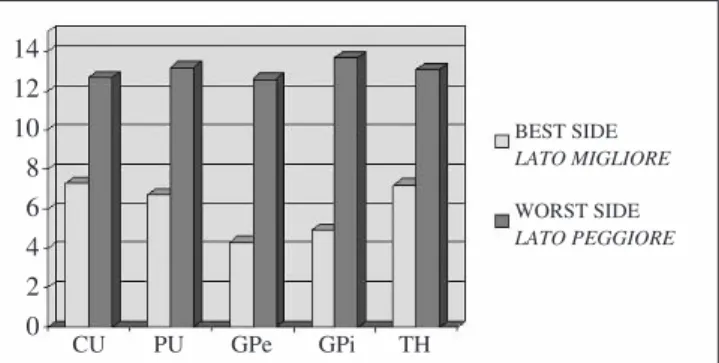
La RM perfusionale sembra essere una metodica valida per la diagnosi di MdP, essendo in grado di individuare un’asimmetria di flusso a livello dei nuclei della base dei due emisferi. Il basso costo della metodica, la sua estrema diffusione ed il suo maggior potere di risoluzione rispetto ad altre metodiche di imaging funzionale (PET, SPECT) rendo-no la RM perfusionale estremamente utile e vantaggiosa co-me supporto per una diagnosi precoce di patologia. Fig. 3 Interhemispheric asymmetry in Parkinson’s disease patients caused
by a higher flow on the worse side in all basal ganglia. CU caudate, PU putamen, GPe external globus pallidus, GPi internal globus pallidus, TH thalamus.
Fig. 3 Il grafico evidenzia l’asimmetria interemisferica nei pazienti con
MdP dovuta ad un più alto flusso nel lato peggiore evidente a livello di tut-ti i gangli della base. CU: caudato; PU: putamen; GPe: globo pallido ester-no; GPi: globo pallido interester-no; TH: talamo.
14 12 10 8 6 4 2 0 CU PU GPe GPi TH BEST SIDE LATO MIGLIORE WORST SIDE LATO PEGGIORE
1. Jellinger K, Factor SA, Sanchez-Ramos J et al (1989) Letter to Editor. Mov Disord 4:90–92
2. Hughes AJ, Ben-Sholomoy, Daniel SE et al (1992) Accuracy of clinical diagnosis of idiopathic Parkinson’s disease: a clinico-pathological study of 100 cases. J Neurol Neurosurg Psychiatry
55:181–184
3. Leenders KL, Salomon EP, Tyrrel P et al (1990) The nigrostriatal dopaminergic system assessed in vivo by positron emission tomography in healthy volunteer subjects and patients with Parkinson’s disease. Arch Neurol 47:1290–1298
4. Turjanski N, Lees AJ, Brooks DJ (1997) In vivo studies on striatal dopamine D1 and D2 site binding in L-dopa-treated Parkinson’s disease patients with and without dyskinesias. Neurology 49:717–723
5. Seibyl JP, Marek K, Sheff K et al (1998) Iodine-123-beta-CIT and iodine-123-FPCIT SPECT measurement of dopamine transporters in healthy subjects and Parkinson’s patients. J Nucl Med 39:1500–1508
6. Vingerhoets FJ, Snow BJ, Lee CS et al (1994) Longitudinal fluorodopa positron emission tomographic studies of the evolution of idiopathic parkinsonism. Ann Neurol 36:759–764
7. Frey KA, Wieland DM, Kilbourn MR (1998) Imaging of monoaminergic and cholinergic vesicular transporters in the brain. Adv Pharmacol 42:269–272 8. Brooks DJ (1998) The early diagnosis of
Parkinson’s disease. Ann Neurol 44:S10–S18
9. Marek KL, Seibyl JP, Zoghbi SS et al (1996) [123I]-beta-CIT SPECT imaging demonstrates bilateral loss of dopamine trans-porters in hemi-Parkinson’s disease. Neurology 46:231–237 10. Benamer HTS, Patterson J, Grosset DG
(2000) Accurate differentiation of parkinsonism and essential tremor using visual assessment of [123I]-FP-CIT SPECT imaging: the [123I]-FP-CIT study group. Mov Disord 15:503–510 11. Berendse HW, Booij J, Francot CM et al
(2001) Subclinical dopaminergic dysfunction in asymptomatic Parkinson’s disease patients’ relatives with a decreased sense of smell. Ann Neurol 50:34–41
12. Wolfson LI, Leenders KL, Brown LL et al (1985) Alterations of regional cerebral blood flow and oxygen metabolism in Parkinson’s disease. Neurology 35:1399–1405
13. Perlmutter JS, Raichle ME (1985) Regiona1 blood flow in
hemiparkinsonism. Neurology 35:1127–1134
14. Obeso AJ, Rodriguez-Oroz MC, Rodriguez M et al (2000)
Pathophysiology of the basal ganglia in Parkinson’s disease. Trends Neurosci 23[suppl 10]:S8–S19
15. Luypaert R, Boujraf S, Sourbron S et al (2001) Diffusion and perfusion MRI: basic physics. Eur J Radiol 38:19–27 16. Brusa L, Bassi A, Pierantozzi M et al (2002) Perfusion-weighted dynamic susceptibility (DSC) MRI: basal ganglia hemodynamic changes after
apomorphine in Parkinson’s disease. Neurol Sci 23[Suppl 2]:S61–S62 17. Apruzzese A, Silvestrini M, Floris R et
al (2001) Cerebral hemodynamics in asymptomatic patients with unilateral carotid artery occlusion: a dynamic susceptibility contrast MR and transcranial Doppler study. Am J Neuroradiol 22:1062–1067 18. Fahn S, Marsden CD, Calne D et al
(1987) Recent developments in Parkinson’s disease. MacMillan Healthcare Information, Floraham Park, NJ
19. Eidelberg D, Moeller JR, Dhawan V et al (1994) The metabolic topography of Parkinsonism. J Cereb Blood Flow Metab 14:783–801