View the article online for updates and enhancements.
Silver fir characterized by micro-imaging NMR and FTIR
spectroscopy
S Longo1,2,*, S Capuani2, C Corsaro1 and E Fazio1
1 Department of Mathematical and Computational Sciences, Physics Science and Earth Sciences (MIFT), University of Messina, Viale Ferdinando Stagno D' Alcontres 31, 98166 Messina, Italy.
2 Nuclear Magnetic Resonance and medical physics Laboratory CNR-ISC, Department of Physics, Sapienza University of Rome, Piazzale Aldo Moro 5, 00185 Rome, Italy.
* E-mail: [email protected]
Abstract. Nuclear Magnetic Resonance micro-imaging (μMRI) approach with multiparametric measurement and FTIR spectroscopy was adopted to investigate silver fir. In particular, we investigated weakly interacting and bound water, detected by NMR and FTIR techniques, hypothesizing a water interaction with the main structures of the wood. For instance, by means of NMR analyses, we obtain information about the principal wood morphological/structural modifications, which are associated with humification processes, reflected in the changes of aromatic C-H and C-O vibration modes shown by FTIR. Thus, the combined use of NMR and FTIR allows characterizing the mobility of water with respect to lignin and cellulose features, which can serve as a benchmark for wood degradation conditions.
1. Introduction
The study of wood is recently an emerging area in materials science. Wood as a natural filler is a low- cost material with low density and high specific properties, and it is also biodegradable and non- abrasive. Wood is also characterized by a good strength to weight ratio. It is shock-resistant and has the ability to bend without fracture [1]. For all these properties, it has been largely used for the manufacturing of many historical works which nowadays require timely actions to preserve their state of beauty. One of the main wood structural disadvantages occurs when it is penetrated by moisture and water [2]. Hence, it is interesting to define the relationship between the morphological characteristics and the micro- and ultrastructure of wood tissues, as expressed by the thickness of tracheid walls, lignin content and crystallinity of cellulose as well as by its hydrophobic capacity. Most of the standard techniques used to characterize wood morphology allows only in part to clearly define the bulk and surface characteristics with its porosity and, in turn, to the hydrophobic capacity of woods [3].
In this work, micro-NMR imaging analyses were carried out on a piece of silver fir (Abies alba) and some of the information, obtained by NMR relaxation times T1 and T2 and diffusion coefficient D of water in wood and those collected by conventional FTIR method are discussed.
2. Experimental
2
used. T2-weighted acquisition was performed with a 16x16 μm in-plane resolution and 0.2 mm slice thickness (STK), number of averages (NS) =128, matrix size (MTX)=512x512 and Field Of View (FOV) =0.8x0.8 mm2, Repetition Time (TR) =1000 ms.
To evaluate T2, T2-weighted images, using the same aforementioned parameters but choosing MTX=256X256, were obtained with echo times (TEs)= 6, 12, 18, 24 ,30 ms. For T1 evaluation, saturation recovery acquisitions at different TR: 300, 450, 700, 1000, 2000 ms were carried out (STK=0.2 mm, NS=64, MTX=256x256, FOV =0.8x0.8 mm2, in plane resolution 32x32 μm2, TE=3ms).
2.2. Global Diffusion, and relaxation times
To evaluate global water diffusion coefficient D, a Pulse gradient stimulated echo (PGSTE) [4] was used with TR=3s, NS=64, 32 gradient strength values (g) from 2.5 to 121 Gauss/cm, gradient pulse duration δ=3ms, diffusion time =80ms.
An inversion recovery with TR=6s and 30 inversion times from t=1ms to t=4000ms was used to obtain detailed T1 values, whereas a Carr Purcell Meiboom Gill (CPMG) with TEs=n*0.5ms (n=1 to 128) and TR=6s was used for extracting T2 values belongings to different water pools [5,6].
2.3. Processing NMR imaging and NMR data
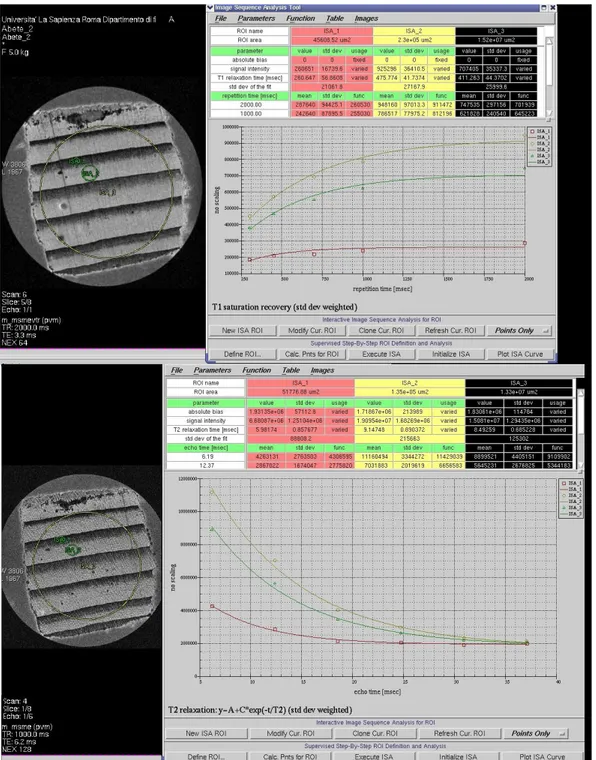
Three different regions of interest (ROIs) (see Figure 1) were chosen in T2 and T1 weighted images being interested to investigate wood features related to a different amount of water. Specifically, T1 and T2 were evaluated in each late-wood (dark pixels), early-wood (light pixels) ROI and in the whole sample. From imaging data, the recovery of the equilibrium magnetization (M0) along the direction of the static field was fitted to a single exponential function of the form:
M(TR) = M0[1-exp(-TR/T1)] (1) so, obtaining the corresponding relaxation time T1. To obtain T2, the signal intensity versus TE was fitted using the function:
M(TE)=M0*exp(-TE/T2) +c (2) On the other hand, considering the global signal (no-imaging modality) T1 and T2 were obtained by using bi-exponential fitting functions [5,6]:
M(t) = M01[1-2*exp(-t/T11)] + M02[1-2*exp(-t/T12)] (3) and
M(TE)=M01*exp(-TE/T21) +M02*exp(-TE/T22) (4) respectively.
Finally, diffusion coefficients D1, D2 and D3 characterizing the diffusion of bulk water, restricted water and cellulose hydration water, were obtained by fitting PGSTE data with the function:
S(g)= 1*[exp(-(gδ)2(-δ/3)D1]+ 2*[exp(-(gδ)2(-δ/3)D2]+ 3*[exp(-(gδ)2(-δ/3)D3] (5) where 1, 2 and 3 are proportional to the water molecules contained in each pool.
Figure 1. Abies alba cross-section T1-weighted (upper image) and T2-weighted (lower image) together with T1 data recovery and T2 signal decay used to extract T1 and T2 values, respectively. Data analysis was performed in dark and lighter pixels regions using Equations (1) and (2).
4
designed to minimize or even remove the sources of ordinate errors associated with standard FTIR. 3. Results and discussion
Figure 1 (upper image) displays T1-weighted image and the signal intensity as a function of the repetition time (TR), in the two different ROIs (dark and light pixels regions) corresponding to latewood and earlywood and in an extended ROI including a mean area of the sample. From T1 imaging data, we find T1=(476±42ms) and T1=(261±57ms) for the light and dark region, respectively. The value in the extended ROI gives rise to the average T1=(411±44ms). Figure 1 (lower image) displays T2-weighted image and the signal intensity as a function of the echo time (TE), in the two different ROIs (dark and light pixels regions) corresponding to latewood and earlywood. Note that, from T2 imaging data, we find T2=(9.2±0.9ms) and T2=(6.0±0.2ms) for the white and black region, respectively. Moreover, in the mean ROI, we obtain T2=(8.5±0.7ms). However, since the value of 6 ms coincides with the lowest TE, we have performed a more detailed investigation (see the details of CPMG pulse sequence reported in the Material and Method section) on the global sample and, using Equation 4, we obtain T21=(17.0±0.8ms) and T22= (2.7±0.2ms) in agreement with the results reported in references [9]. Conversely, the quantification of the longitudinal relaxation times, performed using Equation 3, gives us a single value of T1 equal to (440±54)ms. All the obtained values reflect the state of water in the considered regions and, therefore, characterize the system under study in its specific conditions. Known the wood structure alterations induced by water, different actions could be taken to preserve it.
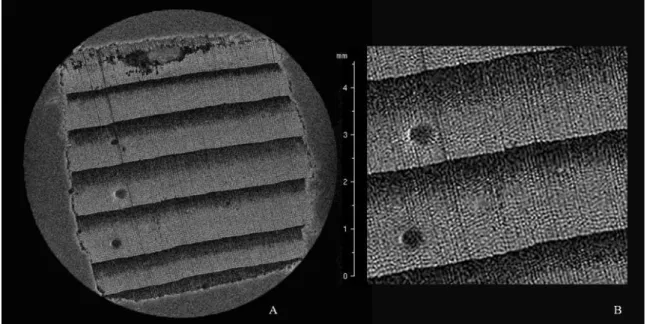
Figure 2. Abies alba cross-section T2-weighted micro-MRI obtained at 9.4T magnetic field. In- plane resolution was 32x32 μm2.
In Figure 2 micro-MRI cross-section images of the sample, Abies alba, is shown. The softwood structure, typical of coniferous wood, is visible. In particular, early and latewood are clearly distinguishable: latewood and earlywood correspond to dark and light pixels, respectively, while the
transition between them is abrupt. Moreover, few resin canals with a diameter of about 0.25 mm are also visible. Generally, there is no presence of resin canals in silver fir; thus, we think that they refer to traumatic resin canals [7]. All these observations are in agreement with guidelines from dichotomous keys, commonly used by wood experts as reference for the microscopic identification of the wood species [8].
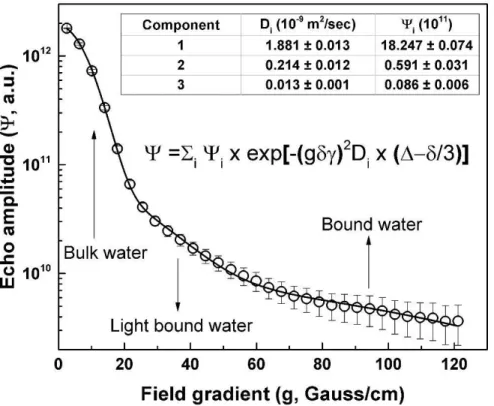
Figure 3 shows the signal decay, obtained using a PGSTE sequence, as a function of the gradient strength g and the best fitting function.
Figure 3. The decay of the echo amplitude, evaluated by means of PGSTE pulse sequence, as a function of the gradient strength g (= 42.58 MHz/T is the proton gyromagnetic ratio). Three exponential contributions have been identified and ascribed to bulk water, light bound water between fibres and bound water inside fibres (or cellulose hydration water).
Three different contributions, belonging to three different mobile water molecules, have been discriminated. In particular, the biggest value of the diffusion coefficient D1 = (1.881+-0.013)*10-9 m2/s belongs to bulk water (we remember that the sample is immersed in liquid water), that is the water inside vessels. D2 =(2.140+-0.120)*10-10 m2/s belongs to water at the fibres interface of the wood sample and inside the cells [10]. Finally, D3 = (1.30+-0.10)*10-11 m2/s belongs to tightly bound water molecules, strongly confined (pore on the order of nm) or bonded to hydroxyl groups of cellulose and lignin and that also remain on drying [11-12]. The normalized water population associated with estimated diffusion coefficients are: 96.4%, 3.1% and 0.5% of the total magnetization. Therefore, the 96.4% of the total observable water protons in sample belongs to bulk water, i.e. water in vessels, the 3.1% belongs to intracellular water and the 0.5% to water inside silver fir, as hydration water of cellulose and lignin.
In terms of degradation, wood pore size distribution is a key parameter in water accumulation. As shown above, diffusion NMR techniques may provide an indication on separate wood-bound water, restricted light bound water, and confined water in vessels (bulk water) fractions by measuring
6
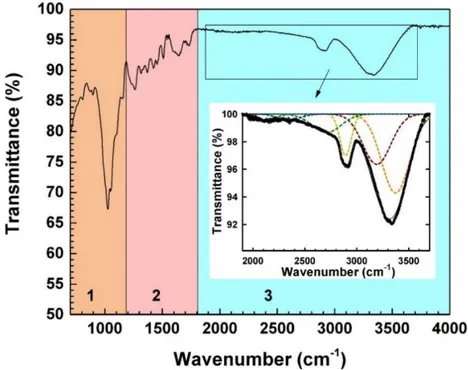
stretching mode, 3) CH stretching of cellulose, 4) CH2 stretching of cellulose and hemicellulose 5) free OH in cellulose and 6) free OH in lignin, respectively. Really the two contributions, centred at about 3200 and 3385 cm-1, are also ascribed to the OH stretching bands of bound and mobile water, respectively.
Figure 4. FTIR spectrum of the Abies alba wood. In the inset, the deconvolution of the profile observed in the 2000-3500 cm-1 range.
From the ratio between the analytic area of these sub-bands, we estimate the relative percentage of mobile water with respect to bound water, which results of about 61%. We emphasize that, when we talk about bound water (by means of hydrogen bonds) in NMR analyses, we refer to the hydration water exchanged with a fast rate on the hydration surface. Given the "exchange" times, it is not plausible, by the NMR technique, to observe very strongly bound water. Therefore, to obtain this complementary information, FTIR technique was used, which provides local information on wood chemistry and structure at the level of wood cells, alterations of the composition and interactions between wood polymers within the lignocellulose complex induced by water filtration.
Hence, FTIR has been used to determine the gradient of the water absorbed (following the hydroxyl groups OH) between the surface and the inner part of the Abies alba wood. In detail, the ratio between the OH contribution at 3400 cm-1 and the lignin C=C aromatic contribution centred at around 1610 cm-1 gives information about the penetration degree of OH groups from the surface than inside the wood. Generally, the ancient or artificially aged woods show a decrease of OH content from the surface to the inner part, as expected since the ageing of the surface favours the creation of sites where OH groups are fixed. In our case, this ratio is about 2.2, a value which agrees with those found in ancient woods, at a depth of about 8 mm from the surface [13].
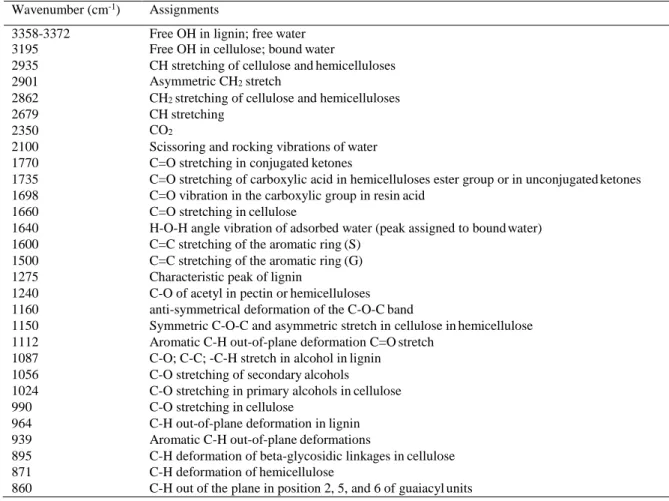
Table 1. The main FTIR bands of the Abies alba wood and their assignments. Wavenumber (cm-1) Assignments
3358-3372 Free OH in lignin; free water
3195 Free OH in cellulose; bound water
2935 CH stretching of cellulose and hemicelluloses
2901 Asymmetric CH2 stretch
2862 CH2 stretching of cellulose and hemicelluloses
2679 CH stretching
2350 CO2
2100 Scissoring and rocking vibrations of water
1770 C=O stretching in conjugated ketones
1735 C=O stretching of carboxylic acid in hemicelluloses ester group or in unconjugated ketones 1698 C=O vibration in the carboxylic group in resin acid
1660 C=O stretching in cellulose
1640 H-O-H angle vibration of adsorbed water (peak assigned to bound water) 1600 C=C stretching of the aromatic ring (S)
1500 C=C stretching of the aromatic ring (G)
1275 Characteristic peak of lignin
1240 C-O of acetyl in pectin or hemicelluloses 1160 anti-symmetrical deformation of the C-O-C band
1150 Symmetric C-O-C and asymmetric stretch in cellulose in hemicellulose 1112 Aromatic C-H out-of-plane deformation C=O stretch
1087 C-O; C-C; -C-H stretch in alcohol in lignin
1056 C-O stretching of secondary alcohols
1024 C-O stretching in primary alcohols in cellulose
990 C-O stretching in cellulose
964 C-H out-of-plane deformation in lignin
939 Aromatic C-H out-of-plane deformations
895 C-H deformation of beta-glycosidic linkages in cellulose
871 C-H deformation of hemicellulose
860 C-H out of the plane in position 2, 5, and 6 of guaiacyl units
On the overall, the combination of NMR and FTIR analyses allows determining wood species by the identification of the microscopic characteristics on NMR images and, at the same time, achieving information about microstructure and preservation status through relaxometry measurements and FTIR spectra. Clear information about dynamics of water or other substances inside samples, such as archaeological waterlogged woods, can be obtained. Moreover, in the case of conservation treatments, it could be a useful tool to choose the most suitable consolidant product or to evaluate its penetration. Finally, we stress that both the considered techniques are non-invasive and non-destructive, which are the main important features for cultural heritage studies.
4. Conclusion
In this work, we have used NMR and FTIR experimental techniques in order to characterize the physical-chemical conditions of silver fir, with particular emphasis on the water contribution that is the principal responsible for degradation effects. The complementary use of NMR and FTIR techniques has allowed to perform a systematic study of the principal wood morphological/structural modifications (by NMR) associated with humification processes, such as changes of aromatic C-H and C-O vibration modes, presence of phenol groups as principal substituents and a reduction in oxygen-containing functional groups, principally carboxylic or carbonylic groups (by FTIR). Then, the synergic use of these techniques, probing the system energies on different scales, is an innovative approach, able to characterize the system under study in a complete way with the aim to prevent degradation effects and to improve its preservation over time. In particular, the amount and mobility of water with respect to
8
[3] Bao M, Huang X, Zhang Y, Yu W and Yu Y 2016 J. Wood Sci. 62(5) 441-451 [4] Stejskal E O and Tanner J E 1965 J. Chem. Phys. 42 288-292
[5] Pirazzoli I, Alesiani M, Capuani S, Maraviglia B, Giorgi R, Ridi F and Baglioni P 2005 Magn
Reson Imaging 23 (2) 277-284
[6] Alesiani M, Capuani S, Giorgi R, Maraviglia B, Pirazzoli I, Ridi F and Baglioni P 2004 J. Phys.
Chem. B 108 (15) 4869-4874
[7] Franceschi V R, Krokene P, Christiansen E and Krekling T 2005 New Phytol 167 (2) 353–375 [8] www.woodanatomy.ch
[9] Gezici-Koc Ö, Erich S J F, Huinink H P, Van der Ven L G J and Adan O C G 2017 Cellulose 24 535–553
[10] Topgaard D and Söderman O 2002 Cellulose 9 139–147 [11] Choong E T and Skaar C 1972 Wood Fiber Sci 2 80-86
[12] Ben Dhib K, Elaieb M T, Azzouz S and Elcafsi A 2016 Mater. Environ. Sci. 7 (7) 2561-2571 [13] Vartanian E, Barres O and Roque C 2015 Spectrochim Acta A 136 1255-1259