DOTTORATO DI RICERCA IN
SCIENZE DELLA TERRA
CICLO XXII
COORDINATORE Prof. Luigi Beccaluva
Petrological features of Subei Basin (Eastern China)
lithospheric mantle and their relationships
with H
2O contents in NAMs
Settore Scientifico Disciplinare GEO07/GEO08
Dottorando Tutore
Dott. Hao Yantao Prof. Coltorti Massimo
Co-Tutori Prof. Xia Qunke
I would like to thank my PhD advisors, Professor Massimo Coltorti, Professor Qunke Xia and Doctor Luigi Dallai, Not only they fully support me during the period of three years on my PhD academic work but also my living and study in Ferrara, Pisa and Hefei. Qunke is also my master advisor; he is my guide into the road of scientific research. The first time I met Luigi was when he is visited China and gave an excellent lecture at my previous university. He is the first foreigner with whom I have a long conversation with, not in mother language. When I saw the picture of Massimo for the website of the Department, the first thing into my sight was a big pipe and a kindly feeling. And it’s correct when I saw him in person. I thank all of them; from them I have learned not only how to make science but also how to be enthusiastic, energetic in the life.
I am also very grateful to Costanza Bonadiman, who spend lot of time on my thesis, discussion and correct the draft, as she said she spent so much time on my thesis even more than when she do her own. She is a funny advisor, her office always fill with laughing. I thank Barbara Faccini and Riccardo Boraso; they help me to solve lot of tiny but important troubles, from preparing rock powder, to filling the documents of different bureaucracy. I also thank Renzo Tassinari, the chief of our department laboratory, for helping me on the whole rock analysis and to discuss analyses of FeO contents.
I thank Xiaozhi Yang and Pei Li , they help me a lot with measurement in FTIR experiments; we had good period in discussing data. I thank Professor Rucheng Wang and researcher Wenlan Zhang in Nanjing University for EMPA. I thank professor Theodoros Ntaflos in Vienna University for the hospitality
Professor Zhi Xie and Zhenhui Hou in University of Science and Technology of China for their assistance in the experiments
I would like to thank my former roommate Tao Su and other Chinese students in Ferrara, we have spent a happy time, important when you study abroad in Italy.
I also thank my friends (too many to list here but you know who you are!) for providing the support and the friendship I needed.
I also thank my wife Yanqun Zhen, she give me the courage to face lonely and filled my heart with full love. I especially thank my mom and dad. My hard-working parents give me life and bring me up. They have sacrificed their lives for me; I thank all the things they do. I love them so much, and I would not have made it this far without them.
The Subei basin is located east of the Tanlu fault, a major discontinuity which separates the Archean North China Craton from the Proterozoic Yangtze Craton. South-West of the Tanlu fault the two cratonic blocks collided during Triassic time, originating the well-known UHP (Ultra-High Pressure) belt of Dabie Shan.
Central-eastern China experienced widespread basaltic volcanism during Cenozoic, probably related to extensive lithospheric thinning and mantle upwelling along weak zones of the Archean-Proterozoic lithospheric roots. This volcanism was particular intense in the Subei basin, where it included minor tholeiitic eruptions in the early Paleogene, and more extensive, xenolith-bearing alkali basalt activity in the Neogene. Three localities, Panshishan (PSS), Lianshan (LS) and Fangshan (FS), about 30 km apart, were sampled in the Subei basin and more than 60 peridotite xenoliths were collected. Volcanism in the last locality has been dated at about 9 Ma.
Most of the xenoliths are rounded and small to moderate in size (typically 5–10 cm in diameter), Most of the xenoliths are lherzolites ranging from highly fertile (16-23 vol% of clinopyroxene) to cpx-poor lherzolites (with cpx modal content of 6-9%), although few harzburgites, olivine-websterite and dunites are also found. No hydrous nor metasomatic secondary phases were observed. Textures vary from coarse-grained protogranular (~70% of total samples) through porphyroclastic (~20%) to equigranular (~10%) type. Rarely metasomatic textures, mainly spongy clinopyroxene, were observed.
Using two pyroxenes geothermometer (Brey and Kohler, 1990), Panshishan and Lianshan show quite low equilibrium temperature (T=816-1010℃), whereas Fangshan samples show temperature between 1011°C and 1208°C,
clinopyrossene, range between 12 to 25, 11 to 23 and 11 to 33 Kbar for Panshishan, Lianshan and Fangshan lherzolites, respectively. fO2 conditions
calculated for Panshishan and Fangshan samples range over four orders of magnitude from log fO2~ -4.12 to 0.25 FMQ and from 2.26 to -2.13 FMQ,
respectively; Lianshan samples present a more restricted range, with log fO2
from 0.55 to -2.4 FMQ.
FTIR analyses of nominally anhydrous minerals (NAMs) have been carried out for these xenoliths. Water content in olivines is very low; frequently it reaches the instrument detective limitation (less then 2ppm). Water content varies from 37 to 183 ppm for cpx and 13 to 74 ppm for opx. Fangshan xenoliths have the highest water content for both opx and cpx compare to other two localities, while Panshisan have the lowest water content in opx, leading to anomalously high DH2Ocpx/opx ratios.
Panshishan xenoliths show δ18O values ranging from 5.28 to 5.78 ‰ in olivine, 5.87 to 6.53 ‰ in opx, 5.18 to 6.15 ‰ in cpx, and 4.11 to 5.37 ‰ in sp. The results are similar to those reported by Yu et al. (2005), although these authors refer a broader range of δ18O values for ol, opx and cpx. In Lianshan xenoliths, δ18O values range from 5.42 to 5.96 ‰ in olivine, 6.01 to 6.67 ‰ in opx, 5.77 to 6.34 ‰ in cpx, and 4.52 to 5.58 ‰ in sp. In xenoliths from Fangshan δ18O values range from 5.12 to 6.32 ‰ in ol, 5.79 to 6.57 ‰ in opx, 5.33 to 6.31 ‰ in cpx, and 4.37 to 5.39 ‰ in sp.
and group IV samples has been strong modified during mantle metasomatic event/s.
Comparing water content of peridotite minerals (NAMs) with geochemical parameters, such as major and trace element compositions of minerals, melting index (i.e. Mg# value) for whole rock and minerals, oxygen isotopes, as well as physico-chemical parameters such as Temperature, Pressure and Oxygen Fugacity no correlation are envisaged. In conclusion, at least for the Subei Basin lithospheric mantle represented by xenoliths of Panshinshan, Linshan and Funshan water contents in NAMs are not related to the main depletion/enrichment processes occurring in the upper mantle, but it appears as an intrinsic (pristine?) feature of different mantle domains.
Il bacino di Subei si trova a est della faglia Tanlu, una discontinuità importante che separa il cratone Archeano della Cina del Nord dal Cratone Proterozoico di Yangtze. A sud-ovest della faglia Tanlu i due blocchi cratonici collidono durante il periodo Triassico, dando luogo alla nota UHP (Ultra-High Pressure) cintura del Dabie Shan.
Durante il Cenozoico la Cina centro-orientale vede un estensiva attività vulcanica, probabilmente correlata al vasto assottigliamento litosferico e alla risalita del mantello lungo le zone di debolezza delle radici litosferiche archeane-proterozoiche. Questa attività vulcanica è stata particolarmente intensa nel bacino Subei, includendo anche limitate eruzioni toleiitiche nel Paleogene inferiore, ed una cospiqua attività alcali-basaltica, ricca di xenoliti di mantello nel Neogene. Tre località noodulifere nel Subei Basin (Panshishan (PSS), Lianshan (LS) e Fangshan (FS)) tutte nl raggio di 30 km, sono state campionate per questa tesi e più di 60 noduli peridotitici sono stati raccolti. Il vulcanismo dell’ultima località è stato datato a circa 9 Ma.
La maggior parte degli xenoliti sono arrotondati e generalmente di dimensioni da centimetriche a decimetriche (5-10 centimetri di diametro). Questi sono principalmente lherzoliti (cpx modale 16-23%) e lherzoliti povere in cpx (cpx modale 6-9%); sono comunque presenti alcune harzburgiti, olivine-websterite e duniti. Non sono state rilevate fasi idrate, né fasi metasomatiche secondarie. La tessitura più frequente (~70% dei campioni
spongy.
Utilizzando il geotermometro a due pirosseni (Brey e Kohler, 1990), gli xenoliti di Panshishan e Lianshan registrano temperature di equilibrio relativamente basse (T = 816-1.010℃) per un mantello sublitosferico, mentre i noduli di Fangshan mediamente presentano temperature di equilibrio più alte tra i 1011 °C e 1208°C. Stime di pressioni, calcolate usando la distribuzione del Ca tra olivina e clinopyrosseno, variano rispettivamente da 12 a 25, da 11 a 23 e da 11 a 33 Kb in Panshishan, Lianshan and Fangshan.
I campioni di Panshishan e Fangshan mostrano un ampio range di valori di fO2 (fino a 4 ordini di grandezza), rispettivamente da ~ -4.12 a 0.25 FMQ e da
2.26 a -2.13 FMQ, mentre i campioni di Lianshan resigrano un range di fO2
molto più ristretto: da 0.55 a -2.4 FMQ.
Misure FTIR in minerali nominalmente anidri (NAMs) sull’intera campionatura di noduli, registrano contenuti d'acqua in olivina molto bassa vicina al limite di rivelabilità dello strumento (meno di 2 ppm). Il contenuto di acqua nei clinopirosseni varia da 37 a183 ppm mentre negli ortopirosseni varia da 13 a 74 ppm. Gli xenoliti di Fangshan hanno un contenuto di acqua superiore sia per cpx che per opx se confrontati con le altre due località, mentre gli xenoliti di Panshishan mostrano un contenuto in opx più basso a cui consegue un DH2Ocpx/opx anormalmente alto.
I noduli di Panshishan presentano δ18O che varia da 5.28 a 5.78 ‰ nell’olivina, da 5.87 a 6.53 ‰ nell’opx, da 5.18 a 6.15 ‰ per cpx e da 4.11 a 5.37 ‰ per sp. I risultati ottenuti sono simili a quelli riportati da Yu et al. (2005), anche se i noduli oggetto di questa tesi, mostrano un range più ristretto di δ18O per olivine e pirosseni. I noduli di Lianshan, presentano valori di δ18O
4.52-5.58 ‰ per sp. I noduli di Fangshan registrano δ18O che variano da 5.12-6.32 ‰ nell’olivina, da 5.79 a 6.57 ‰ nell’opx , da 5.33 a 6.31 ‰ nel cpx, e da 4.37 a 5.39 ‰ nello sp.
In base ai pattern di REE dei cpx, i 47 xenoliti analizzati sono stati suddivisi in cinque diversi gruppi. Gruppo I: con un pattern delle LREE impoverito; Gruppo II: con un pattern convesso verso l'alto; Gruppo III: con un pattern piatto di REE; Gruppo IV: con un pattern di LREE arricchito ed infine il Gruppo V: con un pattern di REE a cucchiao. I campioni del gruppo I possono essere modellizati per gradi di fusione parziale inferiore al 10% di un mantello primitivo, mentre i campioni del Gruppo IV riflettono composizioni di un mantello estensivamente modificato da processi metasomatici.
Confrontando il contenuto di acqua dei minerali peridotitici (NAMs) con i parametri geochimici, che includono gli elementi maggiori ed in traccia dei minerali, l’indici di fusione (i.e. Mg#) sia di roccia totale che di singoli minerali, e isotopi dell’ossigeno, unitamente a parametri fisico-chimici come Temperatura, Pressione e Fugacità di Ossigeno non è stata verificata nessuna correlazione. In conclusione si può affermare che, almeno per il mantello litosherico del Subei Basin rappresentato dagli xenoliti di Panshinshn, Linshan e Funshan, il contenuto d'acqua nel NAMS non sembra dipendere dai principali processi di impoverimento e di arricchimento che sono avvenuti nel mantello superiore. Questa tesi suggerisce invece che tale parametro possa essere una caratteristica intrinseca (primitiva?) dei diversi domini di mantello presenti
Table of Contents
Acknowledgements Abstract
Riassunto
Table of Contents ... ... ... ... ... ...i
List of Illustrations ... ... ... ii
List of Tables (in Appendixes) ………... ...v
Chapter 1 - Introduction and aim of the thesis ……….1
Chapter 2 - Geological setting and previous works ………..7
Chapter 3 - Analytical method …...………27
Chapter 4 – Petrography ………... …………38
Chapter 5 – Geochemistry ………..50
Chapter 6 – P-T estimate and oxygen fugacity estimates ………..……….111
Chapter 7 - Water content in opx and cpx………118
Chapter 8 - Discussion and conclusions………132
References ...………..168
List of Illustrations
<Chapter 2>
Fig. 2.1 - Simplified tectonic units of Eastern China and sample locality Fig. 2.2 - Schematic illustration of the thermo-tectonic evolution of
the lithospheric mantle beneath North China Craton (NCC) and related magmatism
Fig. 2.3 - Thermal (a) and tomography (b) structure of the upper mantle in eastern China
Fig. 2.4 - A 200Ma event history for the NCC
Fig. 2.5 - Crustal-detachment model for South China Craton (SCC) beneath Subei basin
Fig. 2.6 - Detailed map of sample locality and alkali basalt outcrops in the northern part of Jiangsu Province
Fig. 2.7 - 143Nd/144Nd vs 87Sr/86Sr for NE and SE China basalts Fig. 2.8 - Outline of the mantle source components for the late
Cenozoic basaltic rocks from East Asia <Chapter 3>
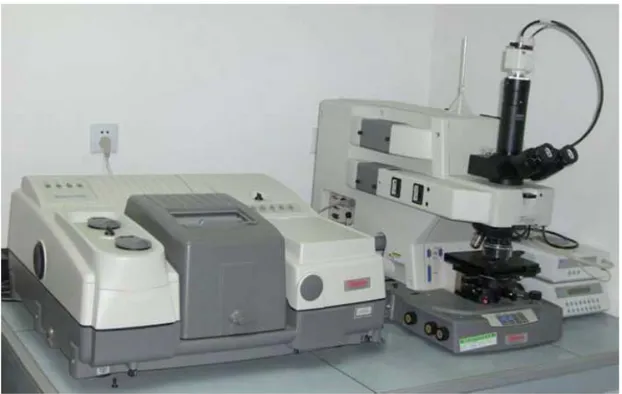
Fig. 3.1 - Picture of the Nicolet 5700 FTIR spectrometer coupled with a microscope
Fig. 3.2 - Absorption diagram of the Nicolet 5700 FTIR spectrometer Fig. 3.3 - Interference treatments from the instrumental absorption diagram <Chapter 4>
Fig. 4.1 - General pictures of sample localities
Fig. 4.2 - Pictures of xenoliths from Panshishan and Lianshan Fig. 4.3 - Textures in xenoliths from Subei basin
Fig. 4.4 – Petrographic classification for peridotite xenoliths from Subei basin <Chapter 5>
Fig. 5.4 – Whole-rock CaO vs Al2O3 (wt %) diagram
Fig. 5.5 - CaO and NiO in olivines vs Mg# diagrams Fig. 5.6 – Diagram of Mg# vs Cr# in spinels
Fig. 5.7 - SiO2, TiO2, Al2O3, Cr2O3, and Na2O in orthopyroxene vs
Mg# diagrams
Fig. 5.8 - TiO2, Al2O3, Cr2O3, CaO and Na2O in clinopyroxene vs
Mg# diagrams
Fig. 5.9 - REE and trace element patterns of clinopyroxenes from peridotite xenoliths from Panshishan
Fig. 5.10 - REE and trace element patterns of clinopyroxenes from peridotite xenoliths from Lianshan
Fig. 5.11 - REE and trace element patterns of clinopyroxenes from peridotite xenoliths from Fangshan
Fig. 5.12 - Simplified REE pattern with (La/Sm)N vs (Sm/Yb)N of
Subei basin clinopyroxenes
Fig. 5.13 - Oxygen isotope composition for olivine, orthopyroxene and clinopyroxene in xenoliths from Subei basin <Chapter 6>
Fig. 6.1 - Pressure vs equilibrium temperature of Subei basin xenoliths
Fig. 6.2 - Oxygen fugacity vs equilibrium temperature of Subei basin xenoliths Fig. 6.3 - Oxygen fugacity vs Pressure of Subei basin xenoliths
<Chapter 7>
Fig. 7.1 - Representative IR spectra for cpx and opx in Panshishan peridotite xenolith
Fig. 7.2 - Representative IR spectra for cpx and opx in Lianshan peridotite xenolith
Fig. 7.3 - Representative IR spectra for cpx and opx in Fangshan peridotite xenolith
Fig. 7.4 - Representative IR spectra for ol in Panshishan peridotite xenolith Fig. 7.5 - Profile analyses of H absorption in Lianshan opx
Fig. 7.6 - Water contents of cpx and opx in Panshishan, Lianshan and Fangshan xenoliths and NCC peridotite
<Chapter 8>
Fig. 8.1 – Melting modelling using both batch and fractional melting in spinel facies
Fig. 8.2 - Melting modelling using both batch and fractional melting in garnet facies
Fig. 8.3 - Modelling of REE patterns in spinel facies for clinopyroxenes from Subei basin xenoliths
Fig. 8.4 - Modelling of REE patterns in garnet facies for clinopyroxenes from Subei basin xenoliths
Fig. 8.5 - Melting modelling in garnet facies and re-equilibration in spinel facies
Fig. 8.6 - Modelling of REE patterns in garnet facies for Group II cpx Fig. 8.7 - Batch and fractional melting models for Zr and Sr contents
in clinopyroxenes from Subei basin
Fig. 8.8 – Inferred metasomatic melts in equilibrium with Group IV cpx Fig. 8.9 - (La/Yb)N vs Ti/Eu ratios of clinopyroxene from
Subei basin xenoliths
Fig. 8.10 - Correlation between H2O (ppm) and Al2O3 (%) in peridotite opx
Fig. 8.11 - MgO (wt %) versus (a) orthopyroxene and (b) clinopyroxene H2O
content
Fig. 8.12 – (Ce)N, (Yb)N and (La/Yb)N versus clinopyroxene H2O content
Fig. 8.13 - Opx H2O content (a) and cpx H2O content (b) versus ΔFMQ
Fig. 8.14 - Cpx H2O content versus δ18O
Fig. 8.15 - Comparison of H2O content of cpx, opx and whole rock of the NCC
List of Tables (in Appendixes)
Table 2.1 - Mineral mode of Panshishan, Lianshan and Fangshan peridotite xenoliths
Table 5.1 - Whole rock composition of peridotite xenoliths from Subei basin Table 5.2 - Olivine major element compositions in peridotite xenoliths from Subei basin
Table 5.3 - Orthopyroxene major element compositions in peridotite xenoliths from Subei basin
Table 5.4 - Clinopyroxene major element compositions in peridotite xenoliths from Subei basin
Table 5.5 - Spinel major element compositions in peridotite xenoliths from Subei basin
Table 5.6 - Clinopyroxene trace element analyses in peridotite xenoliths from Subei basin
Table 5.7 - Oxygen isotopic analyses of xenoliths form Subei basin
Table 6.1 - Temperature, Pressure and Oxygen fugacity estimates of peridotite xenoliths from Subei basin
Table 7.1 -Minerals and bulk rock water content of peridotite xenoliths from Subei basin
Table 8.1 -Xenolith phase modal proportions (vol %) used in the models Table 8.2 - Crystal/Liquid partition coefficients for modeling calculations Table 8.3 - Primitive mantle source and starting bulk composition (ppm) in spinel and garnet facies
Chapter 1 - Introduction and aim of the thesis
Mantle xenoliths
Until now it is difficult to access directly and get the information on the composition and evolution of the deeper part of the lithosphere, i.e. the lower crustal and upper mantle layers. Mantle-derived xenoliths provide a good chance to understand the nature of the mantle. Xenoliths can be transported by magma to the Earth’s surface when volcano erupts. As the magma rise from its source (upper mantle) to the surface in a very short time (just few days or even few hours) the xenoliths represent almost a “quenched” product and most source information could be kept. Peridotite is the dominant rock of the upper part of the Earth's mantle. It is a dense, coarse-grained rock, consisting mostly of the minerals olivine (ol), orthopyroxene (opx), clinopyroxene (cpx), spinel (sp) and/or garnet (grt) and representing, in most cases, the residues of partial melting after the extraction of basaltic melts (e.g. Salters and Stracke, 2004; Workman and Hart, 2005). A system study of the peridotite xenoliths can make us better understanding the composition, structure, physical and chemical features of the upper mantle, to learn the past, now and even the future of our Earth.
Water in nominally anhydrous minerals
Knowledge of the amount of water, or hydrogen species, inside the earth at present, and in the past, is a critical issue for understanding the petrological,
well-known fact that water, even in trace amounts, has a strong influence on many chemical and physical properties of its host silicate minerals/rocks, including mechanical and rheological strength (e.g. Griggs, 1967; Kronenberg et al., 1986; Hirth and Kohlstedt, 1996), rate of ionic diffusion (Goldsmith, 1987; Elphick et al., 1988), melting behavior (Kushiro, 1972; Arndt et al., 1998) and electrical conductivity (Karato, 1990); and, if extracted from minerals, it contributes to the formation of ore deposits and hydrous fluids, and even to the triggering of deep-seated earthquakes (Meade and Jeanloz, 1991). After the Griggs and Blacic (1965) and Martin and Donnay (1972) pioneering works and the early speculations of Fyfe (1970) – later reviewed by Ackermann et al. (1983) – who stated that OH-bearing anhydrous minerals might be a significant reservoir for water in the Earth’s mantle, it has been gradually and widely accepted that nominally anhydrous minerals can commonly contain few to several thousand ppm of water (H2O by weight) in their lattice, predominated
by OH and/or less molecular H2O, and are the main hydrogen reservoir in the
deep earth, especially in the upper mantle (Bell and Rossman, 1992a; Ingrin and Skogby, 2000; Bolfan-Casanova, 2005). Such water may play crucial but diversified roles on many properties and processes in the earth (e.g. Williams and Hemley, 2001; Keppler and Smyth, 2006). Recent works on quartz, garnet and igneous feldspars in the upper and middle crust demonstrate that they contain more than ~ 1200 ppm H2O as dispersed, structurally bound OH
groups, molecular H2O and/or NH4+ (Kronenberg, 1994; Johnson and Rossman,
2003, 2004). The upper mantle is dominated by ol, cpx and opx, so these nominally anhydrous minerals in principle can also incorporate some water/hydroxyl in them. A thorough investigation about water in peridotite xenoliths coupled with other geophysics/geochemistry information is therefore
necessary for a better understanding of the whole Earth system. Fourier transform infrared (FTIR) absorption spectroscopy is a highly sensitive, site-specific, high resolution (down to 20 μm), and non-destructive in situ method for the study of OH and molecular H2O in minerals. It can provide
quantitative determination of the amount of structurally incorporated water and OH in the target minerals, although depending on the experimentally-calibrated absorption coefficients for given phases. (Rossman, 1996)
Oxygen isotopes
Oxygen is the most abundant element in silicate rock-forming minerals. Oxygen isotope composition of mantle may have been affected by processes such as removal or addition of melt and fluids, or the recycling of crustal component at subduction zones. Oxygen isotopes of mantle xenoliths have the potential to make important contributions to identify this heterogeneity. Importantly, the stable isotopes 18O and 16O are strongly fractionated in the low temperature geochemical environments prevailing at the Earth's surface. Therefore, tectonic processes that return to the mantle material that has at one time resided in surface or near-surface environments should provide an effective means of introducing oxygen of variable isotopic composition into the upper mantle.
Aim of this work
thus representing the most complete studies of the area developed so far. The main aim of the work is to highlight the relationships between petrological features of the mantle peridotite and its water content.
Structure of this study
This thesis is subdivided into 8 chapters, starting with the general introduction presented here, followed by other Chapters.
Chapter 2 gives a brief introduction to the geological setting of the North China Craton and Dabie Shan-Sulu UHP (Ultra-High Pressure) belt with some available geological, tectonic, petrological, dynamic and chronological data. Then a summary of the previous works that have done in the Subei basin is reported.
Chapter 3 describes details of analytical methods which include whole-rock analysis by XRF, major and trace element contents in minerals obtained by EMPA and LA-ICP-MS, water content in NAMs acquired by FTIR and minerals oxygen isotopic composition using laser fluorination technology.
Chapter 4 gives a petrological picture of xenoliths from the three sampling localities, Panshishan, Lianshan and Fangshan in Subei basin. Textures of hand speciments and thin sections are described. Petrological classification for rock type is applied for xenoliths by mineral mode content estimates by more than 1600 points counting.
Chapter 5 shows the geochemistry of the sample, including major and trace element content for both whole rock and the four mineral phases (ol, opx, cpx and sp). Based on the pattern and distribution of rare earth elements, xenoliths have been divided into five groups: Group I, with LREE-depleted pattern; Group II, with upward convex pattern, Group III, with flat REE pattern; Group IV, with LREE-enriched pattern; and Group V, with spoon-shape pattern. At the end of the chapter, we report the oxygen isotopic composition of all the four minerals phases in the xenoliths.
After the discussion of single mineral major elements, in Chapter 6 equilibrium temperature, pressure and redox state of the Subei Basin mantle domain are determined.
Chapter 7 reports the results from the FTIR experiments for NAMs water contents. H species are confirmed in the spectra. Water contents for opx and cpx are calculated by integrating the absorption areas and whole rock water contents are evaluated.
Chapter 8 deals with the discussion. It is divided in: a) modelling depletion and enrichment processes that affect the sampled xenoliths; b) evaluating the possible relationships between petrological features of the Subei basin mantle and its water content; c) making comparison between NAMs water contents of minerals and whole rock with other localities.
measurement for trace element by LA-ICP-MS. Some related publications are listed at the end of appendix.
Chapter 2 - Geologic setting and previous works
Geologic setting and sample localities
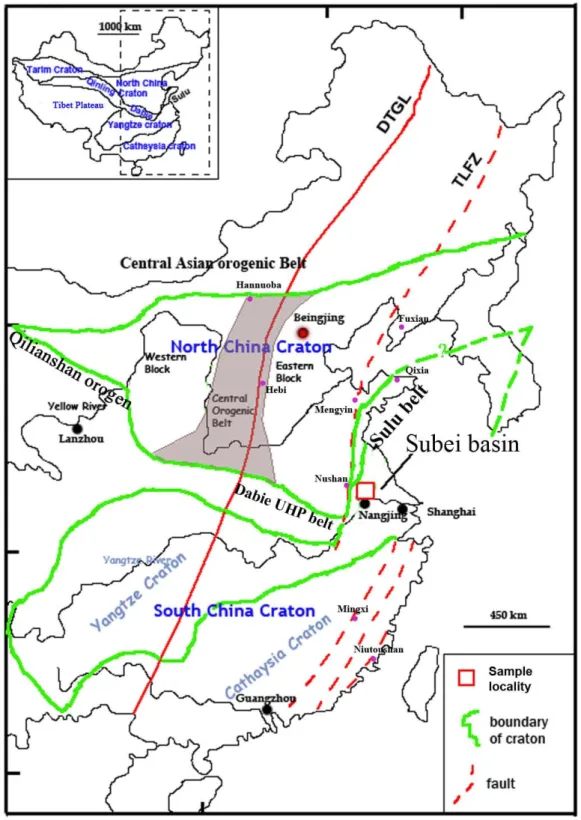
The North China Craton (NCC) is the Chinese part of the Sino-Korean Craton (SKC), named the North China Block in some literature. It is one of the most ancient cratons on the Earth, composed of early Archean and Proterozoic metamorphic rocks with the oldest recorded crustal ages >3.8 Ga (e.g. Liu et al., 1992), and is the largest craton in China, covering an area >1,700,000 km2. It is separated from the Mongolian Block by the eastern Central Asian Orogenic Belt in the north, and from the Yangtze Craton, part of the South China Craton, by the Triassic Dabie Shan-Sulu UHP belt in the south and east (Fig. 2.1). In the west, it is separated from Tarim Craton by the Qilianshan Orogen. The NCC is crosscut by two large-scale geophysical and geological linear zones. In the west, it is cut by the NS trending Daxing’anling-Taihangshan Gravity Lineament (DTGL) (equiv. North–South Gravity Lineament (NSGL), which separates two topographically and tectonically different regions and probably related to the diachronous lithospheric thinning of the craton (Ma, 1989; Xu, 2007). In the east, it is traversed by the Tan-Lu Fault Zone (TLFZ), which is associated with significant Cenozoic and Mesozoic volcanism.
Based on the lithological assemblage, tectonic evolution and P-T-t paths of metamorphic rocks, the North China Craton can be divided into the Western and Eastern Blocks, separated by the central Orogenic Belt (equiv. Trans-North
Fig. 2.1 - Simplified tectonic units of Eastern China and sample locality. (modified after Zhang et al., 2008)
The Western Block is composed of late Archean to early Proterozoic metasedimentary belts that unconformable overlie the Archean basement; the latter consists mainly of granulite facies gneiss and charnockite with small amounts of mafic granulites and amphibolites. The basement of the central Orogenic Belt consist of late Archean amphibolites and granulites, and 2.5 Ga granite-greenstone terrains, overlaid by 2.4-2.2 Ga bimodal volcanic rocks in the southern region and thick carbonate and terrigenous sedimentary rocks interlayered with thin basalt flows in the central region. The Eastern Block consists mainly of 3.5-2.5 Ga orthogneisses (dominated by tonalitic, trondhjemitic and granodioritic gneisses (TTGs)), 2.5 Ga granitoids and less amounts of ultramafic to mafic volcanics and sedimentary supracrustal rocks including banded iron formations. The collision between the Western and Eastern blocks may have led to the formation of the Central Orogenic Belt and represent the final amalgamation of the North China Craton. There are contrasting views regarding the timing of the collision between the Eastern and Western Blocks. Multi-grain zircon U-Pb age populations from TTG gneisses of the Central Orogenic Belt have upper intercept of 2.5-2.7 Ga and lower intercept of 1.8-2.0 Ga. These younger ages are consistent with Sm-Nd ages of garnets from the high-pressure granulites in this belt and 40Ar/30Ar ages of hornblendes in amphibolites and biotites in TTGs, along with SHRIMP zircon rim ages of the TTGs and supracrustal rocks (Zhao et al., 2000, 2001). The age of 1.8-2.0 Ga are interpreted as the age of metamorphic overgrowth. These, as
Belt was reported by Kusky et al., (2001). It implies a much older collisional event between these two blocks. Li et al. (2000; 2001) suggested a model that combines all these observations and assumes that collision occurred between the two blocks at ~2.5 Ga followed by rifting during the 2.3-2.4 Ga with subsequent collision at 1.8-2.0 Ga representing the final amalgamation/cratonization event.
The Dabie Shan-Sulu UHP belt lies between the North and South China Cratons, extending from east to west for ca. 2000 km in the central-eastern China (Fig. 2.1). It is separated into two terrenes by about 500 km of left-lateral strike-slip displacement along the TLFZ. The Sulu terrain in the east is segmented into a number of blocks by several NE-SW trending faults sub parallel to the TLFZ, and the Dabie Shan terrain in the west is the major segment bounded by the TLFZ to the east and separated into a series of continuous zones by several EW-trending faults of large scales. The formation of the Dabie Shan-Sulu UHP belt occurred mainly in the Triassic, caused by collision between the North China and Yangtze Cratons with peak metamorphism at ~ 245 Ma (Hacker et al., 1998). The basement of the Dabie Shan-Sulu UHP terranes is constituted by metamorphic rocks, such as schists, greenstones, gneisses, and rare quartzites, marbles, granulites, and eclogites, intruded by granitoids. The occurrence of eclogites first suggests that pressures of metamorphism were high. Discovery of coesite, diamond, and extreme
18O-depletion, as well as exsolution of clinopyroxene in orthopyroxene, rutile
and apatite, in eclogites (e.g. Okay et al., 1989; Wang et al., 1989; Yui et al., 1995; Zheng et al., 1996; Ye et al., 2000) demonstrates that deep subduction of continental crust to the depths of about 200 km and the subsequent quick exhumation (see also a review by Zheng et al., 2003 and references therein) of
eclogites in Central Dabie Shan and the granulites in North Dabie Shan (after Zheng et al., 2003) occurred.
The NCC experienced widespread tectonothermal reactivation, beginning from the early Paleozoic but occurring mainly during the late Mesozoic and Cenozoic, as manifested by the emplacement of early Paleozoic kimberlites, voluminous late Mesozoic basaltic rocks and granites and Cenozoic alkali basalts (Fan et al., 2000; Zhang et al., 2002; Yang et al., 2003; Zhang et al., 2004; Wu et al., 2005). The NCC also experienced development of extensive sedimentary basins (most of the eastern portion of the craton is covered by Quaternary sediments) and presently has higher heat flow (60 mW/m2: Hu et al., 2000) compared to other Archean and Proterozoic cratons (Nyblade et al., 1990; Jaupart and Mareschal, 2003). The changes in tectonic/magmatic activity are also reflected in a change in the type and composition of mantle xenoliths. Xenoliths carried in Ordovician kimberlites are deep-seated garnet-facies peridotites. These highly refractory xenoliths, together with the appearance of diamonds in the kimberlites, indicate a typical ancient cratonic lithospheric mantle which was thick (ca. 200 km) and cold (geotherm ca. 40mW/m2) at least up to mid-Ordovician time (Wu et al., 2005; Zhang et al., 2008). By contrast, xenoliths hosted in late Cretaceous and Cenozoic basalts are dominated by fertile spinel peridotites, which record shallower (60-100 km) and hotter (mean geotherm ca. 80 mW/m2) lithospheric mantle (Fan and Hooper, 1989; Xu et al., 1998; Zheng et al., 1998, 2001, 2006; Fan et al., 2000; Rudnick et al., 2004; Reisberg et al., 2005; Ying et al., 2006), in good
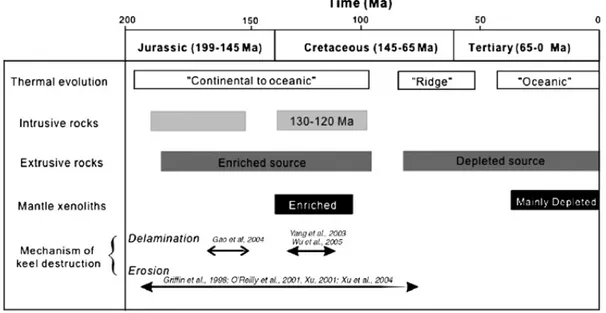
Cenozoic time (Menzies et al., 1993, 2007; Griffin et al., 1998; Xu, 2001, 2008b; Zheng et al., 2001, 2006; Gao et al., 2002, 2004, 2008; Zhang et al., 2002, 2005, 2008, 2009; Wu et al., 2003, 2005). Xu (2001) show a thermo-tectonic evolution of the lithospheric mantle beneath North China Craton and related magmatism (Fig. 2.2).
(a) Paleozoic. A thick lithospheric keel existed under the NCC and extended into the diamond stability field. A metasome horizon was formed at 80 to 120 km through repeated infiltration of small melt batches derived from the convective asthenosphere (Menzies et al., 1993). The lithosphere was cold corresponding to ~40 mW/m2.
(b) Jurassic to early Cretaceous. The low-temperature melting components in metasome zones were reactivated due to thermal perturbation associated with initial lithospheric erosion. These magmas show enriched mantle components.
(c) 90 to 80 Ma. Magmatism during this period was absent. The SCLM was essentially dry due to the exhaustion of fusible components during precedent magmatism. The solidus of dry peridotites was not intercepted by the thermal gradient.
(d) Early Tertiary. The lithosphere was significantly thinned (< 60 km) as a result of lithospheric extension and associated asthenospheric upwelling. The thermal gradient was as high as ~90 mW/m2. The magmatism is mainly tholeiites (TH) and subalkali basalts (OB+AOB)
with minor alkali basalt. The depleted mantle source involved in these rocks suggests that lithosphere erosion may have been accomplished by the end of the Cretaceous.
(e) Present. The lithosphere thickens (> 70 km) since the Miocene subsequent to the lowering of the LAB as a result of thermal decay (~ 65 mW/m2). The declining in the partial melting
degrees and the increase in the depth of partial melting result in the formation of alkali- and strongly alkaline basalts (ALK+BA+NE). New lithosphere was accreted below the old keel remnants. This lithostratigraphy is believed to vary from west to east with relics of the old keel being more important in the western part of the craton.
The lithospheric thinning in eastern China is a warmly and widely discussed topic in the last decade (Fan and Menzies, 1992; Menzies et al., 1993; Griffin et al., 1998; Menzies and Xu, 1998; Menzies et al., 2007). It is not clear, in fact, the scale, mechanism and timing, as well as tectonic controlling factors, of this geodynamical process. The scale for the lithospheric thinning involves both its spatial and vertical distribution, which indicates how wide and how thick the lithosphere has been removed, respectively. There is at present a general consensus that the NCC has experienced significant lithospheric thinning, especially in its eastern domain. Recent studies show that, not only the NCC, but also the north-east and south-east China are characterized by rather thin lithosphere relative to other ancient cratons on the Earth (Xu et al., 2000; Zou,
2001; Xu, 2002; Wu et al., 2003). Based on these works, it seems that the entire eastern China, to the east of the DTGL, has experienced lithospheric thinning. This can be further supported by the thermal structure (Fig. 2.3a; He et al., 2001) and seismic tomography (Fig. 2.3b; Priestley et al., 2006) of the upper mantle below eastern China. The issue for the vertical thinning involves the removal of the lithospheric mantle only or both the lower crust and the whole lithospheric mantle, which is still under debate (Menzies et al., 1993; Griffin et al., 1998; Menzies and Xu, 1998; Zheng, 1999; Xu, 2001; Wu et al., 2003; Gao et al., 2004; Xu et al., 2004; Menzies et al., 2007).
Fig. 2.3 - Thermal (a) and tomography (b) structure of the upper mantle in eastern China. (after He et al., 2001 and Priestley et al., 2006, respectively)
studies are largely concentrated on the eastern NCC. Various mechanisms have been proposed to explain this process below the NCC, the most prevailing are: (1) Delamination in a short period (Yang et al., 2003; Gao et al., 2004). Yang et al. (2003) suggested that lithospheric delamination took place primarily in the early Cretaceous, based on the evidence for widespread crustal melting during 130-110 Ma which would require thinning of the lithosphere. By contrast, Gao et al. (2004) argued for Jurassic delamination of the lower crust, based on their discovery that Jurassic andesites, dacites and adakites from Xinglonggou (north NCC, Western Liaoning Province) have chemical signatures consistent with their derivation as partial melts of eclogites that interacted with mantle peridotite; in this case, they proposed that lithospheric thinning had reached such a stage by the late Jurassic that lower crustal rocks could be delaminated, converted to eclogites, incorporated into the convecting mantle and melted. The latter model, however, is difficult to reconcile with the fact that mafic and felsic Mesozoic magmatism peaked in the early Cretaceous (Yang et al., 2003; Xu et al., 2004; Wu et al., 2005) rather than the Jurassic; furthermore, rapid delamination is clearly at odds with the protracted Mesozoic magmatism (~100 Ma) in the NCC (e.g. Xu et al., 2004), and it is not easy to explain satisfactorily the linear thinning along the whole east China (Fig. 2.3a, Fig.2.3b).
(2) Thermal-mechanical erosion (e.g. Griffin et al., 1998; Xu, 2001). Within this scheme, lithospheric thinning proceeded by heat transport into the lithosphere and small-scale asthenospheric convection induced by extension. Once lithospheric mantle is thermally converted to asthenosphere, it can convectively mix with, and eventually be replaced by, asthenosphere (Davis, 1994). A recent hypothesis suggests that the lithospheric thinning has been
initiated with hydration which weakened the base of the old lithospheric mantle and transformed it into the convective asthenosphere. The water required for such a process may come from the dehydration of the subducted Paleo-Pacific lithosphere that lies horizontally in the 410-660 km transition zone beneath eastern China. The westward subduction of the Pacific plate caused an accumulation of eclogitic material above the 670 discontinuity with may coincide with the surface position of the DTGL as it has been recently observed by high-resolution seismic tomography (Huang and Zhao, 2006). Furthermore, the subduction may also explain the Bouguer gravity anomaly in eastern China and the formation of the DTGL in the early Cretaceous (e.g. Niu, 2005; Xu, 2007).
Although the lithospheric thinning in east China has been well recognized for more than a decade, debate continues on the time-scale of such destruction, especially in terms of its beginning, peak-period and ending. This, however, relies fundamentally, or at least in part, on the understanding of how the lithosphere keel could be removed. A short time interval of only 10-20 Ma, or even less, for delamination-induced thinning (Yang et al., 2003; Gao et al., 2004) is in strong contrast to that of over 100 Ma for erosion-induced thinning (Griffin et al., 1998; Xu, 2001; Xu et al., 2004). Some relevant geological, geochemical and geophysical data on a 200 Ma time scale for the NCC is summarized by Menzies et al. (2007) (Fig. 2.4) so that these events can be cross-correlated. The presence of mantle derived plutonic rocks around 180-190 Ma is believed to mark the reactivation of the cratonic lithosphere, the
Fig. 2.4 - A 200Ma event history for the NCC (after Menzies et al., 2007). Thermal evolution “Continental to oceanic” geotherms based on basalt- and kimberlite-borne xenoliths and surface heat flow measurements. Note the temporal change that peaks in the Cenozoic.
Intrusive rocks have a magmatic peak at 130–120Ma. Effusive rocks with a temporal change in mantle source from enriched to depleted largely inferred from Sr–Nd isotope variation (Xu, 2004). Mantle xenoliths primarily found in Cenozoic volcanic rocks with a characteristic “depleted” isotopic signature ( Xu et al., 1998). The timescale of keel delamination and lithospheric thinning is debated by Gao et al.(2004), Yang et al.(2003), Wu et al.(2005) suggest it occurred within a 10Ma, whereas Griffin et al.(1998), O’Reilly et al.(2001), Xu et al.(2004) believe it can occur over a period of 100Ma.
Previous petrological work in the studied area
Subei basin is located at the south edge of NCC (Fig. 2.1), east of the TLFZ in east central China. This region is marked by the Triassic collision of NCC and the Yangtze Craton. West of the Tanlu fault, the collision zone is defined by the Dabie Shan UHP belt, but the location of the suture east of the fault is debated. The resemblance of petrologic and structural features between the Sulu and the Dabie Shan UHP belts may imply that the suture lies beneath or slightly north of the Sulu terrain. In this case the mantle lithosphere beneath the
Subei basin would belong to the Yangtze Craton. However, Li (1994) proposed a crustal-detachment model, based on the interpretation of linear aeromagnetic anomalies, surface geological observations, and deep seismic profiles. The model shows that during the mid-Mesozoic collision between the two continental blocks, the upper crust of the South China Craton (SCC, composed of the Yangtze Craton and the Cathaysia Craton) in the Subei-Yellow Sea region was detached from the lower crust and thrust over the NCC for more than 400 km, whereas the lower part of the lithosphere was subducted under the NCC along a subsurface suture running east of Nanjing (Fig. 2.5). Chung (1999) studied the trace element and isotope characteristics of Cenozoic basalts in Subei Basin and Shandong Province around Tanlu fault and inferred the same plate boundary between the NCC and SCC. The samples studied here come from just north of the proposed subsurface suture.
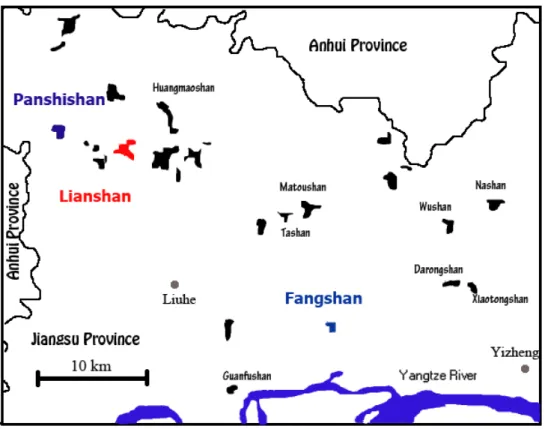
Fig. 2.6 - Detail map of sample locality and alkali basalt outcrops in the northern part of Jiangsu Province (modified after Zhi, 1991)
East central China experienced widespread Cenozoic basaltic volcanism, probably directly or indirectly related to the lithospheric thinning. This volcanism was particularly intense in the Subei basin, where it includes minor tholeiitic eruptions in the early Paleogene, and more extensive, xenolith-bearing alkali basalt activity in the Neogene (Fig. 2.6). Several works were carried out in the Subei basin area on both basalts and xenoliths.
A K-Ar ages and Sr, Pb isotopic characteristics of some Cenozoic volcanic rocks from Anhui and Jiangsu province were reported by early work of Chen and Peng (1988), According to this work the volcanism of Fangshan has been
dated at about 9 Ma, while Tashan, about 10km north Fangshan, has an age of 18Ma.
Sun et al. (1998) show that 187Os/ 188Os ratios for spinel lherzolite xenoliths from Panshishan range from 0.1241 to 0.1294. Most of them are lower than that of the primitive mantle (0.1290±9), suggesting that these xenoliths have slightly unradiogenic Os isotopic features. This result is concordant with the Sr and Nd isotopic characteristic in Panshishan reported by Chen and Wang (1994).
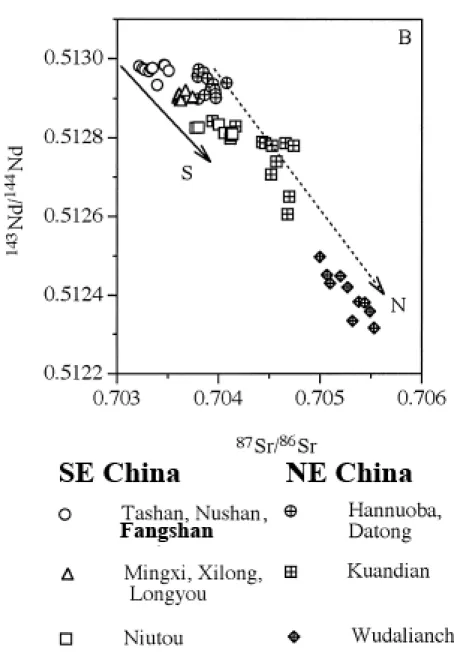
Zou et al. (2000) measured major, trace element, and Nd–Sr–Pb isotopic compositions of mantle xenolith-bearing Cenozoic basalts in southeastern China. Just two samples from Fangshan, and compared their results with those on NCC (Hannuoba, Datong, Kuandian, and Wudalianchi, Song et al., 1990; Basu et al., 1991; Zhang et al., 1991, 1995; Liu et al., 1992.). From Subei basin they found an increase in 87Sr/86Sr and a decrease in 143Nd/144Nd moving both Northward (Hannuoba, Datong, Kuandian, and Wudalianchi) and Southward (Mingxi, Xionglong, Longyou and Niutuo, Zou et al. 2000) (Fig. 2.7). They suggest that southeast China basalts result from a mixing between an asthenospheric mantle and an EM2 component, whereas the northeast China basalts reflect a mixing between an asthenospheric mantle and an EM1 component. The basalts in central-eastern China Nushan, Fangshan, and Tashan have the highest 143Nd/144Nd and the lowest 87Sr/86Sr and may represent the isotopic composition of the asthenospheric mantle (Fig. 2.8).
Fig. 2.8 - Outline of the mantle source components for the late Cenozoic basaltic rocks from East Asia (DMM = depleted mantle, EM1 and EM2 = enriched mantle type 1 and type 2, respectively). Distribution of the basalts and locations of mantle-derived xenoliths are after Hoang et al. (1996), Zou et al. (2000), and Choi et al. (2005). Tectonic boundaries between the North China Craton and the South China Block in South Korea are after Ree et al. (1996) and Chough et al. (2000). Xenolith Locations: 1 = Hainan Island, 2 = Niutoushan, 3 = Mingxi, 4 = Longyou and Xilong, 5 = Fangshan and Tashan, 6 = Nushan, 7 = Kuandian, 8 = Hannuoba, 9 = Erkeshan, Keluo, Nuominhe, Wudalianchi and Xiaogulihe.
Reisberg et al. (2005) have determined the whole-rock Os isotopic compositions and Re and Os concentrations for the ultramafic xenoliths from the Subei Basin (Panshishan, Lianshan and Fangshan). Re–Os analyses were coupled with whole rock major and trace element and S abundance determinations, and with characterization of rock textures, modal phase proportions and sulfide petrography. The two main sampling areas, Panshishan (eight xenoliths) and Lianshan (eighteen xenoliths) have similar textures and major and moderately incompatible lithophile trace element compositions. They show that Os isotopic ratios are related to Yb, thus suggesting an ancient melt extraction process which depleted the rocks in Re. These Os isotopic systematic suggest that both areas were affected by an early Proterozoic (~1.8 Ga) melt extraction event. Thus the two areas apparently shared the same long term lithospheric history. Nevertheless, the sulfide abundances and whole rock S, Os and Re concentrations are strikingly lower in Lianshan than in Panshishan, and the two localities have different incompatible lithophile trace element signatures. These differences resulted from contrasting melt percolation styles between the two areas. Panshishan experienced interaction with S-saturated possibly evolved melts that added Re, Cu and S, but had no affect on Os abundances, while Lianshan was affected by extensive percolation of sulfur undersaturated melts that removed Re, Os and S. On the basis of lack of correlation between 187Os/188Os and 187Re/188Os, compared with the good correlation between 187Os/188Os and Yb, they speculated that the perturbation of the Re and Os concentrations was fairly recent, and perhaps related to Mesozoic or Cenozoic lithospheric thinning in eastern China.
On the other hand Xu et al.(2008a) obtained in situ Re–Os isotopic data for sulfide grains in mantle-derived peridotite xenoliths from Panshishan and
Tashan in Subei basin, They use TRD (Time of Re depletion model ages, which
assume that all Re was depleted at the time of melting; these ages are more robust indications of the minimum age of melt depletion; Walker et al., 1989; Pearson et al., 1995a,b) and found that the sulfide populations in xenoliths from this area are dominated by grains that yield Neoproterozoic to Mesozoic ages. Archean ages are not recorded. The integration of sulfide and whole-rock Re–Os data suggests that the oldest part of the lithospheric mantle sampled beneath Subei basin may be Paleoproterozoic in age, and has been modified in Mesoproterozoic and Phanerozoic time.
For stable isotope, Zhi et al. (1996) use a conventional BrF5 method for
Oxygen isotope composition of mantle-derived materials from Anhui-Jiangsu basalt, while Li et al. (1999) measure oxygen isotope by the laser probe technique on mineral separates from mantle xenolith and megacryst in Cenozoic basalts, East China. Two samples from Panshishan are included. One δ18O value of 4.97 for Ol was obtained, and δ18O values are 5.67 and 5.25 for opx and 5.50 and 5.80 for cpx.
Yu et al. (2005) collected eight peridotite xenoliths from Panshishan, using ICP-MS measured trace elements of clinopyroxenes and systematic oxygen composition for ol, opx and cpx were measured using laser fluorination technology. The oxygen composition of minerals falls in the “normal” mantle range and achieved equilibrium between them. Clinopyroxene enrichment in incompatible elements indicates that some samples experienced a cryptic metasomatism.
on Os isotope, Reisberg et al. (2005) on whole rock Re-Os and Xu et al. (2008a) on sulfides Re-Os, Li et al. (1999) and Yu et al. (2005) on oxygen isotope.
Chapter 3 - Analytical method
In this chapter, analytical method are described in detail. They include: whole rock major and trace elements obtained by XRF, in situ mineral major element measurements with electron microprobe (EMP), in situ mineral trace elements analysis with LA-ICPMS, in situ water contents of minerals using FTIR instrument, and oxygen isotopic ratios determination using a laser fluorination method.
Whole rock - XRF
Whole rock X-ray Florescence (XRF) analyses were carried out at the Department of Earth Science, University of Ferrara, on a Philips PW 1400 spectrometer using standard procedures (Franzini et al., 1975; Leoni and Saitta, 1976). Fresh parts of xenoliths were selected, crashed and powdered. In order to keep the geometry of the tube-sample-detector assembly constant, the sample is normally prepared as a 1 cm thick disc, typically 50 mm in diameter. This is located at a standardized, small distance from the tube window. Because the X-ray intensity follows an inverse-square law, the tolerances for this placement and for the flatness of the surface must be very tight in order to maintain a repeatable X-ray flux. A further reason for obtaining a flat and representative sample surface is that the secondary X-rays from lighter elements often only emit from the top few micrometers of the sample. In order to further reduce the effect of surface irregularities, the sample is usually spun
30-40 mm is needed. Major, minor and some trace elements (Ba, Co, Cr, Nb, Ni, Rb, Sr, V, Y and Zr) were analyzed. Typical uncertainties are <3% for Si, Ti, Fe, Ca and K, and 7% for Mg, Al, Mn, Na and P; uncertainties for trace elements (above 10ppm) are <7% for Rb, Sr and V and 15% for Ba, Ni, Co and Cr.
Mineral major elements - EMPA
Electronic microprobe analyses were performed at state key Laboratory for Mineral Deposits Research, Nanjing University and Institute of Petrology, Vienna University. In Nanjing University the mineral composition of samples was determined using a JOEL Superprobe (JXA 8100). Operating conditions were as follows: 15 kV accelerating voltage, 10 nA beam current and <5 μm beam diameter. Natural minerals and synthetic oxides were used as standards, and a program based on the ZAF procedure was used for data correction. Multi-point measurements were carried out from the core to the rim region of each mineral grain, and 3-4 grains of each mineral were measured in every sample.
In Vienna University the major element analyses of minerals were carried out on a Cameca SX100 electron microprobe, the operating conditions were 15 kV and 20 nA. In order to reduce alkali loss, glass analyses were performed using a defocused beam with a diameter of 5–10 μm at 15kV and 10nA. The error for all elements is below 5%, except for Na, which may be up to 10%. Natural and synthetic standards were used for calibration, and the PAP correction (Pouchou and Pichoir, 1991) was applied to the data.
Water content in NAMs - FTIR
Double-polished thin sections with a thickness of about 0.2 mm were prepared for the FTIR investigation (resin was used during the polishing treatment). The cleaning procedure of the sections prior to measurements included 10 to 20 hours dissolution in ethanol or acetone to remove the residual epoxy, followed by heating in an oven at ~ 100 °C for 3 to 10 hours to remove the surface absorbed water. Infrared spectra were obtained at wavelengths from 650 to 6000 cm-1 using a Nicolet® 5700 FTIR spectrometer (Fig. 3.1) coupled with a Continuμm microscope at the School of Earth and Space Sciences, University of Science and Technology of China (USTC) in Hefei. The principal advantages of such treatment are that: First, it is easy to observe the sample spot and to check the quality optically before the measurements; second, the liquid-N2 cooled detector placed over the microscope is optimized for a
focused beam; Third, the focused IR beam yields higher intensities than a measurement in the sample chamber of the spectrometer. The samples were measured by unpolarized radiation with an IR light source, KBr beam-splitter and liquid-nitrogen cooled MCT-A detector. A total of 128 or 256 scans were counted for each spectrum at a 4 cm-1 or 8 cm-1 resolution. Optically clean, inclusion- and crack-free areas, usually centered in the core region of each grain, were selected for the measurements with apertures of 30×30 or 50×50 μm, depending critically on the size and quality of the mineral grains.
Fig. 3.1 - Picture of the Nicolet 5700 FTIR spectrometer coupled with a microscope
Large and fresh grains were selected for the H-profile analysis. An accurate measurement of hydrogen-species in anisotropic minerals requires orientation of single crystals and use of polarized IR radiation (Libowitzky and Rossman, 1996). This is a very difficult technique to perfect and so an alternative technique using unpolarized determinations was performed and a statistically significant number of individual grains for each mineral in the same sample were chosen. Assuming that crystal orientation is randomly distributed within each sample (as evidenced by the variability in our FTIR results) an average value was used. Water contents were calculated by the modified form of Beer-Lambert Law: Δ=I×c×t×γ. where Δ is the integral absorption area (cm-1) of absorption bands, I is the integral specific absorption coefficient (ppm-1•cm-2), c are the contents of hydrogen species (ppm H2O), t is the
Paterson (1982). In this study, the integral region was 3000–3800 cm−1, and the integral specific coefficients for cpx and opx were taken from Bell et al. (1995; 2003). Thickness was measured with a digital micrometer and reported as an average of 30~40 measurements covering the whole section; Baseline corrections were carried out with a spline-fit method by points outside the OH-stretching region.
Several factors have to be taken into consideration during the integration of IR spectra: (i) The Nicolet 5700 FTIR spectrometer occasionally suffers from an intrinsic problem, in that it can randomly produce positive, neutral or negative absorptions in 3700-3900 cm-1, usually peaked at ~ 3740 and ~ 3850 cm-1 (Fig. 3.2). These absorptions can change from one type to another in very short time, e.g. in less than a few minutes. Dehumidifiers were working all the time to keep the atmosphere in the labs dry and we try to less people in the room to avoid increase moisture. so that unstable of the background are probably caused by an artifact of the instrument, e.g. by the silicon carbide source, rather than by the instabilities of the background (ii) The application of liquid-N2 on
the coupled microscope can sometimes lead to the formation of invisible water film on the detector, and thus result in a weak absorption peak at about 3250 cm-1. (iii) Some secondary phases even in trace amounts, e.g. invisible amphibole/mica lamellae, may contribute to the absorption of hydrogen-related species in the 3000-3700 cm-1 region, e.g. a weak band at ~ 3660 cm-1 observed in some Panshishan samples. (iv) Residual traces of epoxy on the sample wafers can generate minor absorptions between 2800 and 3000 cm-1
mentioned 4 aspects are actually, in most cases, very little or negligible to the final total integrated area related with the absorption of OH/water molecular structurally bound to the host minerals; but there are a few occasions that their influences are so evident that they have to be treated separately. I attempted to resolve and fit the individual peaks manually on each background-subtracted spectrum, of which the bands from non-structural OH/H2O are notably visible
(in this case, the contributions are mostly beyond 5%), by using the Peakfit V4.12 program (Jandel Scientific). The Gaussian form was used to fit the spectra, and the results were usually assured by r2 > 99.9% at 95% confidence level. The above case (iii) is a little complicated, because altered hydrous products may produce, in addition to the ~ 3660 cm-1 peak, absorption bands at other positions, which may superimpose on the typical peaks from structural hydrogen-species. In this case, it is impossible to separate the superimposed peak at present.
The interference from the FTIR spectrometer, mentioned above as artifact of the instrument, has fundamental influences on the baseline treatment of the IR spectra, in that it produces absorption in the 3700-3850 cm-1 range (see also the later chapter for details). Therefore, this problem must be treated carefully. I try to resolve this by the following procedure illustrated in Fig. 3.3: firstly, a blank background spectrum was obtained (Fig. 3.3a); secondly, a subtraction was carried out on a normal spectrum with many noisy bands in the 3700-3850 cm-1 area (Fig. 3.3b) relative to the blank, and a new spectrum with very weak or relatively simple absorptions in this region was produced (Fig. 3.3c); finally, a linear replacement was performed on the yielded spectrum between ~ 3750 and 3900 cm-1 for an approximation, which was processed by a “Straight Line” function provided in the Omnic software (Nicolet), and a relatively
high-quality spectrum was made (Fig. 3.3d), on which the band at ~ 3740 cm-1, if present, can be easily resolved by Peakfit software. According to the curve trend of the spectrum (Fig. 3.3d), this approach, in most cases, contributes very little (e.g. < 2% or even less) uncertainty to the final calculated water content.
Fig. 3.2 - Absorption diagram of the Nicolet 5700 FTIR spectrometer (The spectra were obtained for a blank, and were vertically offset for the illustration)
Fig. 3.3 - Interference treatments from the instrumental absorption diagram
Uncertainties in the obtained results derive from: (1) Unpolarized light. This is the main uncertainty during the analysis but it is estimated to be mostly less than 10% considering the applied procedures and the recent approach of
Asimow et al. (2006). (2) Baseline correction. Some strongly rising, non-linear baselines may be an intrinsic part of the spectrum in the OH region. These baselines commonly arise from Fe2+ and may arise from silicate overtones in thick samples. A major, subjective source of uncertainty in IR measurements of OH in minerals remains the choice of baseline. Error introduced by different baseline corrections, e.g. spline-fit, polynomial-fit or slightly changing the points during the fitting is usually < 5%. (3) Variation of thin sections thickness. This was less then than 6% centered on the average value for each sample. (4) Absorption coefficients. There are slight differences between absorption coefficients in cpx and opx in my samples and those used to determine the mineral specific absorption coefficients (Bell et al., 1995), due to their different compositions and densities. These variations are estimated to be generally < 10%. On the whole, the total uncertainty, summing each single error, is estimated < 30%.
Detailed FTIR profile analysis performed at the USTC lab of two augite megacrysts hosted by Nushan Cenozoic basanites confirmed the homogeneity of their water content. These were used as standards to detect potential instrument shift during analysis. During the analytical period of all the NCC peridotites, the maximum difference for two augites is <4% both for peak height and integrated area within OH absorption area. The augites were also analyzed ay the LMTG lad (Toulouse, France). The maximum difference of peak height and integrated area within OH absorption area between the USTC lab and the LMTG [Toulouse, France] lab is <3% during cross-check analysis.
Mineral trace element - LA-ICP-MS
Trace element compositions of Cpx and a few Opx were carried out at LA-ICP-MS laboratory of University of Science and Technology of China. FTIR thin sections were broken and minerals grains were selected mounted in epoxy pellet and polished. Mineral grains were ablated in situ with Coherent company GeoLas pro ArF laser system with beam wavelength 193nm at 10 Hz repetition rate and 10J/cm2 energy per plus. The ablation crater diameters are 60μm, and the sample aerosol was carried to ICPMS by high purity Helium with flow rate of 0.3L/min. A typical analysis consists of 80-100 replicates within 80-100s. PerkinElmer DRCII ICPMS was used to analysis the aerosol samples with the RF power 1350w and nebulized gas flow rate 0.7L/min. Sample analysis results processed with LaTEcalc software. The signal intensities (counts per ppm) for each element were calibrated against the NIST 610 silicate glass and the 44Ca content of samples was used as an internal standard. Typical analytical precision ranged from 2% to 5%.
Mineral O isotope - LA- MS
Oxygen isotope data were measured at the CNR-IGG of PISA by laser fluorination, reacting 1 to 1.5 mg ol, opx, cpx and sp fragments in F2 gas
atmosphere. I employed a 25 W CO2 laser operating at a wavelength of 10.6
μm to irradiate the samples, and pure fluorine desorbed at 290°C from hexafluoropotassium-nickelate salt as a reagent. Three pre-fluorination steps were made before measuring new sets of analyses, in order to remove the moisture in the sample holder and the line. The O2 produced during laser
fluorination together with excess fluorine were passed through potassium chloride salt and excess fluorine was converted into a potassium-fluoride salt
and chlorine gas. A cryogenic trap cooled at liquid nitrogen temperature was used to freeze chlorine. After purification, O2 was trapped over a cold finger
filled with 13A zeolites, and then transferred to a Finnigan Delta Plus Mass Spectrometer for oxygen isotope analysis. QMS and NBS30 standard samples were measured at the beginning of each day of analysis; after the standard samples reached the accepted values, minerals samples sequence started. 5 to 6 standards were measured during each set of analyses. The average δ18O value of QMS is 14.05 ±0.17 ‰ (1σ) and the δ18O value of NBS30 is 5.24±0.15 ‰ (1σ). All δ18O values are relative to SMOW. At least two fragments were analyzed for each mineral, and the variation within the same sample is less than the precision of standards.
Chapter 4 - Petrography
The studied mantle xenoliths come from the three localities of Panshishan, Lianshan and Fangshan in Subei basin (Fig. 2.3). They are located in northwestern Jiangsu Province. Panshishan and Lianshan are separated by about 6 km, while Fangshan is about 20 km southwest of Lianshan. 14 samples from Panshishan, 22 from Lianshan, and 17 from Fangshan were investigated.
Sample description
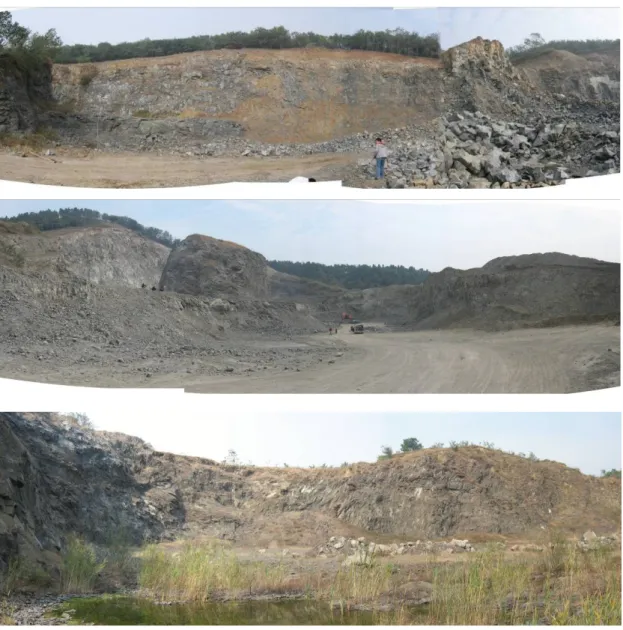
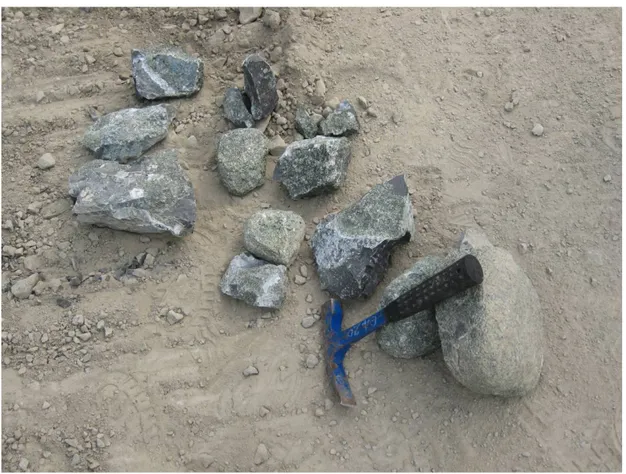
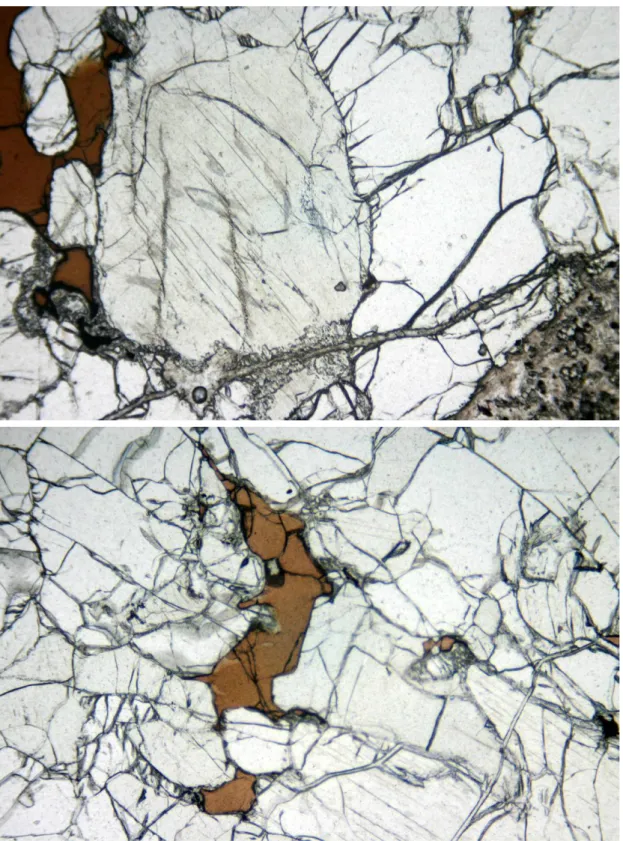
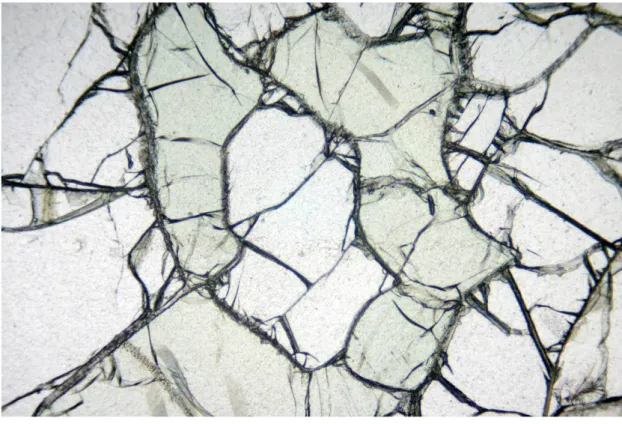
The xenoliths from the three localities Panshishan, Lianshan and Fangshan are all hosted in alkali basalt lava flows (Fig. 4.1). Most of the xenoliths are rounded. Xenoliths from Panshishan and Lianshan are moderate in size (typically 5–10 cm in diameter), the largest ones (35cm in diameter) have been found in Panshishan and Lianshan (Fig. 4.2). Xenoliths from Fangshan are relative smaller than those of Panshishan and Lianshan. Textures vary from coarse-grained protogranular (~70% of total samples) through porphyroclastic (~20%) to equigranular (~10%) types. No hydrous phase or metasomatic secondary phases were observed. Samples from Panshishan are quite fresh, while those from Lianshan appear slightly altered in hand specimen. This difference is apparent in the olivine color, which varies from light green in the freshest samples, towards yellow, brown or even red in the most altered samples. The few samples from Fangshan showing textural evidence of host basalt infiltrations were disregarded. Fig. 4.3 shows some textures in the xenoliths, for each locality detail description are reported below.
Fig. 4.1 - General pictures of sample localities, from top to bottom Panshishan, Lianshan and Fangshan.
Fig. 4.2b - Picture of xenoliths from Lianshan
Panshishan xenoliths
The textures of Panshishan xenoliths were mostly protogranular and protogranular- porphyroclastic. Olivine (ol) and orthopyroxene (opx) are large (5–8mm), while clinopyroxene (cpx) and spinel (sp) are smaller (1–3 mm). Cpx and sp are always in direct contact with the large opx grains and sp commonly forms vermicular crystals inside opx or between opx and cpx. Occasional cpx exsolution lamellae are seen in opx. PSS07 is equigranular (Fig. 4.3), with small ol (2mm), opx (2mm), cpx (1mm) and sp (<1mm).
Lianshan xenoliths
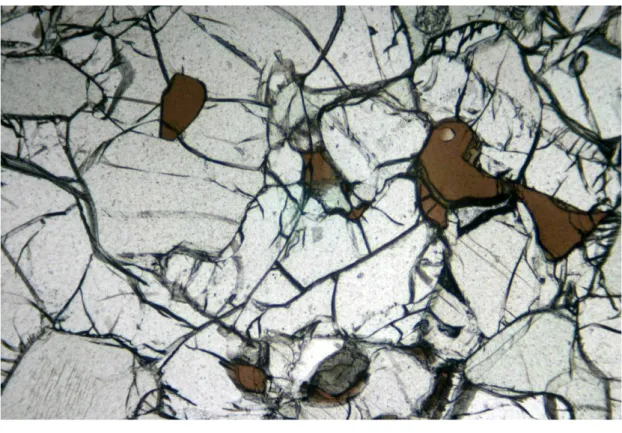
The protogranular textures typical of most Lianshan xenoliths show no preferential orientation and crystals are not elongated. Olivine (ol) and orthopyroxene (opx) are large (4–7mm), while cpx and sp are smaller (1–3 mm). Cpx and sp are always in direct contact with the large opx grains and sp commonly forms vermicular crystals inside opx or between opx and cpx. Occasional cpx exsolution lamellae are seen in opx (Fig. 4.3). Sample LS05 is the only xenolith displaying a preferential orientation, with parallel elongated tabular olivine crystals (1*3mm). Holly-leaf sp grains and some triple junctions are present. This texture is transitional between porphyroclastic and tabular equigranular.
Fangshan xenoliths
The Fangshan xenoliths are all spinel-facies peridotites, dominantly spinel lherzolites with rare spinel harzburgites. Samples are mostly protogranular or porphyroclastic. Olivine (ol) and orthopyroxene (opx) are large (4-7mm), while clinopyroxene (cpx) and spinel (sp) are smaller (1-3mm). Occasional cpx exsolution lamellae are seen in opx, similar to the other localities.
Fig. 4.3 - Texture of xenolith LS03
Mineral mode estimates by point counting
The polished thin sections are scanned into digital picture, then enlarged and marked with a 40 by 40 grid and counted based on the different color of minerals (transparent for ol, dark green to brown for opx, green for cpx and totally black or dark brown for sp). The point counting resulting in the modal percentage of minerals is reported in Table 4.1. As the thin section represents just a small part of the xenoliths, it may not perfectly comparable with modal estimates obtained by mass balance betwwn whole rock and mineral analyses. A petrographic classification diagram was used (Fig. 4.4) for the Subei basin xenoliths. The samples which have cpx modal content less or equal to 5% are classified as harzburgite, those with cpx modal content from 6 to 9% are named cpx-poor lherzolite. Xenoliths with ol mode content < 40% are named olivine websterite while those with ol mode content >90% are named dunite. Most of the xenoliths are lherzolites (Table 4.1, Fig. 4.1), rarely, harzburgites. Olivine websterites and pyroxenites are rare. Among 14 Panshishan xenoliths, just PSS17 falls within harzburgite field with cpx mode content of 5% and PSS01, PSS10 and PSS20 are cpx-poor lherzolite. Among 22 xenoliths from Lianshan, LS 26 is harzburgite while samples LS04 and LS24 are olivine websterite (ol content about 40%). LS16 has olivine mode content up to 92%, and classifies as dunite, having 3% modal content of cpx, so LS16 is referring as cpx-bearing dunite. Six samples (LS03, LS12, LS15, LS17, LS19 and LS21), with cpx content range from 6 to 9 are named cpx-poor lherzolites. The rest are lherzolites. Xenoliths from Fangshan seems more depleted in cpx mode content, three samples FS06, FS25 and FS30 are harzburgites, FS11, FS13, FS16, FS24 and FS 26 are cpx-poor lherzolites. All the samples from the three localities encompass the compositions ascribed to upper mantle peridotite, from fertile
lherzolite with cpx mode content up to 23% to cpx-poor lherzolite with cpx mode contents about 6-9% and rarer harzburgite with cpx mode content as low as 3%.
Fig. 4.4 - Petrographic classification for peridotite xenoliths from Subei basin.
PSS: Panshishan, LS: Lianshan, FS: Fangshan; lh: Lherzolite, cpx poor-lh: with cpx modal content in the range of 6-9%; hz: Harzburgite, ol-wb: Olivine Websterite, Du: Dunite. Light blue diamond, Panshishan lherzolite; light blue filled grey diamond, Panshishan cpx-poor lherzolite; blue open diamond, Panshishan harzburgite; red dot, Lianshan lherzolite; red filled grey dot, Lianshan cpx-poor lherzolite; red open dot, Lianshan harzburgite; red filled pink dot, Lianshan olivine websterites; red filled golden dot, Lianshan dunite; green triangle, Fangshan lherzolite, green filled grey triangle, Fangshan cpx-poor lherzolite; green open triangle. Fangshan harzburgite)