Universit`
a degli Studi di Ferrara
DOTTORATO DI RICERCA IN
MATEMATICA-INFORMATICA
CICLO XXIII
COORDINATORE Prof.ssa Luisa Zanghirati
Multi-sensor Evolution Analysis: an advanced GIS for
interactive time series analysis and modelling based on
satellite data
Settore Scientifico Disciplinare INF/01
Dottorando: Tutore:
Dott. Alan Beccati Prof.ssa Eleonora Luppi
to my dearly beloved Erminia to my family
Contents
Introduction xiii
1 A thematic view on the temporal domain 1
2 Perspectives on an interactive thematic system 9
2.1 Users needs and access policy . . . 9
2.2 Data preparation . . . 12
2.3 Thematic search and evolution modelling . . . 19
2.4 User Interfaces . . . 22
2.5 Hardware and performances . . . 24
3 Multi-temporal analysis system 27 3.1 Comparable data over time and across sensor . . . 28
3.2 Comparable data locations across sensors . . . 31
3.3 Evolution Model concepts . . . 33
3.4 User interaction . . . 41
3.5 Access Control . . . 45
3.6 Data flow automation . . . 48
4 Implementation: building the data stack 53 4.1 Along Track Scanning Radiometer . . . 53
4.2 A land cover maps provider service . . . 56
4.2.1 An automated pluggable distributed processing system . . . 58
4.2.2 An interoperable interface for data provision . . . 62
4.3 Remapping on the Earth Fixed Grid . . . 64
4.4 The Automated Data Ingestion . . . 66
4.5 The Tile Archive . . . 68
4.5.1 Tile meta-data database . . . 68
ii CONTENTS
4.5.2 The Tile repository . . . 71
5 Implementation: providing interactive analysis 75 5.1 On-line data analysis interfaces . . . 76
5.1.1 Time Series Analysis . . . 76
5.1.2 Evolution Model Editor . . . 80
5.1.3 Evolution Model Matching . . . 82
5.2 The model matching engine . . . 85
5.2.1 Concurrent distributed matching over area . . . 85
5.2.2 Detailed on-demand over pixel . . . 87
6 Results and discussion 89 6.1 Performance level and response time . . . 89
6.1.1 Classification and remapping performances . . . 89
6.1.2 Tile ingestion performances . . . 91
6.1.3 Thematic content query performances . . . 94
6.1.4 Multi temporal matching performances . . . 96
6.2 Extensibility and scalability . . . 98
6.3 limitations and known issues . . . 100
6.3.1 Inherent limitation in post-classification . . . 100
6.3.2 Model expressive power . . . 101
6.3.3 Surface calculations . . . 101
6.4 A versatile multi-temporal data exploration system . . . 102
6.4.1 Visual analysis . . . 102
6.4.2 Evolution Model examples . . . 105
6.5 Data availability . . . 109
6.5.1 Quality assessment on classified data . . . 110
6.6 Preliminary case study . . . 114
6.6.1 Independent validation by user group . . . 115
7 Future work and improvements 119 7.1 On models and the model editor . . . 120
7.2 On data availability . . . 123
7.3 Support to validation activities . . . 125
CONTENTS iii
A Additional Details 133
A.1 hardware system details . . . 133
A.1.1 Solid State Disk performances . . . 134
A.2 Parallel concurrent queries tests . . . 138
A.3 A note on mono-dimensional geographic addressing . . . 139
A.4 The ext4 issue . . . 140
A.5 Data duplication assessment . . . 141
List of Figures
1.1 Multi-temporal thematic view . . . 5
2.1 User access scenario . . . 12
2.2 Overall diagram of data preparation elements: the ASQuLD service. . . 14
2.3 Overall diagram of the Automated Data Ingestion system . . . 17
2.4 Directory tree structure of the Tile storage. . . 17
2.5 Use of different storage units by direct use of mount points. . . 18
2.6 Overall diagram of user interfaces with main functions provided. . . 23
3.1 Spectral classification flattens the spectral dimension, collocated time series provide a thematic cube over time. . . 29
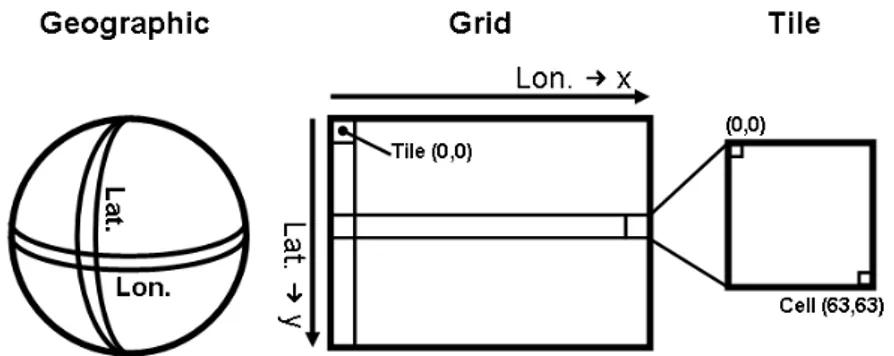
3.2 Discrete Grid Tiles on the Earth surface. . . 32
3.3 Addressing of cells . . . 33
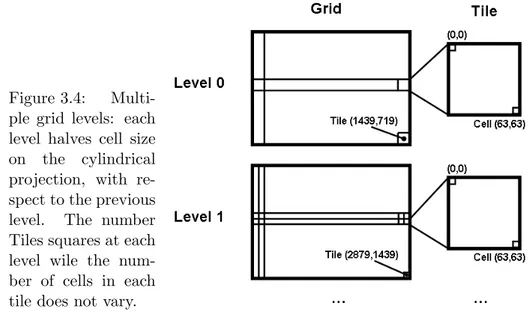
3.4 Multiple grid levels. . . 34
3.5 Temporal parameters of a model element . . . 35
3.6 An Evolution Model is a sequence over time of Model Elements. . . 35
3.7 NDVI profiles of agricultural crops and candidate model elements. . . . 36
3.8 An evolution model defines a temporal extent where data is tested . . . 40
3.9 An evolution model may specify a temporal offset. . . 41
3.10 GUI outline for exploratory analysis. . . 42
3.11 GUI outline for model editing. . . 43
3.12 GUI outline for model matching (thematic evolution search). . . 43
3.13 Tree view of the interfaces with associated functionality and user need. . 44
3.14 The pixel history graph: thematic pixel profile. . . 45
3.15 Authorization policy example . . . 48
3.16 Automated data ingestion rules and control flow . . . 50
4.1 Near Polar Orbit . . . 54 v
vi LIST OF FIGURES
4.2 Along track scanning technique . . . 55
4.3 ASQuLD service architectural design. . . 57
4.4 ASQuLD service: processing coordinator architecture . . . 59
4.5 ASQuLD service: processing coordinator queue . . . 60
4.6 ASQuLD service: processing coordinator queue interface . . . 60
4.7 ASQuLD service: processing coordinator server activities . . . 61
4.8 ASQuLD service: processing coordinator client activities . . . 61
4.9 ASQuLD service: output collection set type . . . 65
4.10 Processing input rules management interface. . . 67
4.11 Tile metadata database . . . 69
4.12 Tile repository output schema . . . 72
5.1 Screen shot of the exploratory tab of EVAT interface. . . 77
5.2 Command panel of the Tile Time Series. . . 80
5.3 Screen shot of the EVAT model editor tab. . . 80
5.4 The class selector provided by the model editor. . . 81
5.5 Screen shot of the model matching tab of EVAT interface. . . 82
5.6 Screen shot of EVAT tab3 with results displayed. . . 83
5.7 Screen shots of pixel level result details. . . 84
5.8 Distribution model of the model matching engine. . . 86
6.1 Multi-threaded ingestion: performances with different concurrency levels 92 6.2 Multi-threaded ingestion: device utilization with different concurrency levels . . . 93
6.3 Elapsed times for Pixel History Graph generation with respect to pixel Latitude. . . 96
6.4 Area covered by a rectangular selection of 400 Tiles over northern Italy, Latitude about 45 degrees North. . . 96
6.5 Seasonal Evolution Model matching performance. . . 97
6.6 Generic Evolution Model matching performance. . . 99
6.7 Time series view of a study area showing the area around the city of Vercelli in Piedmont, northern Italy. . . 103
6.8 Pixel History Graph of a pixel covering a urban area. . . 103
6.9 Land cover classes observed across warm seasons for a pixel over a urban area. . . 104
LIST OF FIGURES vii 6.10 Pixel History Graph of a pixel showing agricultural practice influence. . 105 6.11 Pixel History Graph of a pixel showing disturbance and recovery
phe-nomena. . . 105
6.12 An evolution model with two elements to detect deforestation. . . 106
6.13 An evolution model with three elements to contextualise change. . . 107 6.14 An evolution model with four elements, defined along the NDVI profile
of winter wheat fields. . . 108
6.15 An evolution model with four elements for rice fields detection . . . 108
6.16 Heatmap of Tile count across 15 years. . . 109 6.17 Heatmap of Tile count across 15 years with multiple daily Tiles removed.110 6.18 Heatmap of Tile count for the year 2010, with multiple daily Tiles removed.111 6.19 Heatmap of Tile count for the year 2002, with multiple daily Tiles removed.111 6.20 Rapid detection of outliers in time series . . . 112 6.21 Discard and report of outliers. . . 113 6.22 Mapped assessment of misclassification issues extent and frequency . . . 114 6.23 Pixel History Graph of a pixel showing systematic alternate classification.114
List of Tables
3.1 Discrete Grid System levels and supported sensors . . . 32
3.2 Permissions reference matrix . . . 47
4.1 Spectral resolution of ATSR-2 and AATSR instruments. . . 55
4.2 Typologies of hardware nodes for the ASQuLD catalogue . . . 57
4.3 ASQuLD service interface: defined product typologies. . . 64
6.1 Classification and remapping processing time. . . 90
6.2 Time elapsed for Pixel History Graph generation over 30 test site pixels. 95 A.1 Application server and storage controller hardware. . . 133
A.2 Processing Node hardware. . . 134
A.3 Database node hardware. . . 134
A.4 Bandwidth and IOPS for different SSD configurations. . . 135
A.5 Parallel query execution time. . . 138
A.6 Empirical measure of data duplication across Latitude. . . 141
Listings
4.1 Example of spatial-temporal-thematic query for content based retrieval . 70
4.2 Example of Tile archive output for a single Tile request; Tile data inside pixel element is omitted. . . 72 A.1 Excerpt of query check condition with mono dimensional Tile
address-ing. One condition has to be check for each Tile line crossed along Latitude by the AOI . . . 139 A.2 Excerpt of query check condition with two-dimensional Tile addressing.
Only four conditions has to be check independent of AOI size . . . 139 A.3 The ext4 file system error observed during stress tests . . . 140
Introduction
This thesis proposes an interactive, integrated system for the exploitation of the large and ever growing satellite data archives. Collecting observations of the Earth surface over decades, these archives store large amounts of data that, among other uses, is used to extract meaningful information about the Earth’s surface, in a form that humans can directly comprehend. Access to thematic information contained within these vast archives has to be provided in a way that allows its prompt usability by diverse user communities, either interested in using it for research purposes or for decision support. Several catalogue system exist and a continuous effort is ongoing to improve accessibility to these archives, yet few systems provide systematic access to thematic data and the ones doing so provide very specific products (such as, fire events, burned areas, yearly land cover or land use maps).
The evolution over time of primary parameters, measurable from satellite data, is proven to be a practical and viable methodology for characterization of phenomena that influence a given area. Any change occurring in an area that is relevant enough to change one or more of its primary parameters may present a characteristic evolution pattern over time that can be used for its identification. The prompt availability of thematic data, derived from satellite images with high temporal frequency, is thus an improving element for research activities as it can promote an insightful view over study areas and on their dynamic behaviour over time, avoiding to users the time consuming operations usually required to: search for, collect and prepare large amounts of data for multi-temporal analysis.
In the proposed system, thematic-temporal pattern identification (how the the-matic classification of an area changes over time) is fostered by visual display both over areas and at single pixel level to permit direct applicability of a valuable research and analysis tool: the human vision. The archive of thematic maps is browsable inter-actively to display temporal sequences of maps of a selected study area, that can be
xiv INTRODUCTION filtered dynamically to display only a thematic class of interest, to observe its evolution in the area over time. At pixel level, a complete thematic evolution across the years can be visualized in a compact visualization form fostering identification of patterns along (seasonal variations such as agricultural practices) and across (yearly or long lasting changes) years. Once patterns are identified, either by visual data exploration or by prior knowledge on a given phenomenon, their search over the data archive can be automated so that their occurrences are detected over a given area of interest (at regional or national scale) at the user’s request.
Graphical interfaces are provided to model land cover evolution patterns, to per-form a spatio-temporal search for these patterns and to display result maps generated by the search process. These result maps provide immediate visual display of the lo-cations presenting the modelled evolution over a given period. The availability of a generic, thematic-temporal pattern definition and matching system, able to provide interactively (within few seconds to few minutes at 1 Km resolution) the results of a query such as: “identify locations over Italy presenting a given thematic evolution across 2010” is a feature unique to the presented system. The availability of such features in an interactive environment with fast response time, loaded with thematic data extracted from 15 years of Remote Sensing (RS) data at 1-km resolution with global coverage, provides an unprecedented dataset to the scientific community to be explored and used in support to their research activities, with the aim to accelerate the acquisition of knowledge both on known and unknown dynamics observable on the Earth’s surface from a satellite’s point of view.
The presented system addresses also the problem of promptness of usability of outputs coming from research and modelling activities. An access control framework, providing different views on the system for different user typologies is proposed to enable prompt usability of “verified” modelled patterns to end users who are not interested on detailed data analysis but just in utilization of verified models (users of consolidated products available through classical, catalogue based, delivery systems such as burned areas, flooding events assessment, agricultural practices and any other phenomenon that can be characterised by its thematic evolution over time), with the advantage of having an interactive access to those products, directly on the system that produces them.
xv use and detect relevant land cover transition phenomena caused either by human inter-vention or natural events, the work reported herein provides a starting point toward the realization of an integrated tool for the exploitation of multiple satellite archives, within a framework providing a common platform to different user communities, fostering col-laborative contribution based on interactive reporting of data and cross-validation of models.
A complete implementation of the Multi-sensor Evolution Analysis (MEA) system has been realized in the framework of two European Space Agency (ESA) projects: the Classification Application-services and Reference Datasets (CARD) project[1] where I participated in the realization and deployment of the system architecture, described in 4.2, for systematic processing of the entire AATSR and ATSR-2 ((A)ATSR) archives to deliver the classification maps used to build the MEA multi-temporal data stack, that is continuously updated with new data from the AATSR rolling archives. I have also defined the interoperable catalogue interface that permits automated access to the data archive to perform thematic queries over the archived data with the addition of a flexible data order operation.
The implementation of the first MEA prototype over the entire (A)ATSR archives was completed in the framework of the Support by Pre-classification to specific Applications (SPA) project[2], where I participated to all the main aspects in the realization of the system: from requirements analysis, to system design and implemen-tation, with an emphasis on performance oriented design justification and system vali-dation in close cooperation with ESA staff. I also designed and verified the development of a second version of the system (documented herein), which added features oriented toward system usability, such as aggregation of the features domain for configurable level of detail and prepared it for integration of multi-resolution data. A complete instance of the system is now available to the the Earth Observation (EO) community through the Ground Segment Research and Technology Development (RTD) Depart-ment at ESA - European Space Research INstitute (ESRIN) (one of the five ESA specialised European centres).
My thesis work was also in close cooperation with Meteorological and Environ-mental Earth Observation (MEEO), an Italian company located near Ferrara that
developed the SOIL MAPPER® (SM) classification system based on spectral signals
xvi INTRODUCTION projects and owner of SM that has been selected as the classification system to build the classification maps for MEA implementation.
This thesis describes the approach used in building the system, the data processing methodology (conceptual design), details architectural elements and interfaces of the system implementation over 1 Km data and elaborates on results obtained in terms of potential uses and advantages of the features provided, including results of their evaluation by a group of end users participating in validation activities to assess both usability and usefulness of the system. It is organized in chapters as follows:
Chapter 1 provides a short introduction on the idea of using a thematic view over the temporal domain as an enabling tool for insightful exploitation of large satellite data archives. Its founding principles and contextual information is provided; Chapter 2 defines the goals of the system implementation and outlines the system
architecture, elaborating on the main perspectives considered, driving the defi-nition of the system and design choices relating to each of them;
Chapter 3 details the conceptual description of the methodology including the data processing flow to prepare a consistent data set that is comparable in the geo-graphic, thematic and temporal domains, across different sensors. The thematic-temporal pattern matching system is defined along with the proposed layout of the user interfaces for interactive data presentation;
Chapter 4 describes the chosen satellite dataset to populate the system archive and provides an overall view of the implemented systematic data processing chain, built with a minimal, firewall friendly, reusable distributed processing system, to extract thematic data and prepare it for interactive access and analysis;
Chapter 5 describes data access and presentation functions, including key functions of the graphical user interfaces and the model matching engine, implementing a distributed processing platform based on Web server technology;
Chapter 6 provides a critical analysis of results obtained in terms of features pro-vided, performances for interactive analysis and results of the assessment per-formed in collaboration with a group of end users;
Chapter 7 draws conclusions on the presented material and proposes possible im-provements and future work directions;
Chapter 1
A thematic view on the temporal
domain
The ever increasing availability of Earth RS data acquired from orbiting satellites calls for the development of tools permitting the EO community to efficiently exploit such vast and growing amount of data. Thematic categorization is one of the possible ways to extract meaningful information from large data archives while reducing data volume to a more manageable size. Such generic thematic information, closer to human semantics, can then be displayed for interactive analysis by a user community interested in gathering this information or in its deeper analysis within a specific thematic field. This thesis proposes an interactive system that permits to analyse time series of geo-referenced thematic data. The system provides visual data browsing features as well as tools for computer aided modelling of thematic evolution patterns (defining how the thematic data is expected to evolve over time) and their automated matching against very large databases (many years of data over entire continents). Therefore this system extends the normal search in the space and time dimensions with the capability to verify the matching of the modelled thematic evolution patterns and provides derived maps for on-line analysis. A multi temporal thematic evolution search introduces a form of content based information retrieval on the archived data. The interactive system operates on the results of a bulk data processing infrastructure that extracts the thematic data from the huge basic data and stores it in a form suitable for interactive display and analysis. The implementation of the total system (pre-processing and interactive parts) for an entire archive of the data acquired from a moderate resolution RS instrument is also herein described. The remaining of this chapter provides basic foundational concepts to contextualise the presented work.
2 CHAPTER 1. A THEMATIC VIEW ON THE TEMPORAL DOMAIN Visual analysis for data exploration
An interactive environment for data exploration that promotes visual pattern identifi-cation is an essential element to ensure direct applicability of the human vision in data analysis. Human vision has been recognized as an important tool in the advancement of science, paired with data visualization tools to foster pattern identification in geo-graphic data applications such as cartography [3]. The way in which data is presented can thus help to provide insight on the causes determining the observations and an ex-ploratory attitude to data can lead to discovery of unknown phenomena or be a tool to provide assessment for further analysis directions; Exploratory Data Analysis (EDA) principles and the importance of such attitude to data are provided in [4].
Data exploration is a concept now permeating several fields of RS, like the obser-vation of the skies through the Virtual Observatory (VO) which provides capabilities to analyse and integrate astronomy data from different providers, as well as to per-form interactive computations on elements from its widely distributed digital data archives[5]. Within the Knowledge-based Information Mining (KIM) framework, data mining techniques are also being applied to search collections of EO images for fea-tures of interest. KIM provides an interactive environment for spatial data mining, attempting to simplify user interaction with complex multidimensional data [6]. The
most recent launch of the GoogleEarth Engine project to deliver a platform to browse
and access an impressive amount of world-wide raster satellite imagery is also evidence of the increasing availability of on-line data and the focus towards their interactive exploration to increase its exploitation[7].
Graphical EDA tools are powerful instruments to provide an insightful display of data and its interactive visual analysis is a key aspect of the presented work: it provides a Graphical User Interface to interactively browse data, with focus on the temporal domain. Building on top of such vast archives, the data reduction potential of feature extraction can be leveraged to provide access to high level (thematic) data that users can visually explore.
The land cover thematic domain
Among EO applications, Land Use and Land Cover Change (LULCC) topics are be-coming more and more critical subjects for the impact they have on global climate. They are in fact linked to climate and weather in complex ways and are
fundamen-3 tal inputs for modelling greenhouse gas emissions, carbon balance, natural ecosystems and human environment evolution. Both human activity and natural phenomena can affect many of these processes, that are strictly correlated, influence each other and have strong impact and consequences on environmental, social and economic aspects as well as on human health. Land cover refers to everything that covers the land surface, including vegetation, bare soil, buildings and infrastructure, inland bodies of water, and wetlands. Land use refers, instead, to societal arrangements and activities that affect land cover[8].
Many approaches and methodologies exist for land cover change analysis: an ex-tensive survey is provided in [9]. Recent work for multi temporal analysis systems was performed to provide targeted land cover change studies or develop yearly databases of land cover [10]. An interesting bi-temporal approach to land cover change analysis is provided by the Land and Ecosystem Accounts (LEAC) methodology whose main goal is to provide an easy and comprehensive access to land cover data, showing the ‘stock’ available for each land cover class in the different land cover data, and providing also the changes occurred in the periods between different land cover works, as land cover flows matrices [11]. Besides bi-temporal change reporting, the suitability of modelling the change patterns of derived quantities extracted from multi temporal satellite data to identify relevant phenomena has been confirmed for such fields as agriculture; an example is given by [12] that confirmed the applicability of the Normalized Differ-ence Vegetation Index (NDVI) from moderate resolution satellite data as a cost- and time-efficient mean for large-area crop mapping in the U.S. Central Great Plains.
The availability of large quantities of EO data, with an ever increasing frequency in the temporal domain, especially if considering a combined use of multi-sensor data, creates the opportunity to develop new tools for both interactive analysis and visual exploration for pattern identification over time series of images. Yet no application is available to provide an interactive view on thematic land cover data, allowing interac-tive exploration of its evolution over time. The proposed system is thus an improving contribution that provides an unprecedented thematic view over data archives. Feature extraction
A large variety of tools and algorithms are now available to perform categorization over satellite imagery to extract meaningful features associated to understandable semantic
4 CHAPTER 1. A THEMATIC VIEW ON THE TEMPORAL DOMAIN meanings. Many of these tools in the past operated on individual optical images to identify features, such as those obtainable from algorithms working on spatial patterns or spectral signatures. The output of the latter algorithms have the ability to reduce the dimensionality of satellite datasets (in terms of spectral bands) into compressed maps of thematic information (thematic maps). These maps provide increasing ab-straction levels towards a higher semantic meanings clear to the end users and close to his application terminology.
The high amount of time required for visual or semi-automated image analysis calls for the use of more automated (unsupervised) pre-processing systems in order to improve satellite data exploitation. In the land cover field, the availability of such systems and the continuous technology improvement allows to obtain land cover maps from huge amounts of data in a relatively small amount of time, as it is the case with the recent global scale land cover maps for 2009 data, produced within the following year by the GlobCover project [13].
On the one hand, virtually every Earth Science (ES) study and application can greatly benefit from the use of the existing archives of long time series of satellite data and the ever increasing availability of new EO images that provide an unprecedented global coverage from different sources at different resolutions. On the other hand, since the size of a single multi-spectral image is in the order of hundreds of Megabytes, the real time utilization of these datasets for on-line analysis is a technological challenge by itself: computer systems play a key role in the EO field to readily process such large data volumes. The use of a fully automated, unsupervised classification system allows to implement clustered and distributed processing, in order to quickly deliver data and extract information for interactive visualization and ultimately pattern search. Thematic evolution over time
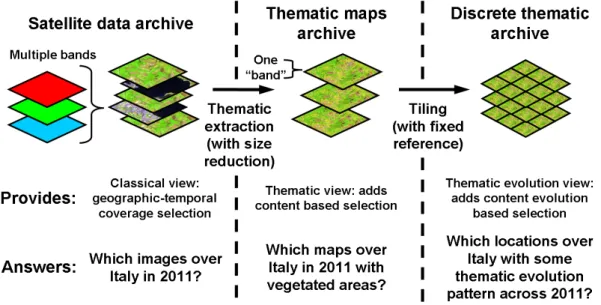
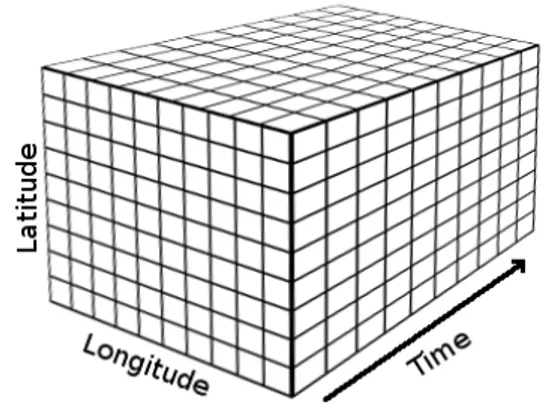
The methodology described in this thesis is based on advanced applications for single image feature extraction to deliver an integrated system with tools for multi-temporal analysis of time series of geographically referenced data. As shown in Figure 1.1, a thematic classification greatly reduces data volume, that becomes manageable to offer fast interactive analysis aimed also at visual pattern identification. Pairing the thematic view with a pattern definition and matching system allows to automate the search for defined patterns. A generic pattern specification that is not focused on
5 any specific change typology, or phenomena, provides a flexible exploration tool that can be used by scientists to interactively exploit multi temporal data. This interactive search feature can be an improving aid to research activities: the ability to interactively search for a temporal evolution pattern (in the thematic domain) at pixel level gives a new thematic view over existing archives of satellite data and a new way of interacting with them to discover and use information.
Figure 1.1: From large archives of multi dimensional satellite data, thematic infor-mation can be extracted, obtaining dimensionality reduction for each image to three dimensions (two spatial and one thematic). Tiling the thematic maps and linking each tile to a fixed geographic reference system and to the image acquisition time, permits to perform complex modelling and queries on the evolution over time of the thematic content.
An implementation is build for LULCC, with moderate resolution data, applicable to identifiable thematic categories (abstract, expressed in semantic terms) and pro-viding an interactive framework for visual exploration of land cover maps, with the immediate benefits of visual assessment of the accuracy of the underlying classification system and the land cover dynamics of any study area. The implementation allows also automated search through the temporal domain for specific patterns, defined using graphical interface. The automated search over the time series can be used to test the extent of occurrence of a pattern over wide areas and different time periods to confirm pattern validity or to identify areas worth studying in more detail. The output of the search can also be exported in computer readable form to be used to drive further processing by other systems requiring more processing resources, hence it is applicable
6 CHAPTER 1. A THEMATIC VIEW ON THE TEMPORAL DOMAIN as a screening tool identifying relevant subsets from the data archive without the need to access and process the datasets.
User community and technology
Another problem tackled by this thesis is to bridge the gap between research and the prompt usability of its results over EO products, a goal that is pursued by: considering different user roles and providing them different views of the system; adopting a web application model for user interaction; defining an access model that promotes collab-orative work while allowing access control. With the advent of web 2.0 technologies and the availability of client side programming features in modern web browsers it is now possible to deliver highly interactive interfaces directly over the web, without the need for installation of specific software packages, while providing the opportunity to build central points of references (i.e. web Portals) for collaborative work on specific subjects and leverage on high performance resources close to the data to perform the needed computations.
Summarizing, the MEA system is designed to be a widely applicable, generic tool for interactive analysis of long time series of (raster) geographic information in the temporal domain through the provision of specific tools to model, query and visualize data. It allows not only querying data by single map content but also to search for occurrences of specific content patterns over time at pixel level. MEA is applicable to any data scale while the implemented modelling system is better suited for data at nominal scale of measure, as defined in [14], such as the categories of the land cover thematic maps used for the presented implementation. Thematic categories can be easily displayed for better human understanding; for example they are usually mapped to a meaningful set of colours to produce false colour maps that increase readability. The applied principle is to ease visual analysis of classification.
Although thematic maps are a powerful tool by themselves for the depiction of an area in a readily understandable way, they can also be used in time sequences to effectively depict the dynamic aspects of the area. Two maps at different times are commonly used for the purpose of change detection, however, the prompt availability of a series of these maps can provide better understanding of these changes. An interactive search tool, can then be used to investigate them in greater (temporal) detail. Search features, based on sequential pattern matching in the thematic-temporal domain, have
7 been defined and implemented in MEA as a starting point toward interactive multi-temporal analysis in an integrated environment.
Chapter 2
Perspectives on an interactive
thematic system
The first implementation of the system, described in this work, is targeted to be suitable for fast interactive analysis of land cover maps produced by classification of the entire (A)ATSR archives and to be continuously updated as new data is collected by the sensor. Besides this first dataset, the system is designed to be ready to support further datasets derived from multiple sensors at different resolutions. In this context, the system has been considered from the perspectives presented in the following sections, along with discussion about driving choices, assumptions and key principles followed for each of them in designing the system.
2.1
Users needs and access policy
Clear identification of users of a software system and their needs is the first step and a key factor in providing an effective design, as endorsed by state of the art guidelines in the Space segment [15], while multi-user environments require user authentication and authorization policies to regulate access to their functions. User identification and access policy for MEA have been defined taking into account that it will serve diverse user communities, possibly on different domains that employ thematic maps and can benefit from interactive multi-temporal analysis with the contribution of user provided content.
In particular, with respect to data utilization, the identification and definition of evolution patterns over time and their coding into models that can be automatically searched over time to provide on-demand thematic maps, is a key function, well suited for identification of two broad categories of users. A first category of users is interested
10CHAPTER 2. PERSPECTIVES ON AN INTERACTIVE THEMATIC SYSTEM in the exploratory data analysis functions and in the use of evolution models to assist their research activities such as investigations in a specific domain.
A second category of users is interested in the prompt availability of on demand thematic views over user selected geographic areas and temporal ranges: examples are policy makers and public administrators, who can exploit consolidated products resulting from the temporal evolution analysis. The “Expert” role is assigned to the former users, since they have specific knowledge in their domain, while the “Standard” role is assigned to the latter users, because of the simplified system view they require. Users in the Standard role require access to finalised, understandable and valid prod-ucts obtainable from published models. This user categorization is also an attempt to bridge the gap between research and use, supported by overlapping views on some of the system functions in an integrated environment. Moreover, for any computer system that implements user identification, there are two essential user profiles to con-sider: “Anonymous”, which refers to unidentified users and “Registered”, which refers to identified users regardless of their other attributes. Finally one last essential role is considered: “Administrator”, which is assigned to users responsible for system and data management functions.
From the perspective of authorisation, in order to keep a simple categorization of functions associated with shared elements, the Unix file access control model is applied to evolution models, to complete the foundation principle for our access policy, it is crossed with the Windows Access Control List (ACL) concept. As detailed in section 3.5, from the Unix model we take the emphasis on ownership and the basic set of permissions: Read, Write and Execute while from the ACL model we add group list to allow assigning permissions for more than one group of users to the same model.
With respect to functionality, different functional needs are associated to each defined role that a registered user can belong to. In our model, access to functionality for user roles is inclusive with respect to the lower role as listed hereafter, in descending order of inclusion:
Administrator an administrator is expected to perform administrative tasks on the MEA system, hence it is granted all the capabilities and permissions granted to the other roles; in addition, specific administrative functions are defined:
2.1. USERS NEEDS AND ACCESS POLICY 11 automated data ingestion, oriented toward easing the man-machine interac-tion, have been defined using a generalised set of labels over an underlying work flow as detailed in section 3.6;
Manage users and monitor system usage and health status.
Expert an Expert user is a domain expert in the thematic covered by the classification maps, with good knowledge of some study areas or interest in modelling some phenomena by its thematic evolution; Expert functional needs are identified as: Have a fast interactive query tool to perform multi temporal visual analysis on large (spatial and time coverage) data archives e.g., to have a differ-ent/broader perspective of a known area or to search new ones presenting unusual characteristics to study;
Identify relevant thematic patterns, both at the pixel or area level; Define evolution models over some identified or hypothesized pattern; Run defined models over the archive to interactively search for its
occur-rences over some Area Of Interest (AOI) and multiple time periods, to take advantage of the search outputs;
As the owner of the defined model, the “Expert” user is responsible to define its access policy and its associated meta-data;
Standard an ordinary system user is assumed to be a decision maker interested in obtaining environmental information derived from analysis over time (e.g. spe-cific land use or other phenomena) that has been modelled to be automatically detected over an AOI at any given period in time; identified needs for that role are:
To have a fast interactive tool delivering high level thematic information to support decision making;
To have a user friendly interface with a simple and effective interaction model.
The MEA system is thus designed with features aimed at providing an innovative integrated environment to satisfy these functional needs; as an interactive system it is also designed to minimize response time perceived by the users to keep a high level
12CHAPTER 2. PERSPECTIVES ON AN INTERACTIVE THEMATIC SYSTEM of responsiveness. As users with different roles access the system with different views on it, i.e. using different interfaces, the contextual view of the reference scenario, manageable with this access control model, is depicted in Figure 2.1. Following the three identified roles, three main views on the system are also defined as interfaces for: Operators/Administrators (OGUI), Expert users (EGUI) and Standard users (SGUI).
Figure 2.1: User access scenario
The presented policy model is designed to allow collaborative joint efforts for the development of a single evolution model by different expert users, possibly belonging to different organizations or not affiliate with any institution. Moreover, a group based model avoids also the implicit limitation of role based control only to editing features in multi-user environments, as it is the case of systems where a user with access to editing functions, an “Editor”, could not only use editing features on its own models but also those belonging to other users without their authorization, unless no collaborative editing is enabled at all.
2.2
Data preparation
As an integrated, general purpose analysis tool, the system is designed to operate on any categorization data that can be mapped on the Earth surface in raster form. The presented implementation, however is focused on the LULCC domain: it is built over land cover maps, obtained by unsupervised classification of satellite data at moderate ground resolution of 1 Km. Use of moderate resolution data brings two advantages: it is well suited for a first system implementation to assess its performances over limited
2.2. DATA PREPARATION 13 hardware resources while providing access to a global dataset with high temporal
frequency. The potential and applicability of the application can thus be verified
providing access to an extensive dataset at global scale. Use of a single data source does not hinder the possibility to define extensions for multi-sensor integration, in fact the selected archive holds data from two very similar sensors with different resolutions, and to build a scalable system that can grow dynamically as further data sources are added. Another advantage from the choice to use (A)ATSR data is to open an unprecedented thematic view over its entire European archive that allows exploring it interactively with a new perspective.
Using two sensors of the same kind, at similar resolutions, the derived maps archive offers also the opportunity to assess across sensor processing performances. The focus on multi-temporal analysis drives the approach at data and dictates how it has to be processed to build a consistent stack that can be used for time series analysis: accurate geolocation and accurate radiometric calibration are the basis for the pre-processing chain in order to attain spatial and radiometric comparability; furthermore, a spectral classification based on prior-knowledge is applied with the aim to provide a sensor independent data layer, consisting of land cover typologies, with a human understandable semantic meaning.
During the development of the system, a strong standardization effort was ongoing in the EO data archives domain toward increased accessibility of data and services; among other events, the Service Support Environment (SSE) reached its operational state providing a generalised web based platform for delivering value adding services to users through a common interface and a defined set of operations with customizable parameters [16]. To promote interoperability and data accessibility, the output maps produced by classification of the entire (A)ATSR archives are also provided as an SSE service, named Advanced Semantic Query system for Large satellite Database (ASQuLD); it enables the provision of search by area and time coverage of the Earthnet OnLine Interactive (EOLI) interface[17] to browse the maps. The extensibility of the standard has been exploited to add thematic content to the search parameters allowing searches on image thematic content. In addition a minimal, yet flexible, custom Order operation that allows full automation in dataset retrieval via File Transfer Protocol (FTP) is added, as defined in section 4.2.2.
14CHAPTER 2. PERSPECTIVES ON AN INTERACTIVE THEMATIC SYSTEM
Figure 2.2: Overall diagram of data preparation elements: the ASQuLD service re-trieves satellite data elements both from archived data and continuously from an up-to-date data source (Rolling Archive), processes it to extract thematic data and publishes it to be accessible to SOAP clients. Its interface allows querying on the thematic con-tent of the classified maps.
chain of the MEA system, that we call the Classified Maps Provider (CMP) as it can be also seen as the extension point toward other thematic domains. An overall diagram of that component is provided in Figure 2.2. Its implementation design is focused on performance and scalability in computing the classification maps: taking advantage of the unsupervised, pixel based nature of the selected classification system, a distributed computation approach is used to build a processing infrastructure that can process the entire archive in less than six months. The distributed approach allows further accel-eration, if needed, by adding processing elements that can also be moved close to the source archive itself to reduce network traffic by transferring only the classified map to the system. The distributed pull model protocol used for data processing is detailed in section 4.2. To ensure best geolocation accuracy, a new geolocation correction module, accounting for the sensor specific geometry and acquisition model was implemented with the support of Rutherford Appleton Laboratory (RAL) scientists that increased the accuracy of the resulting maps.
2.2. DATA PREPARATION 15 MEA archive, designed for interactive access, is built to enable multi-temporal analysis by remapping all data over a common reference system so that the time dimension can cross a consistent spatial data stack. Besides facilitating multi-temporal analysis, the use of grid reference systems “has been recognized as key point for the integration of heterogeneous sources of data”[18]. This approach, complemented with the use of a variable grid size, allows to build a system that can work at different resolutions, in order to exploit data from different EO sensors. The resulting layered reference system is defined in a way suitable for fast computer processing.
Being a global scale application, a widely used system for depicting global maps has been selected to display thematic maps content to users in a two dimensional represen-tation: the plate carr´ee or simple cylindrical projection. That projection is the simplest form of association between map points and their coordinates on the Earth surface (ac-tually on its surrogate ellipsoidal representation), that simplicity can be leveraged to build raster data without the need for associated geo-location information since it can be coded directly in the raster definition: by defining a regular sampling mesh over the standard Latitude Longitude coordinate system, the corresponding digital representa-tion as raster maintains that regularity, resulting in the simple cylindrical projecrepresenta-tion if directly rendered.
This simple approach to sample and represent geographic data has well known lim-itations, as extensively reported in [19] and [20] where it is confirmed to be suboptimal, especially if compared to several kinds of Geodesic Discrete Global Grid (GDGG) that partition the Earth surface using polyhedra as base grid structure making them partic-ularly suited for three dimensional representations such as virtual globes[21] as these have the same dimensionality of the base grid structure. Nonetheless the geographic coordinate system is still by far the most widely used reference system for satellite imagery and its plain representation well known to the user community. The adopted solution, that is basically to define a regular square partitioning over the simple cylin-drical representation of the Earth, is demonstrated to be adequate for the presented implementation at 1-Km resolution, as reported in section 4.3, and to deliver good performances for an assessment of the proposed approach for multi-temporal analysis. Although the efficiency of the adopted solution decreases toward the poles as the dis-tortion produced by its driving representation, it is considered to be still applicable at finer resolutions to assess system performances and set the basis for future research
16CHAPTER 2. PERSPECTIVES ON AN INTERACTIVE THEMATIC SYSTEM on multi-resolution usage of the system. The most relevant drawback of that solution is known to be the absence of equal-area cell regions in the derived grid and this is especially evident for applications near polar regions where a different approach to data sampling would be a better choice.
The solution adopted for the layered, multi-resolution, reference system is basically a Discrete Global Grid System (DGGS) that, according to [19], is congruent and unaligned with respect to the planar representation of the Earth over which it defines an uniform square partitioning, hence well suited for two dimensional display and related operations since it does not require re-projection to the target display and its congruency allows a regular square pixel subdivision at each level. On the other hand the solution is non-uniform with respect to cell areas over the Earth surface, hence not optimal for data storage that is still greatly lightened by the classification process, but still leaves room for optimization, as reported in section A.5. Re-sampling classified maps on the DGGS can be done on any kind of categorical thematic map using the nearest neighbour algorithm, without changing actual class values.
An ingestion system that retrieves maps from the ASQuLD service has been de-signed to perform the re-sampling operation to provide full process automation as a solution to ease the data management and maintenance tasks that are common for satellite data archives, especially for derived products that are subject to changes in the algorithms that generate them, thus potentially requiring periodic, selective re-ingestion. A rule based ingestion controller is implemented and an associated set of rules is defined to drive its operation. To complete the MEA ingestion system depicted in Figure 2.3, storage elements are defined to archive ingested data for interactive ac-cess.
The approach to the data archive is oriented toward exploitation of the natural spatial-domain partitioning that is induced by using a regular sampling over a flat square Earth representation: grid elements are grouped together in uniform Tiles of equal size. Tiles are the basic storage units of the system and their fixed spatial addressing on the grid eases both the implementation of parallel processing solutions and spatial queries efficiency. Efficient storage solutions applicable to data organized in regular grids exists in literature, for example the on disk layout proposed by [22] to accelerate real-time exploration with optimized storage techniques. The advantage of such Out-of-core computing [23] techniques should be investigated as new data layers
2.2. DATA PREPARATION 17
Figure 2.3: Overall diagram of the Automated Data Ingestion system. An automated ingestion component, driven by a set of ingestion rules defined by an administrator, retrieves classification maps from the map provider. Maps are Tiled over the reference grid and stored in the Tile archive for interactive access.
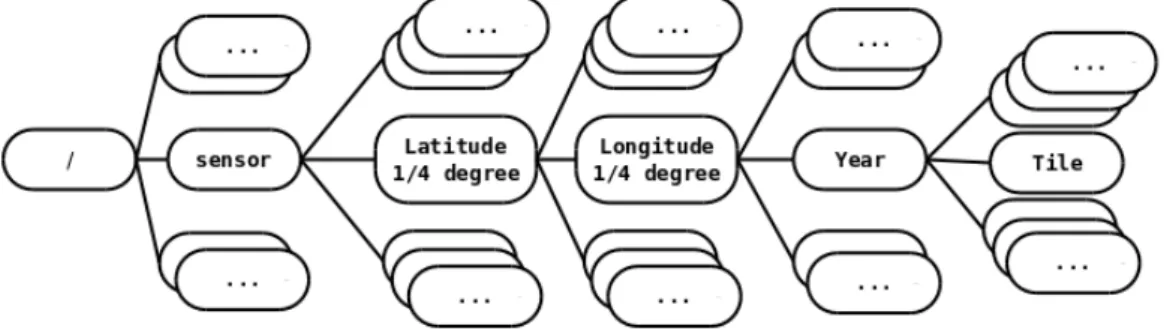
at increasing resolution are added to the system as the advantages obtained with performance oriented data layout restructuring could be applied to the Tile archive. In the presented implementation however, the use of standard files stored on a robust standard file system has been preferred and the spatial partitioning scheme exploited by organizing data into an hierarchical directory tree designed to have leaves (data files) oriented toward the time dimension, as shown in figure 2.4. The geolocation space is partitioned by directories to enable direct mapping between Tile identifiers and file paths. This approach exploits also the operating system cache by organizing directory meta-data content toward the geographic location, accelerating both location of data along the temporal axis and responsiveness to subsequent request related to the same area.
Figure 2.4: Directory tree structure of the Tile storage. The hierarchy is
multi-dimensional: sensor, geographic location and finally temporal reference are used to partition the file system into manageable units.
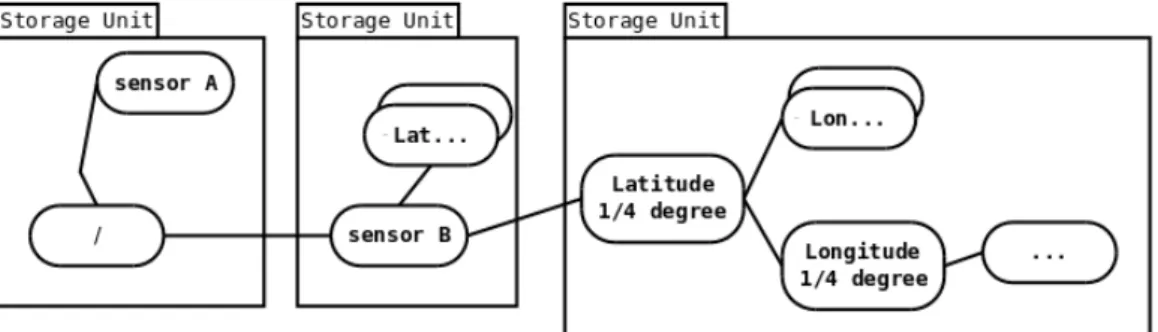
18CHAPTER 2. PERSPECTIVES ON AN INTERACTIVE THEMATIC SYSTEM distribution of data across several file systems on different storage arrays without requiring any customization. As shown in Figure 2.5, different storage units with different size and performance characteristics can be used to store a partition of the archived Tiles by making direct use of mount points within the directory tree.
Figure 2.5: Use of different storage units by direct use of mount points. A file system based approach allows linking and mounting of different storage elements transparently to the software elements managing its content.
Besides the file system based Tile storage, Tile meta-data is organized in a cus-tomized, performance oriented database to provide fast identification of Tiles as fast interactive browsing of the archive is recognized as one of the key success factors for this system. Fast access to Tile meta-data for interactive queries is thoroughly exam-ined with the goal of performing complex spatio-temporal-semantic(thematic classes) queries within few seconds over the entire temporal domain at national scale areas. Besides removal of the real-valued geographic coordinate system in favour of an inte-ger valued Tile addressing scheme, modern Data Base Management System (DBMS) features such as partitioning and clustering, as well as recent technology such as Solid State Drive (SSD) are also employed and tested as means of performance improvement. To be noted also that the data duplication issue toward poles has been assessed but not addressed in this implementation, for example the use of an equal-area projection as the basis for grid definition, such as the sinusoidal, would remove the duplication at the expense of greater geometric distortion or the adoption of different base projections on different zones, as is the case with the Goode Homolosine projection, that gives a raster-friendly equal area representation at global scale with a balanced look for land areas. These solutions would also require further customization toward results display and area of interest management and its representation to the users with respect to the simple cylindrical. Application scope and design choices however, help to mitigate that issue. Firstly the focus on land cover and the cloud detection capability of the
2.3. THEMATIC SEARCH AND EVOLUTION MODELLING 19 classifier allows discarding cloud samples to focus only on valid land cover classes, as clouds are filtered out of the data stack, entirely cloudy tiles are discarded together with those completely over sea. To further mitigate storage issues, temporal resolution is limited to one day, adequate to typical revisit time of moderate resolution satellites, that allows elimination of the multiple acquisitions for a single day approaching the poles, due to the near polar orbit of those satellites.
2.3
Thematic search and evolution modelling
Fast thematic content filtering at single Tile level enabled by the customised meta-data handling is a key element of fast interactive visual display of long time series. Browsing data in a way that aids temporal pattern identification is one of the main goals of the MEA system. An automatic system to search interactively for occurrences of identified patterns across the archive is then added providing a feature unique to this system to further proceed in the analysis process. The provision of a modelling tool to define the identified (or supposed) pattern, that can be readily matched to assess the extent of its occurrence and the visual display of the results again as a thematic map is a simple, yet effective way to provide a versatile tool for interactive visual analysis in the temporal domain. In addition, the option to retrieve search outputs also as plain text files allows external processing systems to make direct use of them.
Automated data analysis techniques, even if very relevant for pattern detection (data mining) in large data archives, require considerable effort in design and valida-tion and can be applied only to specific fields. Our definivalida-tion of evoluvalida-tion model is instead designed to let the user precisely define each model element with tolerance margins in both thematic and time domains while aiding tools are provided to derive model elements from observed data. All the knowledge for multi temporal analysis is provided by domain experts in the form of evolution models (searchable patterns) that provide immediate thematic understanding of the modelled phenomena. This pattern matching approach has been selected as a first analysis tool to demonstrate the capa-bility of an interactive thematic analysis to explore and exploit satellite data focusing on the temporal domain, it lays also the basis for the introduction of more automated techniques in the integrated environment.
In the MEA context, an evolution model element, or simply Model Element (ME) defines an association between a given set of categorical values (thematic classes) and a
20CHAPTER 2. PERSPECTIVES ON AN INTERACTIVE THEMATIC SYSTEM temporal reference, defining “when” that set is expected to be observed. An Evolution Model (EM) is in turn defined as a sequence of model elements, positioned along the temporal line by relative time references. In the LULCC domain, an evolution model defines a sequence of land cover classes that are expected at given times to model the land cover evolution over time. As a sequential pattern, an evolution model can be quickly matched with actual time series data at the pixel level, to determine if that data matches the modelled evolution pattern. The suitability of change patterns over time to identify relevant phenomena has been confirmed in agriculture[12] and its applicability to define also transition phenomena to identify changes of interest directly derives from the temporal attributes of such changes (e.g. burned areas identification imply a change in the land cover of the affected area as do flooding events).
The proposed evolution model matching is a form of change analysis that, accord-ing to the topology summarized in [9], falls in the “classification” category and in particular, it is a form of the commonly used post-classification comparison; it is com-bined with pattern matching to provide comparison at an arbitrary set of time intervals to detect an evolution pattern over time, thus realizing an automated multi-temporal search tool applicable for fast, on-demand time series analysis.
One foundational basis of the system in the LULCC field, the evolution of land cover classification over time, based on spectral analysis of principal measures, can lead to the identification of land use typologies and to the contextual detection of major disturbances (areas of rapid land-use / land-cover variations). The key to the automatic identification of relevant evolution patterns is the definition of a correspond-ing evolution model that can be systematically used to determine if a given series of observations conforms to the modelled pattern.
Being a post-classification system, its accuracy is strongly dependant on the ac-curacy of the underlying classification system, in fact it can be at most as accurate. Single image classification depends instead on the resolution of the underlying data, since land cover changes must be discriminated by the sensor for the classification system to detect a different pixel class. The effect of mixed pixel acquisition is also a known source of misclassification for systems based on pure spectral signatures: the higher the resolution detail, the less mixed pixels would occur with respect to identified typologies. The SM classifier detects classes that are suitable for global to local scale applications as it is pixel based and independent from the geometric appearance of
2.3. THEMATIC SEARCH AND EVOLUTION MODELLING 21 data. It is still affected by the acquisition geometry that leads to mixed pixels and, although an accurate study of this effect at different resolutions is not part of this work, advantage from the availability of MEA can be taken immediately by using it as an investigation tool toward mixed pixel effects, using its multi-level grid system and display features over areas with low distortion.
With respect to sequential pattern matching alone, which leads to a yes/no response from the search for an exact match, evolution models feature two kinds of tolerance parameters that change pattern detection behaviour. Changing tolerance parameters, a high degree of detection flexibility can be obtained:
To identify relative position of elements in the sequence along the temporal line, their temporal reference is defined with respect to the element preceding them in time so that the pattern is independent of absolute time references, making it applicable at any point in the time line.
Each element is designed to detect a particular set of values, and a tolerance set is also admitted to let the user evaluate the incidence of selected values over the result and to divide the results into two levels of confidence. To cope with possible misclassification, values to be ignores can also be specified;
Besides sets of values, a model element defines “when” those sets are to be found by means of its temporal reference. Since it is common to not have daily acquisitions (for polar orbiting satellites, revisit time is in the order of several days) and to have invalid observations that are not applicable to the domain (e.g. clouds for land cover), there is the need to introduce some flexibility in the pattern to let the model accept data not only at the day referred by its temporal reference: the Time Tolerance (TT) of an element defines the radius in days of a temporal interval, centred on the element’s temporal reference, as its sampling window over the time dimension.
Another option considered for model matching is whether an element will eval-uate just the closest available value to its temporal reference or search all the values covered by it. A “persistent” element can be useful in defining a limit to accepted variability over some time window during the search for a match or to require a uniform coverage type.
22CHAPTER 2. PERSPECTIVES ON AN INTERACTIVE THEMATIC SYSTEM An algorithm to perform the matching has been defined and a distributed processing engine built to allow its use to search over an AOI and one or more temporal intervals. With the aforementioned extensions, a pattern match can deliver four different results for any given pixel and time reference pair: Perfect Match, Match within Tolerance, Not Match and No data (i.e. possible match but not enough data to test all elements). A match is tested by assigning a position in time to the first element of a model, then analysing observed data as detected by all model elements at their respective temporal reference.
2.4
User Interfaces
Any system foreseeing user interaction has to provide some kind of interface to its users; for software systems designed for visual analysis a graphical interface is an effective choice and can be one of the main factors driving its success in being used effectively and with satisfaction by its users. The interfaces designed for MEA are tailored to its specific purpose, context and user typologies while still presenting well known elements for any Geographic Information System (GIS) application. Three interfaces are defined to provide a different view of the data and access to different functions following the three main user roles.
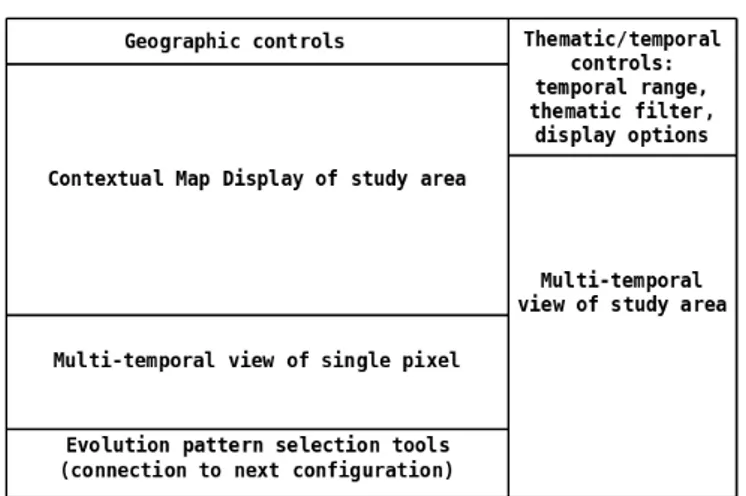
The interface for users in the “Expert” role provides access to all multi-temporal analysis features of the system, with the aim to aid the user detecting relevant patterns in the thematic data over time. A geographic map browser is provided, common to virtually every two dimensional GIS interface, along with interface elements focused toward the temporal domain, such as a complete profile of a given pixel over time and the dynamic display of Tiles time series. Tree dimensional effects were also considered for some interface elements but they have been discarded as a limiting factor due to their tendency to overlap data elements, thus impeding their full visibility to the user. The layout of the expert interface is designed along the three essential steps of the research sequence, as reported in [3]: an exploratory phase where data is explored to formulate an hypothesis (visual browsing of data, pattern detection and modelling), a confirmatory stage where the hypothesis is tested (automated pattern matching and visual analysis of results, numerical analysis versus external data). Once confirmed, the hypothesis is then made public for others to take advantage of it (a model be-comes usable also by “Standard” users). As the interface for users in the “Standard”
2.4. USER INTERFACES 23
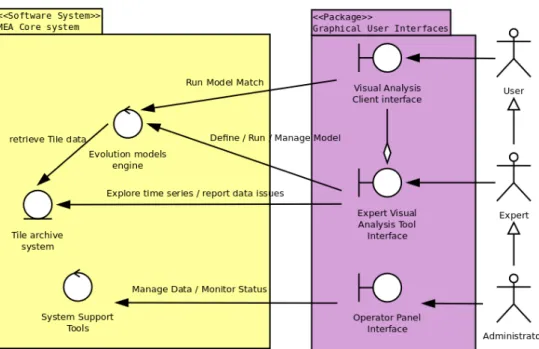
Figure 2.6: Overall diagram of user interfaces with main functions provided. Three different interfaces are defined to provide different views of the system and different sets of functions to users in different roles. These are backed by the Tile archive, the Evolution Models engine and a set of system administration tools.
role coincides with the confirmatory function of the Expert interface (although with reduced options), it becomes seamless to deliver an effective, verified pattern to the user community thanks to the system integration. Meta-data is also associated to each model to define how it has to be used to effectively search through the time series for a modelled phenomena. Finally, management interfaces and cooperative reporting functions are made available to let the user community become a direct resource for system improvement. By reporting issues in archived data its quality improves as its error rate decreases; collaborative effort in pattern validation and modelling is also possible. A top level overview of the MEA user interface system is depicted in Figure 2.6 where main functions of the interfaces are represented as labelled messages arrows. Interactive analysis, the main function of MEA interfaces, requires high respon-siveness to user actions and interface accessibility is another key factor to obtain user satisfaction. Recent developments in Internet technologies make the World Wide Web the ideal application distribution channel, especially for multi-user applications that can take advantage of the proximity of the computing elements engine to the data archives. With the added advantage of immediate application update dissemination by design as the application accessed over the web is always presented to the users in its
24CHAPTER 2. PERSPECTIVES ON AN INTERACTIVE THEMATIC SYSTEM most up-to-date version. The Asynchronous JavaScript and XML (AJAX) approach to web applications[24], coupling rich features with high interface responsiveness, of-fers the opportunity to deliver rich features for interactive exploration of time series directly over the web making them readily accessible with a modern web browser, with very limited resource requirements to the user. The functional diagram provided in Figure 2.6 omits the container component serving the user interfaces and allowing such delivery model: a web server supporting server side programming for the AJAX asyn-chronous functions. The interfaces are also assessed for their Usability[25] as perceived by a limited set of test users.
2.5
Hardware and performances
Hardware used for prototype implementation of MEA has been sized to deliver a proof of concept system, yet efficient and adequate for use by an initial small community of users in an operational environment. It has been also tailored towards Tile meta-data access performance to ensure high interactivity while browsing data and it is designed to run on commodity hardware with no specialized components.
The reported implementation of MEA has been built in two steps: a semantically searchable catalogue of land cover maps over the entire (A)ATSR archive has been built as a Web Service: at this point we provided basic ”image content” search capability
allowing queries based on land cover type percentage in single images. Then the
evolution analysis system to interactively browse through the temporal domain and search for occurrences of a given sequential pattern in time at pixel level was added; the addition included a second batch of hardware to store the Tile archive and provide a fast meta-data catalogue. Thus, the system hardware comprised two batches of different systems that, paired with reuse and share resource strategy, led to the final configuration of:
One central storage and controller unit, that has also been reused to host the core web server, hosting both the MEA application and the ASQuLD maps catalogue service. A Direct-Attached Storage (DAS) unit was added with the second batch to provide Tile storage;
Two Processing Nodes (first batch); devoted to systematic ingestion of satellite data to build the classified maps catalogue, that are also used to host model
2.5. HARDWARE AND PERFORMANCES 25 matching processing;
Two Database Nodes (second batch); dedicated to fast meta-data access (em-ploying also SSD technology), model matching processing and also systematic ingestion in addition to the processing nodes.
Performance
The target implementation over limited, heterogeneous hardware resources promoted the design of distributed processing components and a policy to share that hardware among all software components to deliver high performance for burst-load operations addressed to user interaction and continuous processing for data ingestion and back-ground operations. The Linux kernel scheduler offers process niceness level[26] that has been used to give adequate prioritization to the system functions to provide adap-tive (prioritized) hardware utilization, according to the following performance priority requirement of each function:
1. Data selection queries for Tile identification have top priority as they provide high responsiveness to interactive browsing and data exploration on the user interface: database functions run at slightly above normal niceness level;
2. Model matching computation must deliver high performance as it provides re-sults to the multi-temporal thematic search, it however depends on the database function and is thus run at normal niceness level;
3. Systematic data ingestion has the lowest priority with respect to the other inter-active functions hence, it is given background priority.
During development, all components underwent performance monitoring and anal-ysis aimed at detection of anomalies and system improvement where feasible.
Chapter 3
Multi-temporal analysis system
This chapter provides a conceptual description of the MEA system aimed at realizing a generalised, integrated solution for multi-temporal analysis over geographic sets of thematic raster data. Without loss of generality, the specific case of land cover classifi-cation is considered since the system implementation is based on land cover maps. The methodology is aimed at building a comparable set of data in the thematic-temporal domain that, consisting of thematic data (semantically identifiable), is readily under-standable by humans so that interactive visual browsing can be effectively employed as an analysis tool. The visual presentation of data to the user is aimed at easing the identification of relevant patterns in the classification over the temporal domain and aiding tools are provided to formally define such patterns as Evolution Model that define an expected thematic behaviour over time at pixel level. The formal definition of patterns enables the definition of a multi-temporal search engine that can be used to test for occurrence of a given pattern in a subset of the data archive. The integration of thematic maps, graphical interfaces with tools aimed at easing pattern detection and a modelling tool for pattern formalisation, allows the execution of interactive thematic searches in the temporal domain that can be performed on the thematic evolution over time of each image pixel in time series of satellite data. The result of such search can itself be effectively represented as a thematic map to be readily accessible for an assessment of the occurrence extent of the modelled evolution.
The practical use of the presented approach becomes evident when considering that a given evolution of thematic data over time (such as land cover class) can be used to describe a given phenomenon (such as an agricultural practice, that can be identified by its seasonal cycle or any transitional event such as flooding or deforestation); the particularity of a formalised pattern is to be clearly understandable to the user and its