UNIVERSITA’ DELLA CALABRIA
Dipartimento di Farmacia e Scienze della Salute e della Nutrizione
Dottorato di Ricerca in MEDICINA TRASLAZIONALE
CICLO XXXI
Benefits of advanced techniques and data
processing for the analysis of complex biological
and food matrices
Settore Scientifico Disciplinare CHIM/08
Coordinatore: Ch.mo Prof. Sebastiano Andò
Supervisore/Tutor: Ch.mo Prof. Gaetano Ragno
Dottoranda: Dott.ssa Claudia Spatari
Benefits of advanced techniques and data
processing for the analysis of complex biological
Index
RIASSUNTO DELLA RICERCA ... 4
INTRODUCTION ... 7 1. ANALYTICAL METHODOLOGIES ... 11 1.1Liquid chromatography ... 11 HPLC-DAD ... 11 LC-MS ... 12 1.2 Spectroscopy ... 14 FTIR-ATR ... 14 UV-VIS ... 14 1.3 Photodegradation testing ... 15 1.4 Chemometrics ... 18
2. ANALYSIS OF FOOD MATRICES ... 23
2.1 Assessment of adulteration of breast milk by coupling FTIR spectroscopy and chemometric analysis. ... 23
2.1.1 The Human Milk Bank ... 24
2.1.2 Experimental ... 26
2.1.3 Results and Discussion ... 27
2.2 A critical evaluation of the analytical techniques in the photodegradation monitoring of edible oils ... 33
2.2.1 Experimental ... 37
2.2.2. Results and Discussion ... 39
2.3 Photo and thermal stress of linseed oil and stabilization strategies. ... 47
2.3.1 Experimental ... 48
2.3.2 Results and Discussion ... 51
2.3.3 Photoprotection strategies ... 56
3. ANALYSIS OF BIOLOGICAL MATRICES ... 60
3.1 Monitoring of anesthetic drugs in the cord blood during labor analgesia. ... 60
3.1.1 Cord blood bank ... 61
3.1.2 Drugs crossing the placental barrier ... 65
3.1.3 Therapeutic protocols in analgesia ... 67
3.1.4 Experimental ... 68
3.1.5 Results and Discussion ... 69
3.2 Bioanalytical assay for quantification of lorlatinib in mouse plasma ... 79
3.2.2 Results and Discussion ... 85
4. ANALYSIS OF PHARMACEUTICAL MATRICES ... 92
4.1 A new generation of dihydropyridines: photodegradation and photostabilization strategies ... 92
4.1.1 Synthesis of new dihydropyridines ... 96
4.1.2 Experimental ... 99
4.1.3 Result and Discussion ... 100
CONCLUSIONS ... 109
Vantaggi nell’uso di tecniche e elaborazione dati avanzate
nell’analisi di matrici biologiche e alimentari complesse
RIASSUNTO DELLA RICERCA
Durante i tre anni di dottorato in Medicina Traslazionale, il mio lavoro di ricerca si è concentrato sull'applicazione di tecniche analitiche avanzate e sull'elaborazione dei dati per lo studio di matrici complesse biologiche e alimentari.
Recenti studi hanno dimostrato che in circa il 10% dei campioni di latte materno acquistato online è presente DNA bovino che dimostra adulterazione intenzionale. I rischi associati al consumo da parte del neonato di latte umano adulterato con contaminanti animali o altro sono molti e gravi, tra cui carenza di ferro, disidratazione, aumento del potenziale di carico di soluto renale (PRSL) e reazioni allergiche, motivo per il quale risulta fondamentale la ricerca di eventuali adulteranti nel latte materno.
L'applicazione di tecniche chemiometriche sullo spettro IR del latte materno si è dimostrata molto efficace nel tracciare anche minime variazioni nella composizione e nelle caratteristiche del latte umano, essendo in grado di sfruttare le informazioni non specifiche memorizzate nello spettro IR. In questo caso, l'elaborazione delle impronte digitali spettrali ATR-FTIR mediante regressione PCA e PLS, è stata in grado di rilevare l'aggiunta fraudolenta di acqua o latte di mucca. In particolare, la tecnica PLS-DA è risultata essenziale per riconoscere il latte materno puro dal latte adulterato. Un'ulteriore definizione di quattro modelli PLS1 ha consentito inoltre la determinazione della quantità di adulteranti specifici aggiunti.
La ricerca sulle matrici alimentari è stata estesa a una serie di oli commestibili al fine di verificare la loro fotostabilità. Tecniche di irradiazione forzata, in combinazione con analisi spettroscopica UV-vis, FTIR-ATR e cromatografica HPLC-DAD, hanno mostrato cambiamenti quantitativi e qualitativi dei principali acidi grassi.
La ricerca si è concentrata in seguito sull'olio di lino, data la sua grande importanza come alimento funzionale. Anche in questo caso, la spettroscopia UV e l'HPLC hanno
rivelato cambiamenti significativi nella concentrazione di acidi grassi, ridotti al 35% dopo 48 ore di esposizione alla luce. La quantità di lignani, altri importanti componenti nutraceutici, ha invece mostrato una significativa stabilità. La fotoprotezione dell’olio di lino è stata in seguito dimostrata dall’uso di contenitori di vetro ambrato associato all’aggiunta di ascorbil palmitato quale agente antiossidante. I risultati ottenuti sono importanti per aumentare la durata di conservazione dell'olio di semi di lino o di altri oli commestibili, mediante l'adozione di formulazioni appropriate e accurata protezione fisica.
Il monitoraggio dei farmaci nei fluidi biologici ha rappresentato un altro argomento importante del mio lavoro di tesi. Particolare attenzione è stata rivolta allo sviluppo di un metodo analitico per il monitoraggio della quantità dell’anestetico bupivacaina nel sangue del cordone ombelicale. La determinazione del farmaco è stata definita mediante un metodo di estrazione SPE seguito da analisi HPLC e GC-MS. Questo studio sta procedendo con l'analisi di un gran numero di campioni reali, al fine di valutare la sicurezza degli anestetici somministrati durante il parto naturale e nel contempo ottimizzare il protocollo terapeutico attualmente utilizzato in partoanalgesia.
Un'esperienza fondamentale durante il dottorato è rappresentata dal periodo trascorso presso un laboratorio di ricerca dell'Università di Utrecht in Olanda. Qui ho avuto l'opportunità di studiare per un semestre (dal 26 settembre 2016 al 27 Marzo2017) presso il laboratorio di ricerca guidato dal prof. Rolf Sparidans. In tale occasione ho approfondito le mie conoscenze sull'uso della cromatografia LC-MS/MS applicata allo studio della farmacocinetica di nuovi farmaci antitumorali. In particolare ho partecipato allo studio di un saggio bioanalitico del farmaco lorlatinib, un inibitore ALK di terza generazione. La preparazione del campione e l'ottimizzazione delle condizioni cromatografiche sono state le fasi più impegnative del lavoro essendo stato il primo test sviluppato e validato per questo prodotto. Una procedura LC-MS / MS è stata ottimizzata e validata sul sangue di topi al fine di stabilirne le proprietà farmacocinetiche.
Ancora presso il gruppo di ricerca dell’Unical, parte dell’attività di ricerca è stata svolta su matrici farmaceutiche. In particolare si è studiata la stabilità in soluzione acquosa e alla luce di una 1,4-diidropiridina (siglata M3) di nuova sintesi, data la nota scarsa solubilità e fotolabilità di questa classe di farmaci. Una serie di tensioattivi, tra questi i tween, è stata testata per promuovere la solubilità in acqua, ottenendo risultati incoraggianti con l'uso del tensioattivo non ionico Tween20. Successivamente, la fotostabilità del complesso M3-Tween20 è stata studiata vagliando la capacità fotoprotettiva del materiale di diversi contenitori: quarzo, PET blu, PET ambrato, vetro scuro rivestito. La migliore fotoprotezione è stata garantita dal PET ambrato e dal contenitore in vetro scuro. I risultati ottenuti dimostrano che l'uso combinato di tensioattivi e contenitori specifici rappresenta una strategia interessante da applicare ai farmaci fotolabili e a carattere prevalentemente lipofilo.
Benefits of advanced techniques and data processing for the
analysis of complex biological and food matrices
INTRODUCTION
The issue of quality assurance in the analytical chemistry laboratory has become of great importance in recent years. Several analytical approaches have been developed for the study and analysis of complex chemical systems and most of them aim at the determination of different contaminants in organic, pharmaceutical and food matrices. The analytical techniques applied to these chemical systems, in particular the chemical-physical methodologies, have shown an impressive evolution, being able to perform a large number of determinations from a single sample, simultaneously and rapidly. In this context, an important support has been given by chemometry, a branch of analytical chemistry that uses mathematical-statistical methods for the resolution of analytical problems.
During my three-year PhD, advanced analytical methods have been applied for these aims:
1. To determine enviromental or pharmaceutical contaminants in breast milk and human blood samples;
2. To evaluate the photostability of edible oils and drugs through stressing irradiation test.
Breast milk is the most important and complete food for a newborn because is rich of protein, fats and carbohydrates. Thanks to its composition, human milk results healthy, species-specific, preventive against allergies, intolerances and diseases [1-2].If a mother provides a low amount of milk or the composition of her milk results unable to satisfy newborn’s necessity, the use of donated milk is very important [3-4]. Commercial infant-formula is an alternative but human milk is often preferred by mothers [5].
Because of the vigorous screening and multi-step strict processing of Human Donated Milk Banks present all over the world, the milk is mainly available by a physician's prescription and for high-risk infants (typically premature or ill) residing in the Neonatal Intensive Care Unit (NICU). So, the lack of availability of breast milk forces individuals to search to the community for donor human milk (DHM) [6-7]. However, the phenomenon of milk sharing is very dangerous [8] because purchased human milk may be subjected to milk adulteration (i.e., diluted with another form of milk). Recent studies showed that there was cow DNA in 10% of the breast milk samples bought through online community, in amounts (~10% contamination) that would reveal intentional adulteration [9]. The risks associated with infant consumption of plant or animal adulterated human milk are many and serious including iron deficiency, dehydration, increased potential renal solute load (PRSL), and allergic reactions [10-15].
Another important area of research on biological fluids is the monitoring of drugs in the cord blood. Many studies report damages in children caused by anesthesia such as respiratory depression, poor fetal positioning and increased fetal heart rate variability. So, the evaluation of the amount of drug in the cord blood acquires a significant value [16]. At the same time, the development of bioanalytical assay for the quantification of drugs in plasma results fundamental to test novel drugs [17]. The study of the effect of light on food matrices, in particular vegetable oils, is also of considerable importance. Our study focused mainly on the thermal and photo stability of different seed oils and in particular of the linseed oil.
Regarding the pharmaceutical matrices, our focus has been on the dihydropyridine compounds, the most commonly used as antihypertensive drugs but characterized by significant photoinstability. The oxidation to the pyridine derivative represents the first, and in many cases the only, step of the degradation mechanism. Photodegradation process leads to a loss of pharmacological activity and formation of toxic products. For this reason, several analytical techniques have been proposed for DHP determination in the presence of their photoproducts. According to their instability to light, DHPs are all marketed in solid formulations, especially tablets,
because photodegradation is particularly fast in solution [18]. For this reason, the evaluation of new strategies to realize stable-liquid oral formulation of novel DHPs was the object of one section of my research work.
During my three-year PhD course, I had the opportunity to study for a semester at the research laboratory led by prof. Sparidans, at the University of Utrecht, the Netherlands, where I deepened my knowledge on the use of chromatography LC-MS/MS applied to the pharmacokinetic study of new anticancer drugs.
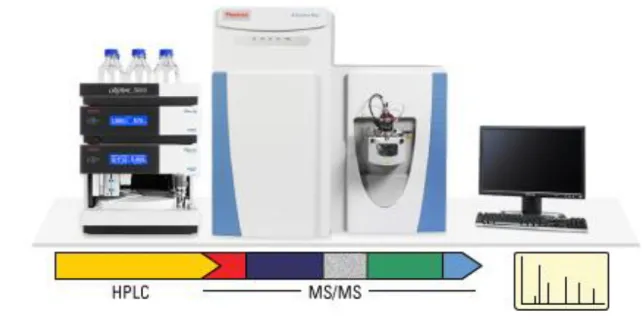
In the following figure the main topics studied are schematized.
Evaluation of breast milk sophistication and adulteration;
Identification and quantification of drugs in cord blood;
Development of a bioanalytic assay to quantify antitumoral drugs in plasma;
1. ANALYTICAL METHODOLOGIES
Instrumental analysis is a field of analytical chemistry that investigates analytes using scientific instruments. The most used techniques are based on spectroscopy, mass spectrometry and chromatography. In the last decades, instrumental analysis has been coupled with the multivariate analysis of experimental data. Chemometric methods are versatile and can be applied to data obtained from the use of most modern analytical techniques. In the following paragraphs, the analytical and chemometrics techniques used in my work are illustrate in detail.
1.1Liquid chromatography
HPLC-DAD
The liquid chromatography of high performance (HPLC), is an effective and versatile technique and represents the natural instrumental evolution of low-pressure column chromatography. Its peculiarity is that in a few minutes it can separate very complex mixtures and determine the quantitative composition together with information on the chemical nature of the substances. It is one of the most widely used chromatographic techniques in both industrial and medical -scientific research. (Fig. 1)
Among different kind of detectors, the diode array detector (DAD) is one of the most useful in analytical chemistry. DAD has two light sources: a tungsten lamp which is the source of visible light and a deuterium lamp which is the source of ultraviolet (UV) light. The UV lamp is in the light path of the visible lamp. The flow cell is positioned before the grating so by time light arrives at the grating, the intensity of the light at certain wavelenghts has been attenuated. The amount of attenuation is dependent on the type and amount of compound eluting through the cell as well as the lenght on the cell (typically about 10 mm). (Fig. 2)
Figure 2. Scheme of diode array detector (DAD)
In my lab, HPLC analysis of food and drug samples was carried out by using a HP 1100 pump fitted with a diode array detector G1315B (Agilent Technologies) and a Rheodyne 7725 manual injector. The LC column was a C18 Gemini (Phenomenex), 250 4.6 mm x 5 mm.
LC-MS
Liquid Chromatography - Mass Spectrometry (LC/MS) is an analytical technique for identification, quantitation and mass analysis of a wide variety of non-volatile or semi-volatile organic or inorganic compounds in a mixture.
The principle of LC-MS/MS is based on the fragmentation of charged ions and the detection of the resulting fragment. This method usually is a reverse phase chromatography, where the metabolite binds to the column by hydrophobic interactions in the presence of a hydrophilic solvent and is eluted off by a more hydrophobic solvent. As the metabolites appear from the end of the column they enter the mass detector, where the solvent is removed and the metabolites are ionized.
The metabolites must be ionized because the detector can only work with ions, not neutral molecules. And ions only fly through a vacuum, so removal of the solvent is the first step. The mass detector then scans the molecules it sees by mass and produces a full high-resolution spectrum, separating all ions that have different masses. (Fig.3)
Figure 3. Scheme of LC-MS
Even if this tecnique has very highly sensitivity and selectivity, the major limit is represented by the matrix effects, that can be an issue and it also need a strict investigation to optimize method validation.
In order to develop the bioanalytical assay here described, the Shimadzu (Kyoto, Japan) chromatographic system charactherized by a DGU-14A degasser, two
LC10-ADvp-μ pumps, a Sil-HTc autosampler and a CTO-10Avp column oven was used. Plasma samples were injected (5 μL) on a Varian Polaris C18-A (50×2.0 mm, 3 μm, Varian, Middelburg, The Netherlands), protected by an Agilent Polaris C18-A Chromsep guard cartridge (10×2.0 mm, 3 μm, Agilent, Santa Clara, USA).
1.2 Spectroscopy
FTIR-ATR
For the analysis of breast milk and oil samples, FTIR analysis was performed with FTIR spectrophotometer (Perkin Elmer Spectrum-two) characterized by ATR sampler (attenuated total reflectance). The ATR sampler allows direct analysis of the sample without any pretreatment. This is an emerging analytical technique that has good sensitivity and repeatability. The sample is placed in close contact with an optical element consisting of a crystal with a high index of refraction. The IR beam passes through this element, originating a reflected ray that can penetrate up to a thickness of 2 μm in the sample. As a result of the radiation absorption from the sample, an attenuated radius is generated which is recorded as an ATR spectrum rich in analytical signals typical of the sample. (Fig. 4)
Figure 4. Scheme of FTIR-ATR
UV-VIS
Ultraviolet-visible spectroscopy (UV-Vis) refers to absorption spectroscopy in the ultraviolet-visible spectral region. Precisely it uses light in the visible and adjacent (near-UV and near-infrared (NIR)) ranges. UV/Vis spectrophotometer is used in the quantitative determination of concentrations of the absorber in the solutions of
transition metal ions and highly conjugated organic compounds. The Beer-Lambert law states that the absorbance of a solution is directly proportional to the concentration of the absorbing species in the solution and the path length. Thus, for a fixed path length, UV/Vis spectroscopy is a perfect tool to determine the concentration of the absorber in a solution. The absorbance changes with concentration. This can be taken from references (tables of molar extinction coefficients), or more accurately, determined through building a calibration curve. (Fig.5)
Figure 5. Scheme of Uv-vis spectrophotometer
The degradation process of both oils and drug was monitored by UV-vis spectrophotometric analysis, carried out on an UV spectrophotometer Agilent 8453 with diode array detector (Agilent Technologies, CA, USA).
1.3 Photodegradation testing
The stressing irradiation tests were conducted by using an irradiation device that respects the ICH directives about the nature of the light source.
The Suntest CPS + (Fig. 6) provides information about the long-term response of the product exposed to light, particularly solar radiation. The instrument is the ideal
equipment for routine tests during production phases or for simulating the display of new materials. The device is equipped with an electronic system (CPS, Controlled Power System) that offers constant control over irradiation, allowing a good reliability in providing a reproducible test. The microprocessor controls the whole unit, in particular the sensor for irradiation, the temperature and the internal standard for its measurement, and allows to program and check each step of the test through pre-established programs.
The radiation system consists of a Xenon arc lamp and a quartz filter that permits the emission of a light spectrum with distribution of wavelengths very similar to sunlight. A series of glass filters of various kinds are available for the selection of certain spectral zones. The great advantage of this equipment is to produce faster results, suitable for carrying out accelerated stability and, above all, reproducible, regardless of variations in sunlight depending on the season, time and place. The unit is equipped with a cooling unit which reduces the temperature of the test chamber under conditions of maximum irradiation to approximately 20 °C.
Figure 6. Suntest CPS+
Instrumental parameters:
Radiation range between 300 and 800 nm
Radiation power between 250 and 765 W /m2
Filters:
Special UV glass for outdoor light simulation (> 290 nm)
Window glass (> 310 nm)
Solar ID 65 glass, in combination with window glass (ICH standards).
The following diagram shows the spectrum of sunlight and the one produced by the Xenon lamp mounted on the instrument.
In the following diagram, instead, the spectral region is reported in detail between 250 and 450 nm, with the comparison between the radiations obtained through the filters that cut the spectrum below 290 nm (UV glass) and 310 nm (Window glass).
1.4 Chemometrics
The complexity of the spectra and the high number of variables involved in the complex analytical systems require chemometric procedures to ensure the validity of the results.
Chemometrics allows a multivariate approach to the process to be studied by taking into account all the variables involved, allowing to make the most of all the information contained in the data to be analyzed. The variables potentially involved are numerous, they are not all controllable with the desired precision and many are not exactly aware of the relevance for the problem under examination. Moreover, in most cases, the correlations between the variables and their non-linear effects or non-predictive non-linearities, which make the analytical approach even more difficult, are not known. Chemometrics is very useful for the possibility to monitor and study the effect of the process variables, making them vary together. This allows the maximum information to be extracted from any data set.
According to this concept and considering the amount of data obtained from complex systems, it is essential to distinguish the useful information in the experimental data and exclude all information useless for our analysis, such as the presence of
experimental noise, redundant information due to correlation between variables, good information not directly useful for the problem analysed.
Among the existing chemometric techniques, those mainly used in this thesis work were:
experimental design (Design of Experiments, DoE),
exploratory analysis (Principal Component Analysis, PCA),
multivariate regression (Partial Least Squares, PLS);
classification methods (Partial Least Squares-Discriminant Analysis, PLS-DA).
Multivariate Curve Resolution-Alternating Least Squares (MCR-ALS).
Principal component analysis (PCA) provides to extract the main information from a data matrix and express this information by projection of the samples on a set of new orthogonal variables called principal components (PCs). When PCA is run, the amount of original variables is reduced to a few PCs that contain the main information stored in the original data. The PCs are built such that the first one carries most information, followed by the second one carrying less information, and so on. When the number of PCs increases, the variance contained by the new PCs can belong to the instrumental noise. The algorithm NIPALS (Non-linear IterativePartial Least Squares) was used to calculate the PCs.
PLS regression is a factor analysis method, very useful in the processing of spectroscopic data for the calibration analysis of complex mixtures [19,20].
In applying PLS procedure, the spectroscopic data (descriptor variables) are arranged in a matrix X (n, m) while a second matrix Y contains the concentration data (response variables). The algorithm PLS1 is adopted in presence of one vector y, while PLS2 regression is applied for a matrix Y (n, k) in which the components or classes are more than one (k > 1). X and Y are mean-centered and then decomposed in factors. Consecutive orthogonal factors are selected with the aim to maximize the covariance
between descriptors and responses. PLS modelling is achieved when the factors that explain most of the covariation between both data sets are found.
In PLS-DA, Y-variable takes on value 1 for the samples belonging to the class and 0 for those not belonging to the class. In calibration, the Y values correspond to the sample composition [21,22], and specifically to the amount of milk adulteration in this study. A PLS model can be validated by internal and/or external validation procedure. Full cross-validation (FCV), a well-known internal procedure, provided a direct estimate of the error rate incurred by the model. The number of factors was chosen by evaluating the parameters root mean square error of cross validation (RMSECV) and correlation coefficient R2. The prediction performance of the PLS models was evaluated by an external validation by using new samples (not enclosed in the calibration step). The obtained results were discussed by comparing the figures of merit root mean square error of prediction (RMSEP) and percentage error in predicted concentrations (RE%), calculated as follows:
RMSECV or RMSEP = √∑ ( n i=1 ci - ĉi)2 n RE(%) = 100√∑ ( n i=1 ci - ĉi)2 ∑n 𝑐𝑖2 i=1
where, ci and ĉi are, respectively, the known and calculated percentage of milk adulteration in sample i and n is the total number of samples in the validation step. The photodegradation processes of drugs was monitored by spectrophotometric analysis and the data were processed by MCR techinique to estimate spectra and concentration profiles of the components envolved. The first step in this procedure is to construct a data matrix D. The samples (individual spectra) are defined in the rows of this matrix, while in each column we find the UV-Vis absorption values measured at a length of spectrum wave. A DK data matrix is so obtained that can be
represented assuming a binary model based on the distribution of several wavelengths, applicable with the Lambert-Beer law:
DK = CKST + EK
where the rows of the DK matrix are the spectra collected at different reaction times and the columns are the kinetic signals recorded at various wavelengths. CK is the matrix of the concentration profile of the compounds involved in the kinetic process, while ST is the matrix of the relative pure spectra, finally, E
K represents the matrix of the non-modeled residual data or variance not explained by the model:
In the MCR analytical approach, a first phase evaluates the number of components that appear within the data of the DK matrix. This step is performed by a rank analysis of the DK matrix, through the Singular Value Decomposition (SVD) technique., an effective algebraic tool that, calculates the highest singular values associated with the most relevant compounds.
Subsequently, the initial estimates of ST or CK can be obtained by using two chemometric techniques based on the identification of the respective variables of spectra or concentrations, SIMPLISMA and Evolving factor analysis (EFA).
Regardless of which technique is used to obtain an estimate of ST or C, these are iteratively optimized, according to a regressive constraint procedure, called Alternating Least Squares (ALS). At each iteration, new values of the matrix of the ST spectra and of the matrix of the CK concentrations are obtained, alternatively solving the following two least-squares equations:
CK = DK (ST) + ST = (CK) + DK where (ST)+ + e (C K) +
they are the pseudo-inverse respectively of the ST and CK matrices. After each iterative cycle, a new reproduction of the DK matrix is produced, starting from ST and
CK. Finally, when the convergence practice is finished, the optimization process can also be defined as concluded. The convergence criterion can be established by a pre-established number of iterative cycles or, more often, can be deduced from the numerical finding of the lack of fit (LOF), obtained in two consecutive iterations. The LOF, ie the lack of adaptation, is calculated according to the expression:
where dij is the experimental absorbance at reaction time i and at the wavelength j and d * ij is the absorbance obtained with the MCR-ALS model. When the differences between numerous fit obtained from consecutive iterations are below a threshold value, the optimization is completed. Another parameter used to indicate the quality of the adaptation obtained from the MCR-ALS is the percentage of explained variance or percentage of variation explained, indicated with r2 and calculated according to the following equation:
The software used is MATLAB, a high-performance language for technical computation that integrates calculation, visualization and programming in an easy-to-use environment where problems and solutions are expressed in familiar mathematical notation. MATLAB is an interactive system in which the basic element allows the resolution of technical calculation problems, in particular those with vector and matrix formulations, through much simpler and leaner algorithms than those that would be necessary in a scalar language program not interactive. It features a family of application-specific solutions called toolboxes, which provide the foundation for applying sophisticated technology and for solving particular categories of problems.
2. ANALYSIS OF FOOD MATRICES
2.1 Assessment of adulteration of breast milk by coupling FTIR
spectroscopy and chemometric analysis.
Breast milk (BM) is the best food for the newborn as it provides a unique combination of proteins, carbohydrates, lipids, minerals, vitamins and particular bioactive components. It is considered a biological system, a living tissue, able to satisfy not only nutritional but also psycho-emotional needs of the infant.
Lactation develops in two phases:
1. Initial phase of limited secretion towards the end of pregnancy 2. Induction phase towards 32-40 hours after delivery.
The continuous evolution of the milk composition not only guarantees the maintenance of the nutritional needs of the newborn but above all guarantees optimal values of pH and osmolarity that regulate the intestinal functions of the child. Breast milk goes through three main phases: colostrum, transitional milk and mature milk. Colostrum is perfect as a baby's first food: it is low in fat and rich in carbohydrates, proteins, vitamin A and antibodies. It has a high digestibility and at the same time a high nutritional power.
Colostrum is produced in small quantities, adapted to the size of the infant's stomach and to the function of the kidneys, which, immature, are not able to handle large volumes of liquids. Colostrum can be considered a concentrate of antioxidants. The antioxidant capacity of colostrum-milk is particularly important for children born preterm in which the antioxidant defense system is immature and therefore is not able to defend the body from oxidative stress. From the 3rd / 14th day the colostrum become "transition milk" in which the content of immunoglobulins and proteins decreases while that of sugars and fats increases. It is produced during what is commonly called "whipped milk", ie a more abundant production. The evolution times from colostrum to mature milk are however subject to great inter-individual
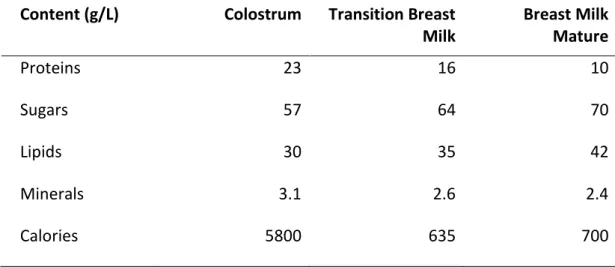
variability. Mature milk is produced after the 10th day of lactation and appears less viscous and more liquid. However, this milk contains all the nutrients necessary for the healthy development of the baby. The milk flowing at the beginning of the feed is low in fat and high in lactose, sugar, proteins, vitamins, minerals and water. During feeding, the fat content increases and the sugar content decreases (table 1).
Table 1. Breast milk composition in three stages of breastfeeding
Content (g/L) Colostrum Transition Breast Milk Breast Milk Mature Proteins 23 16 10 Sugars 57 64 70 Lipids 30 35 42 Minerals 3.1 2.6 2.4 Calories 5800 635 700
2.1.1 The Human Milk Bank
The Human Milk Bank (HMB) refers to a collection point for milk donated by different mothers, distributed, after appropriate treatment, to the infants who are in absolute need of it. In general, HMB carries out activities to promote breastfeeding, donation of human milk, information on the usefulness of human milk and research to improve the nutritional aspects of the premature baby. Donated human milk can be considered like an essential drug, when breast milk is not available, especially in the early postpartum period or for premature babies, especially those more critical and with a birth weight of less than 1,500 g admitted to Neonatal Intensive Care.
The reality of the Human Milk Banks (HMB) (Fig. 7) is already present in our country and is constantly evolving: these facilities offer a service that aims to select, collect, store and distribute the donated human milk, to be used for specific medical needs. HBMs are essential to meet the needs of pre-term infants, but they are also useful
when newborns suffering from pathology as they promote an adequate growth, provide multiple benefits both in the short and medium-long term and promote a better neurocognitive development than commercial formula milk.
Figure 7. Active Milk Banks in Europe
Our country is currently one of the most active in Europe; the activity and the quality of the procedures of the existing banks in Italy is coordinated by the Italian Association of Donated Milk Banks (AIBLUD) established in 2005, which promotes the importance and benefits of woman's milk and her donation in order to increase public awareness.
In Calabria, in Cosenza, there is the bank of human milk donated "Galatea", unique in Calabria, founded in 2007, the bank is in operation at the U.O.C. of Neonatology and Neonatal Intensive Therapy of the Hospital Presidium of Cosenza. (Fig. 8)
Figure 8. Human Milk Bank Galatea in Cosenza
2.1.2 Experimental
BM samples were collected from the Milk Bank in Cosenza Hospital (Calabria, Italy). The milk is donated by voluntary mothers who respect all the characteristics included in the Bank protocol: health status certification and traceability of donated milk. The cow milk samples were purchased from local dairy-product company in Cosenza (Italy).
A set of 220 samples for analysis, consisting of pure BM and adulterated BM, was prepared. For this aim, 60 BM samples (BM set) were made available by the Milk Bank, coming from different mothers donating at different times. These samples were divided into 5 different aliquots. A first set of 20 pure BM was analyzed without any adulteration (set BM). 50 samples were prepared from each of the other four aliquots by adding respectively water (set W), whole cow milk (set CM), semi-skimmed cow milk (set SSCM) and semi-skimmed cow milk (SCM set). The amount of water or cow milk was added in the range 5 - 50%. Applying the Kennard-Stone sampling method [23] from each set were selected 40 samples for the modeling procedures and 10 samples to validate the models.
Chemometric methods. A PCA study of the data patterns was performed to highlight the differences between samples of pure BM and adulterated BM. The unsupervised data analysis on the milk fingerprints aimed to extract the useful information from the data matrix by projecting samples and variables on a set of new orthogonal variables, called principal components
(PCs) [24,25].
Classification and assessment of
adulteration involved the use of various
PLS models: a preliminary PLS2
discriminant analysis (PLS2-DA) model designed to detect the possible addition of water or different types of cow milk and subsequent four PLS1 calibration models able of determining the amount of adulterant added. Figure 9 shows the scheme of the analytical procedure.
2.1.3 Results and Discussion
Exploratory analysis of atr-ftir fingerprints of milk samples. The FTIR spectra of pure BM and the various types of cow milk included in this study are shown in Fig. 10. The absorption bands in the ranges 1630-1680 cm-1 and 1510-1570 cm-1 may be associated with C=O stretching or N-H and C-H bending vibration of the milk proteins [26,27]. The bands 2920, 2850, and 1743 cm-1 may be due to the antisymmetric and symmetric stretching of CH2 and C=O groups, respectively, from the fatty milk components [28]. The absorption bands in the ranges 3200-3700, 1030-1200 and 900-450 cm-1 have been associated with carbohydrate structures [29].
Figure 9. Scheme of multivariate analysis procedure.
Figure 10. FT-IR spectra for pure BM (a), CM (b), PSCM (c) and SCM (d) samples.
A very strong overlap between the spectral signals of human milk and pasteurized cow milk is evident throughout the full recorded spectral region, suggesting a high similarity in the composition of the matrices. No characteristic signal was identified to be used as a differentiation marker, thus making it impossible to detect milk adulteration by a simple visual analysis. Therefore, it seemed necessary to perform a multivariate data study, with the aim of interpreting the data matrices, taking into account the full information from the FTIR fingerprints of the samples. Therefore, it seemed necessary to perform a multivariate data study, with the aim of interpreting the data matrices defined on the information obtained from FTIR fingerprints. Raw FTIR spectra were pre-treated to select the information more useful for the chemometric modelling. First of all, only the wavelength range between 3000 and 1000 cm-1 were considered, discarding the terminal regions because considered rich in instrumental noise and useless information carriers [30]. After that, a mathematical pre-treatment of the data seemed necessary to minimize instrumental problems as baseline fluctuation or noise. Derivatization by Savitzky–Golay algorithm, standard normal variate (SNV) and multiple scatter correction (MSC), described in several papers [31,32], were applied on the FTIR recorded data. A
significant enrichment in the data variance was reached when the raw data were transformed in derivative signals. Different mathematical parameters were tested in applying the derivative elaboration reaching the best results when the following parameters were set: 1st order, number of smoothing points 7, polynomial order 2. A PCA multivariate explorative analysis of the milk samples was performed on all the FTIR fingerprint spectra previously transformed in derivative data. PCA modelling gave 95,74% of explained variance, considering the first four PCs. The evaluation of the information available in the PC score plot showed that PC2 (6.66%) and PC4 (3.12%) were the richest principal components in useful information for our purposes.
Figure 11 shows the score plot PC2 vs PC4. The grouping of the samples was clear making it possible to distinguish the pure BM samples and the BM samples adulterated with water or cow milk. However, this PCA modelling identified only one cluster of BM samples adulterated with cow milk but was unable to distinguish the type of cow milk added.
Classification of milk samples by pls-da modelling. A PLS2-DA modelling was developed with the aim to classify the milk samples as pure BM or adulterated with water (W), whole cow milk (CM), partially skimmed (PSCM) and skimmed (SCM). PLS2 algorithm required the setting of more than one Y variable. In this study, five Y variables/classes (YBM, YW, YCM, YPSCM and YSCM) were set in modelling, assigning the value 1 to the samples belonging to each class and 0 to those belonging to other classes.
The PLS2-DA classification model was validated by full cross validation and its performance evaluated in terms of correlation coefficient R2 and RMSECV. The figures of merit, shown in Table 2, were statistically acceptable by considering 6 factors, with RMSECV values between 0.122 and 0.145 and R2 in the range 0.857 - 0.944. Figure 12 shows the score plot PC2 vs PC4 by PLS-DA modelling, in which the discrimination across all classes is greatly improved.
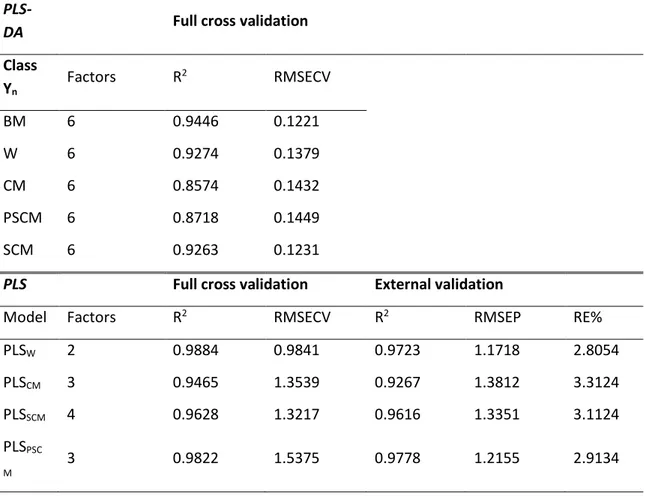
Table 2. Statistical parameters of PLS-DA and PLS models from FCV and external validation procedures
PLS-DA Full cross validation
Class Yn Factors R 2 RMSECV BM 6 0.9446 0.1221 W 6 0.9274 0.1379 CM 6 0.8574 0.1432 PSCM 6 0.8718 0.1449 SCM 6 0.9263 0.1231
PLS Full cross validation External validation
Model Factors R2 RMSECV R2 RMSEP RE%
PLSW 2 0.9884 0.9841 0.9723 1.1718 2.8054 PLSCM 3 0.9465 1.3539 0.9267 1.3812 3.3124 PLSSCM 4 0.9628 1.3217 0.9616 1.3351 3.1124 PLSPSC M 3 0.9822 1.5375 0.9778 1.2155 2.9134
This model was applied to an external prediction set consisting of 60 samples: 10 samples of pure BM and 10 samples from each subset of adulterated samples. According with the PLS-DA procedure, a sample was considered belonging to a class n when the predicted value of Yn was higher than 0.5 [33]. The classification results obtained are listed in Table 3 through a confusion matrix. 100% of BM and W samples were well classified while some difficulties were found in classifying the samples adulterated with cow milk. To be precise, the PLS2-DA model was able to identify 100% of the samples adulterated with cow milk but the exact type of cow milk added was only identified for 90% of the samples. No samples were detected as suspect origin.
Table 2. Table 3. Confusion matrix from PLS2-DA external validation Real Pr ed ic ted Yn BM W CM PSCM SCM BM 10 W 10 CM 10 PSCM 8 1 SCM 2 9
Estimate of adulteration by PLS1 approach. In order to quantify the amount of adulterant added to BM, four PLS1 calibration models were built by using the sets W, CM, PSCM and SCM, respectively. Full cross validation permitted to select the optimal number of factors for all the models by evaluating the parameters R2 and RMSECV. The obtained values of the parameters for all the data sets are listed in Table 2. The calibration report of PLSW described a robust model, since only 2 factors were enough to explain 98.84% of Y variance. Full cross validation showed high prediction ability in determining the amount of water added, providing RMSECV and R2 values of 0.988 and 0.9841, respectively. The three models dedicated to the assay of the different types of added cow milk required three factors for the models PLSCM and PLSSCM and four factors for the PLSPSCM model. The statistical parameters were however satisfactory with R2 above 0.947 and RMSECV below 1.54.
The prediction power of the PLS models was tested by performing validation on the external sample set prepared for this aim. Table 2 summarizes the statistical results carried out from the external validation, in terms of R2, RMSEP and percentage relative error (RE%). The prediction procedure showed satisfactory results for all the types of milk adulteration. The model PLSw highlighted the best results with RE% and RMSEP values of 2.81% and 1.172, respectively. The values of RMSEP were in the range 1.21 and 1.38 in applying the relative PLS models to the samples adulterated with cow milk.
ANALYSIS OF FOOD MATRICES
2.2 A critical evaluation of the analytical techniques in the
photodegradation monitoring of edible oils
In recent years the strong interest in the study of vegetable oils has increased due to their versatility not only in food but also in the pharmaceutical, cosmetic and technological fields.
In this work the different analytical techniques currently used to monitor quality of food matrix were compared to evaluate the effects of light on a series of edible oils (peanut, sunflower, corn, olive, linseed and soy oils).
Olive oil is obtained from the fruit (drupe) of the olive tree, which contains Dicotiledonee, Olacee family, genus Olea, species Olea Europaea L. Olive oil is obtained by cold pressing of the olive pulp and, as we all know, it is a fluid-looking oil with a distinctive scent and a color ranging from golden yellow to green. It is one of the richest in oleic acid (about 62%), the most abundant of monounsaturated fatty acids with a long chain in our body, with great nourishing and emollient properties for the skin. In addition to oleic acid, olive oil contains about 15% linoleic acid, 15% palmitic acid and 2% stearic acid and an unsaponifiable fraction ranging from 1 to 2% which provides a fatty acid, chlorophyll, vitamin E, phytosterols with restorative and anti-inflammatory action and squalene, one of the main components of the skin's surface.
The oil is indispensable during childhood as it contributes to the body growth and also during adulthood because prevents artery and heart disorders and lowers the level of cholesterol in the blood. In addition to reducing the risk of heart disease, it has an anti-aging function for the skin and bones as it is rich in vitamin E, which protects against decalcification, osteoporosis and fractures, together with vitamin E, beta-carotene (provitamin A) and a whole series of antioxidant substances such as phenolic compounds. Olive oil is certainly the most famous for its organoleptic
characteristics and healthy ingredients that make it a major player in the Mediterranean Diet [34,35].
Linseed oil, extracted from the seeds of the flax plant Linum usitatissimun, is rich in omega 3 and omega 6, useful for the heart and against high cholesterol, and is widely used in the field of cosmetics.
The composition of linseed oil is 50% of omega 3 and 25% omega 6 which are essential fatty acids with a lot of benefits on human health but we must supplement with the diet. It also contains oleic acid (15-18%) and saturated fats (5-10%), vitamin E and vitamin B, lecithin, a large part of proteins and fibers and finally many minerals such as magnesium and zinc.
Peanut oil is obtained by squeezing under pressure or by means of solvents and refining of the seeds of the Arachis hypogaea L. plant. The composition of peanut oil is very similar to the composition of classic olive oil; in fact, it contains for more than one-half monounsaturated fat, which we remember to be those fats that give the highest quality to vegetable oil, 18% of saturated and 27% polyunsaturated. Despite of this, the oil does not contain proteins, carbohydrates and gluten so can also be used for the feeding of the ciliaci.
Peanut oil contains a good dose of vitamin E which is an excellent antioxidant, and in fact rancid less than other vegetable oils. Contains vitamin K and many tocopherols (207 mg) especially tocopherol gamma, associated with cardiovascular health. If it is used as a supplement, peanut oil is also a good bowel cleanser, helps hormone regularization and preventing rheumatism. The oil of peanut seeds, also thanks to its organoleptic properties, is more used than olive oil. It contains a considerable dose of vitamin E [36,37] which retards the process of rancidity than other oils, but is also more susceptible to contamination by aflatoxins [38].
Soybean oil is rich in polyunsaturated fatty acids, including linoleic and α linoic acids and also saturated acids, such as palmitic and stearic [39]. Soybean oil has good cholesterol-lowering properties beacuse it contains small doses of lecithin, which besides helping to fight bad cholesterol, is also useful in case of diseases or neurological dysfunction. It is used to flavor raw food or for producing margarine,
after hydrogenation. It is not suitable for frying, as it is unstable to oxidation and high temperature [40].
Sunflower oil is obtained by pressing the seeds of the Helianthus annus plant. It belongs to the Asteraceae family and in fact its large flower is actually an inflorescence composed of many small flowers each of which produces a fruit with a seed inside. The plant can grow up to 3 meters in height and the inflorescence can have a diameter of 85 cm.
The composition of sunflower oil is essentially of unsaturated fatty acids, about 32% of oleic acid and 52% of linoleic precursors of omega 3 and 6 fatty acids; these compounds are important for heart health, production of energy, transport of oxygen, creation of hemoglobin in the bloodstream and even for keeping the bodily hormonal system in balance. Sunflower oil is rich in vitamin E, known to be not only an antioxidant compound but also able to protect cell membranes fighting free radicals responsible for cellular aging. It is often used for frying because quite stable at high temperatures [41].
Corn oil is extracted from the germinating part (called germ) of the caryopsis of the seed of the Zea mays plant, commonly called corn or maize. This plant is native to the Americas and is currently widespread in the world until it became a common plant also cultivated in Italy. The oil extraction yield is not very high; in fact, it is only 15-20% on the whole of the whole part of the corn seed. Corn oil has a dark color, amber red and only after refining acquires a clear and limpid appearance.
It is rich in polyunsaturated fats of the omega-6 family (30%) and omega-9 (55-60%). On the contrary, it is omega-3 and this composition must be kept in mind as it is recommended to take a right ratio between omega 6 and 3 (4: 1 respectively). This parameter shows us that if we want to use corn oil in the diet we must integrate omega 3 with other foods such as linseed oil. [42]. In corn oil there are no proteins and this allows to use it for those who have problems with excess uric acid and high azotemia or even in cases of liver problems and intoxication. It also contains a good dose of vitamin E useful to improve some dermatoses and skin problems such as eczema and redness, even in children. Vitamin E is an excellent antioxidant to reduce
and counteract free radicals responsible among other things for cellular aging. In 10 g of oil, which corresponds to a cooking spoon, we can have 30% of RDA (recommended daily dose) of vitamin E. Corn oil can also contain provitamin A always if the extraction oil is raw and therefore can be considered a useful supplement to reinforce and balance the skin and hair.
The composition of the mineral salts sees the presence of iron and some other trace elements depending on the stage of transformation of the oil extraction process. The corn oil has a good laxative action thanks to the fact that intestinal lowers its absorption, this involves its elimination with the faecal mass that will be softer, favoring mechanical emptying and facilitating in cases of constipation. With corn oil it is possible to prepare the soap, in fact the saponifiable fraction is 2% and the oil contains sterols, phospholipids and gamma-tocopherol. It can be used for saponification with the creation of natural soaps also made by hand. The consistency of the soap obtained only from corn oil is softer than the common soap even if it carries with it the typical properties of this oil; it is also very stable. Corn oil soap gives skin moisture, delicacy and has good emollient properties. In the field of renewable energy, corn is used to produce bioethanol and biofuel depending on whether it is transformed or used as a biomass directly.
As can be deduced from the description of the properties of each oil, the study of stability is extremely important to guarantee consumers high quality products and to provide the correct information on their correct storage. Usually, oxidation represents the major cause of degradation and it occurs if the oil is exposed to air, heating, exposure to light, catalysts, etc. In particular, the protection of the oils from light appears so of great importance to ensure that the products maintain the full original nutritional and organoleptic characteristics.
This work aims to verify the performance of the widely used analytical techniques in assessing any alteration by light irradiation on a series of edible oils. The photodegradation tests were conducted in accordance with international rules (International Conference on Harmonization, 2003) [43] and the oil samples were
analyzed by FTIR and UV spectroscopy and HPLC, just before the experiments and at several time intervals up to 9 h of total irradiation.
2.2.1 Experimental
Corn, linseed, olive, peanut, soybean and sunflower oils were purchased commercially and stored in the dark at 25 C. N-hexane for UV-vis analysis, sodium hydroxide, hydrochloric acid, petroleum ether, formic acid 98% (lab grade); acetonitrile and methanol, both of chromatographic grade; linoleic, linolenic and oleic acids (standard grade), were all purchased from Sigma-Aldrich (Milan, Italy). The samples for UV analysis were prepared by diluting 1.0 g of oil in hexane and then opportunely diluting this solution up to obtain a concentration of 0.8 mg/mL. FTIR analysis were made by placing a drop of the samples on the ATR surface and infrared spectra were recorded in the range 4000e450 cm-1. Scan number and resolution were fixed at 8 scans and 4 cm-1, respectively. The spectrum of the ATR element versus room air was used as background. Before each analysis, the ATR plate was cleaned by scrubbing it with hexane and ethanol.
HPLC analysis of linoleic, linolenic e oleic acids, stored at 4 °C before the use, were carried out. For this aim, the compounds were appropriately solubilized in methanol and the solutions filtered through a 0.22 mm Millipore filter (Billerica, MA, USA). Mixtures of the standards were also prepared at concentration ratios close tothose of the studied oils. Determination of the fatty acids in the oil samples was performed after appropriate extraction: 5 g of oil were hydrolyzed with 50 mL of 0.5 M NaOH at 25 °C for 3 h. The dispersion was extracted by adding 50 mL of petroleum ether two times, to remove the unsaponifiable fraction. The aqueous phase was acidified with 1 M HCl to pH 2.9 and then extracted with 50 mL of petroleum ether two times. The organic solvent was removed at 40 °C under pressure. Finally, the acids were recovered with 4 mL of methanol and filtered through 0.22 mmMillipore filters before HPLC injection. The chromatographic separation was achieved at room temperature by C18 column (250 mm x 4.6 mm x 5 mm Phenomenex), isocratic
mobile phase of acetonitrile/methanol (90:10 v/v) adjusted with formic acid to pH 5.5, flow rate 1 mL/min.
Photodegradation experiments. Oil samples were subdued to light irradiation without any treatment. Photodegradation experiments were conducted in the Xenon camera test fixing the irradiation power of 350 W/m2, internal temperature at 25 °C; UV-filter glass >290 nm. The filter adopted mimicked the effect of the sunlight outside. Analysis was recorded at 30, 60, 90, 120, 180, 240, 360, 540 min. In order to minimize any interference of extraneous light in the experiments, all laboratory procedures were executed in a dark room equipped with a red lamp of 60Watt a distance of at least 2m.
Chemometric elaboration. Principal component analysis (PCA) provides to extract the main information from a data matrix and express this information by projection of the samples on a set of new orthogonal variables called principal components (PCs). When PCA is run, the amount of original variables is reduced to a few PCs that contain the main information stored in the original data. The PCs are built such that the first one carries most information, followed by the second one carrying less information, and so on. When the number of PCs increases, the variance contained by the new PCs can belong to the instrumental noise. Different validation procedures can be used to select the optimal number of PCs. In this work, cross validation procedure was adopted, in which the same samples are used both for modelling and testing. A selection of samples was kept out from the calibration and the model is built on the remaining samples. After that, the kept-out samples were predicted and the prediction residuals computed.
The process was repeated with another subset of the calibration set, and so on until every object was left out once. All prediction residuals were combined to compute the validation residual variance and to estimate the optimal number of PCs [44]. The Unscrambler X software version 10.3 from CAMO (Computer Aided Modelling, Trondheim, Norway) was used for the multivariate data elaboration.
2.2.2. Results and Discussion
FT-IR analysis. The IR spectra of the different oils are shown in figure 13. By observing the image, it is evident that all oils have characteristic bands, in particular between 2850 and 3000 due to CH strechting, 1740 due to the ester portion of triglycerides, a broad band between 1027 and 1112, due to the CO bond and to 721 due to CH out of the deformation plane [45].
Because of the strong similarity between the spectra of different oils, it is difficult to determine any differences through traditional methods.
In this case, multivariate analysis is a more appropriate investigation tool to explore all the signals along the entire wavelength range [46,47]. Chemometric elaboration is able to distinguish clearly between the different types of oil, with the exception of sunflower oil or corn. (Fig.14)
Figure 14. PC1/PC2 score plot by PCA analysis on the edible oils.
The oils were subjected to a suntest forced photodegradation experiment in accordance with the ICH standards, using the wavelength range over 290 nm to simulate the external light and at a temperature of 25 °C to avoid thermal degradation. The spectra registration was made at different time intervals, such as 30, 60, 90, 120, 180, 240, 360, 480, 540 min.
The simple “visual” analysis of the spectra suggests a complete overlap of the spectra and in addition application of the multivariate analysis, despite the well-known sensitivity, confirmed no significant change in the spectra during the stressing experiment.
UV analysis. In order to verify the photostability of oils, photodegradation was also monitored using UV-vis spectroscopy. Also in this case the spectra of the oil samples, suitable diluted, were recorded at different time intervals up to 540 min.
By observing the UV spectra of each oil at zero time (fig. 15), it’s clear the presence of a major peak in the 210-220 nm region due to p/p*transitions of single ethylene chromophores and to n / s* transition sof carbonyl chromophores.
In soybean, peanut and flax oils, peaks around 230-280 nm are particularly evident due to the double and triple conjugate bonds, almost absent in the other oils. The figure 16 summarizes the sequence of spectra for each oil recorded during the stress test. Unlike the IR spectra, UV analysis showed a continuous variation of the spectral trend, confirming the sensitivity of the oils to light.
Figure 16. UV spectra of the oils recorded at different interval along photodegradation test.
Even if the spectral analysis shows the photostability of olive oil and corn, in general the oils undergo qualitative-quantitative alterations when exposed to light, alterations that, however, the IR is not able to detect. Probably degradation leads to the formation of a chromophore that absorbs in the UV range but does not alter the functional groups responsible for absorption in the IR range.
HPLC analysis. A further control of the consequences of the light exposure on the oils was performed by monitoring the content of the main fatty acids, linoleic, linolenic and oleic acids, present all studied oils. After the fatty acid extraction described in detail above [48], the chromatographic conditions were optimized by varying the ratios between the solvents and modulating the flow rate of the mobile phase
accordingly. Finally, the mixture which allowed a better separation of the peaks was revealed acetonitrile: methanol 90:10, acidified with formic acid pH 5.5.
Figure 17. HPLC chromatogram of the standard linolenic (LNA), linoleic (LLA) and oleic (OLA) fatty acids
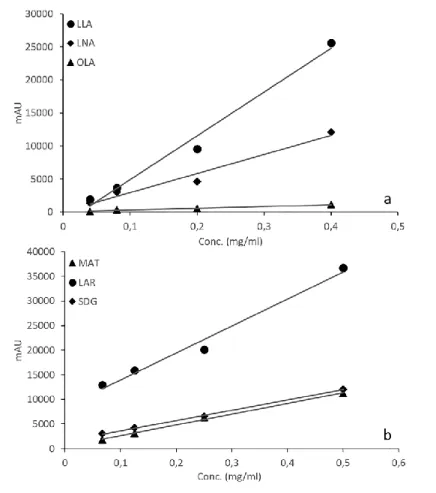
The quantity of the analytes was in agreement with that reported in the literature. The retention times (RT) were 4.7, 5.6 and 7.1 min for linolenic, linoleic and oleic acid, respectively, in accordance with the lipophilicity of the analytes. The calibration curves of the three analytes were calculated in the range 0.01-3.00 mg/mL for oleic and linolenic acid and 0.001-1.500 mg/ml for linoleic acid. These relationships were used to quantify the fatty acids before and after the photodegradation experiments. The figure 18 (a-d) shows the comparison between the chromatograms before and after the stress test.
Figura 18 a-f. HPLC chromatograms of the fatty acids extracted by edible oils before and after light irradiation test
Except for olive oil, the fatty acid content decreased during the photodegradation experiment. The results obtained further confirm our hypothesis that IR is an inadequate tool for determining the effects of light on oils.
ANALYSIS OF FOOD MATRICES
2.3 Photo and thermal stress of linseed oil and stabilization strategies.
Nowadays, LO is considered a functional food because is a good source of omega-3 and -6 polyunsaturated fatty acids, dietary fiber and other minor nutrients. In particular, the ω-6 linoleic acid (LLA) and ω-3α-linolenic acid (LNA) are important as precursors of other fatty acids of both series. The polyunsaturated fatty acids, as well as being components of cell membranes, are important protective factors in heart disease, in the prevention and treatment of hypertension, in type II diabetes, in immune and inflammatory disorders [49 -51]. Furthermore, the presence of oleic acid (OLA) is important, since it has been shown that a high consumption of this fatty acid is associated with a lesser possibility to develop cardiovascular and tumor pathologies [52]. Linseed also contains polyphenolic compounds known as lignans, considered as phytoestrogen analogues [53] and studied for their potential pharmacological use in pathologies related to hormones [54]. In linseed, the main lignan is secoisolariciresinol (SEC), mainly in the form of diglucoside [55] toghether with discrete quantities of lariciresinol (LAR) and matairesinol (MAT). Determination of SEC in the flax seed has been performed by HPLC-DAD [56]. Consumption of lignans reduces cardiovascular risk and inhibits the growth of some types of diabetes [57-58]. Since functional foods contain bioactive components that provide health benefits, appropriate preservation of these bioactive components is therefore fundamental to guarantee their good properties. Recurrent episodes of failures in maintaining the quality of functional foods have been reported [59;60]. One of the main problems associated with the use of LO as a source of omega-3/6 fatty acids and lignans is the easy oxidation and rancidity process due to the high concentration of these components. In addition, potentially toxic secondary products for human health could also be formed [61]. The analysis through UV spectroscopy has allowed to follow any variation of the overall drug or food matrices and at the same time to monitor the main components during the photo- and thermal degradationexperiments [62;63]. On the contrary FTIR spectroscopy, even if is an efficient analytical technique capable of characterizing many food matrices, it it turned out to be not suitable to study the photolability of vegetable oils [64;65]. HPLC techniques have been used to determine the composition of fatty acids, especially omega-3 and -6. The fatty acids have been determined by HPLC after specific extraction [66] and the photodegradation tests performed in accordance with international rules [67;68]. The different types of formulation and packaging can also drastically affect the chemistry of bioactive components and their duration. Unfortunately, there are few documents on the packaging, but it would be helpful to have a complete overview of the requirements for proper food storage and therefore the right packaging standards. One of the most used strategy to reduce the oxidation of the omega fatty acids was the addition of antioxidants. The antioxidant properties of tocopherols and ascorbic acid in inhibiting the decomposition of hydroperoxides was demonstrated fundamental in preserving the quality of food by reducing the formation of aldehydes [61]. Another study uses phenolic compounds such as myricetin, (+) - catechins, genistein and caffeic acid as antioxidants. Their protective effect was assessed by monitoring the form of hydroperoxide and the residual concentration of antioxidants. Among these, myricetin has shown a significant reduction in the oxidation of linoleic acid [69].
This work aims to define any changes in LO when exposed to normal or stressed storage conditions of light and temperature. In addition to the photo-thermal stress study, some strategies are also proposed for minimizing LO photolability through physical and chemical approaches.
2.3.1 Experimental
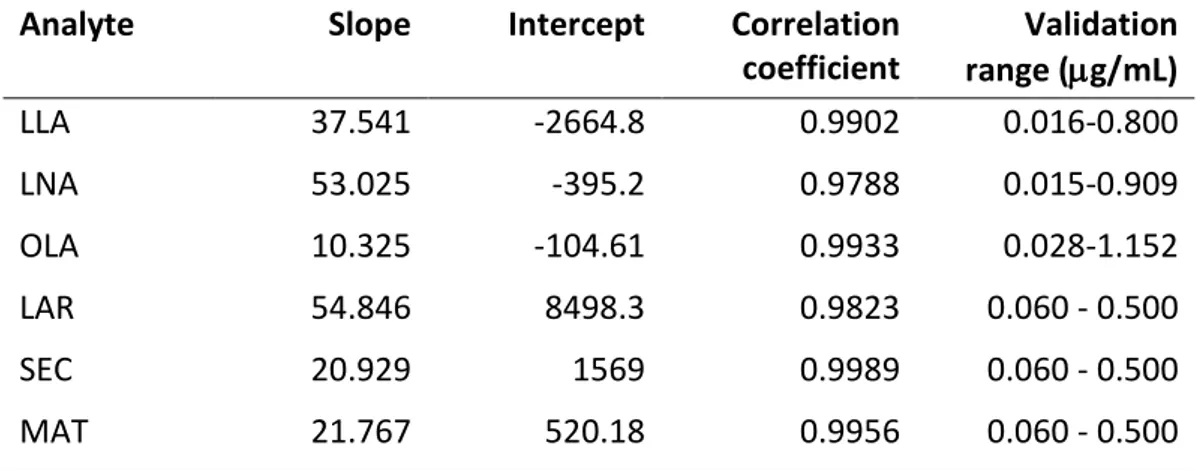
LO was purchased commercially and stored in the dark at 4 °C. n-hexane for UV-vis analysis, sodium hydroxide, hydrochloric acid, petroleum ether, formic acid 98% were lab grade; acetonitrile and methanol of chromatographic grade; LLA, LNA, OLA, LAR, SEC, MAT and ascorbyl palmitate (AP) (standard grade), were purchased from Sigma-Aldrich (Milan, Italy).
Stressing photodegradation tests were conducted by the Suntest CPS+ camera (Heraeus, Italy), equipped with a Xenon lamp, whose radiant spectrum is largely overlapping with the spectrum of the solar radiation. The instrument allows to select specific spectral regions by interposing specific filters; the internal temperature can be adjusted by means of a refrigerant unit to avoid sample heating due to the lamp. UV analysis was performed by Agilent 8453 UV spectrophotometer equipped with diode array detector (Agilent Technologies, CA, USA). HPLC analysis was performed using an HP1100 pump equipped with a G1315B (Agilent Technologies) diode detector and a Rheodyne 7725 manual injector.
Standard solutions 500 mg of LO were diluted in 10 mL of hexane and the solution was further diluted 1:10 witH the same solvent. These samples (n=10) were used to record the UV spectra of LO before degradation tests. The standard solutions of LLA, LNA and OLA, stored at 4 °C before the use, were prepared by solubilizing 1.60, 3.02 and 5.76 mg, respectively, in 1 mL of methanol and further filtration through a 0.22 µm filter. Analogously, the standard solutions of MAT, LAR and SEC were prepared by weighing 1.02, 1.08 and 1.03 mg, respectively, and diluting in methanol up to obtain concentration ranges between 0.06 and 0.5 mg/mL. All the samples were analyzed by HPLC to carry out the regression equations of the analytes. These equations were then used to calculate the analytes concentration along the degradation tests. The UV spectra of LO along the degradation tests were performed after dilution, following the procedure above described. Determination of the fatty acids in the LO samples was performed after appropriate extraction as follows: 5 g of LO were hydrolyzed with 50 mL of 0.5M NaOH at 25 °C for 3 h under stirring. 50 mL of petroleum ether were added twice to the dispersion, in order to remove the unsaponifiable fraction. The aqueous phase was acidified with 1M HCl to pH 2.9 and then extracted twice with 50 mL of petroleum ether. The organic solvent was removed at 40 °C under pressure. Finally, the analytes were recovered with 4 mL of methanol and filtered through 0.22 µm filters before HPLC injection.
The chromatographic separation of the fatty acids was achieved on a LC-C18 Gemini column (Phenomenex) 250 x 4.6 mm x 5 µm at room temperature in isocratic mode.