Scuola di Dottorato in Ingegneria “Leonardo da Vinci”
Corso di Dottorato di Ricerca in
SICUREZZA NUCLEARE E INDUSTRIALE
Tesi di Dottorato di Ricerca
Autore:
Alessandro Petruzzi
Firma________________
Relatori:
Prof. Francesco D’Auria (UNIPI) Firma_________________
Prof. Dan Gabriel Cacuci (University of Karlsruhe) Firma_________________ Dr. Cesare Frepoli (Westinghouse USA) Firma_________________
Dr. Walter Giannotti (UNIPI) Firma_________________
DEVELOPMENT AND APPLICATION OF
METHODOLOGIES FOR SENSITIVITY ANALYSIS
AND UNCERTAINTY EVALUATION OF THE
RESULTS OF THE BEST ESTIMATE SYSTEM
CODES APPLIED IN NUCLEAR TECHNOLOGY
ACKNOWLEDGMENTS
The author wishes to thank his advisor and mentor Prof. Francesco D’Auria for his invaluable contribution to the technical development of the author, for his guidance, and endless support and for introducing him to the scientific research in the nuclear engineering field giving the possibility to participate in several international activities.
The author wishes to express a special thank to Prof. Dan Gabriel Cacuci for his priceless technical suggestions, for his great support and guidance during the study and work on the sensitivity and uncertainty methods and for his warm hospitality during the meetings in Karlsruhe.
The author wishes to thank Dr. Cesare Frepoli for the several technical discussions held on the thesis’ subjects that contributed to the quality improvement of the work, for his review of the thesis and especially for his priceless friendship.
The author wishes to thank Dr. Walter Giannotti for his continuous availability and support to address the technical issues arisen during the thesis’ activity.
The author also wishes to express special thanks to Prof. Walter Ambrosini (from University of Pisa) and Dr. Florin Badea (from University of Karlsruhe) for their useful technical advices.
The author wishes to express his gratitude to his family and his girlfriend Chiara for their support and encouragement during all period of the thesis’ work.
The author also wishes to thank all members of the Nuclear Research Group of San Piero a Grado where the thesis’s work was developed and finalized and Dr Juswald Vedovi (from GEH, USA) and Dr Claudio Delfino (ISL Inc., USA) for their friendships.
SOMMARIO
Le analisi di sensitività e di incertezza sono in grado di fornire quantitativamente, su fondate basi matematiche e fisiche, risposte a tipiche domande scientifiche e ingegneristiche quali: quanto il modello in considerazione rappresenta il fenomeno fisico, quanto i risultati di un codice possono essere estrapolati, ecc…
La tecnologia degli Impianti di Potenza Nucleare (NPP) è stata sviluppata sulla base del tradizionale concetto di “difesa in profondità” supportato dai metodi di calcolo deterministici e conservativi per le analisi di sicurezza. Nel 1970 [1], ipotesi conservative furono introdotte nell’analisi di sicurezza per trattare le esistenti incertezze dei codici. Da allora, un’intensa campagna sperimentale nel campo della termoidraulica ha generato un notevole aumento delle conoscenze e di conseguenza lo sviluppo di codici “best-estimate” capaci di fornire informazioni più realistiche sul comportamento fisico del sistema e di identificare le questioni più rilevanti sulla sicurezza, consentendo la valutazione degli effettivi margini esistenti tra i risultati dei codici di calcolo e i criteri di accettazione.
Tuttavia, i risultati dei calcoli “best-estimate” ottenuti dai complessi codici termoidraulici di sistema (come Relap5, Cathare, Athlet, Trace, ecc…) sono affetti da ineliminabili approssimazioni che sono non predicibili senza l’utilizzo di strumenti di calcolo che tengono conto delle varie sorgenti di incertezza. Di conseguenza, l’utilizzo di codici “best-estimate” nella tecnologia nucleare, sia per scopi di progettazione che di sicurezza, implica la comprensione e l’accettazione delle limitazioni e delle deficienze dei codici stessi.
Le incertezze dei codici di calcolo posso avere diverse origini: dalle approssimazioni dei modelli e delle soluzioni numeriche, alla mancanza di conoscenza di precisi valori per le condizioni iniziali e al contorno del problema. L’ammontare di incertezza che influenza un calcolo può dipendere fortemente sia dal codice che dalle tecniche di modellizzazione (cioè dall’utilizzatore del codice). Una metodologia di incertezza per essere “robusta” e consistente deve prendere in considerazione tutti gli aspetti sopra menzionati.
Ai fini della classificazione, si distinguono tre principali approcci indipendenti per effettuare le analisi di sensitività e di incertezza dei calcoli dei codici termoidraulici di sistema: a) la propagazione degli errori di input dei codici e il trattamento statistico della risultante incertezza, b) la propagazione degli errori di output dei codici e il trattamento deterministico dell’incertezza e c) la metodologia di validazione sperimentale e di calibrazione di complessi modelli di simulazione numerica dipendenti dal tempo in grado di incorporare in modo consistente sia le incertezze sperimentali che computazionali, facendo un uso estensivo dei concetti dell’analisi di sensitività.
Tenendo in considerazione quanto sopra, il principale obiettivo della tesi è di contribuire all’ulteriore sviluppo e qualifica degli strumenti di sensitività e di incertezza per effettuare l’analisi deterministica di sicurezza dei reattori nucleari. A questo scopo, l’attività di PhD è stata suddivisa in due parti principali, in relazione al diverso stato di avanzamento e maturità delle metodologie presentate.
Da un lato, l’obiettivo è di consolidare e rafforzare la metodologia di incertezza CIAU proposta dell’Università di Pisa [24, 25], dimostrandone il raggiunto livello di
maturità e qualifica attraverso la sua applicazione nell’ambito del progetto BEMUSE promosso dall’OECD [92, 93]. Dall’altro lato, lo scopo è di sviluppare un metodo totalmente deterministico, denominato CASUALIDAD, basato su avanzati strumenti matematici per eseguire le analisi di sensitività e di incertezza internamente ai codici termoidraulici di sistema.
Per quanto concerne la metodologia CIAU, i contributi apportati dal lavoro di tesi sono stati: 1) l’estensione del database di incertezza con l’aggiunta di dodici nuovi tests [6] e 2) lo sviluppo di una procedura per eseguire la ‘qualifica interna’ del metodo [7]. Entrambi gli aspetti hanno contribuito a ottenere una più accurata valutazione delle incertezze attraverso la CIAU, poiché rispettivamente hanno migliorato l’affidabilità statistica e permesso una sistematica analisi qualitativa e quantitativa dei dati che costituiscono il database della CIAU.
Il secondo obiettivo della tesi è consistito nello sviluppo di un esauriente e esaustivo approccio per utilizzare le incertezze quantificate attraverso esperimenti in ITF [12] e SETF [13] nel processo di calibrazione di complessi codici di calcolo per la predizione dei transitori in NPP. La metodologia proposta è capace di elaborare multipli SETF and ITF esperimenti per apprendere il più possibile sulle incertezze dei parametri di input, consentendo di migliorare le predizioni dei codici di calcolo sulla base delle evidenze sperimentali disponibili. La metodologia CASUALIDAD è un approccio pionieristico che può essere considerato anche come un tentativo di sostituire l’empiricismo dell’approccio CIAU, in relazione al trattamento statistico dell’accuratezza per derivare i valori di incertezza, attraverso più rigorosi metodi deterministici, come gli avanzati strumenti/procedure per effettuare l’analisi di sensitività locale (ASAP [14, 15] o FSAP [14, 15]), globale (GASAP, [16, 17]) e la metodologia (DAA, [17]) per incorporare in modo consistente le informazioni sperimentali all’interno di un modello predittivo per ottenere una migliorata stima dell’incertezza.
La conclusione principale del lavoro di tesi è la chiara rilevanza industriale che l’approccio “best estimate plus uncertainty” ha, e avrà sempre di più nel prossimo futuro, rispetto all’approccio conservativo. Più in dettaglio, i risultati ottenuti in relazione alla CIAU dimostrano, nell’ambito di un’iniziativa internazionale, il livello di “robustezza” e “adeguatezza” della metodologia di incertezza proposta dall’Università di Pisa. Allo stesso tempo, sia i progressi realizzati che le applicazioni effettuate, costituiscono un supporto fondamentale per l’uso della metodologia CIAU nel processo di licenziamento degli NPP, come attualmente in corso per Atucha-2 NPP in Argentina [9, 10, 11] o come nel recente passato è avvenuto per Angra-2 NPP in Brasile (2000, [8]).
Per quanto concerne il metodo CASUALIDAD, per il quale un’applicazione dimostrativa (il ‘blowdown’ di un gas da un recipiente in pressione considerando anche lo scambio termico attraverso la parete del recipiente) è presentata nel lavoro di tesi, la metodologia proposta costituisce un fondamentale passo in avanti rispetto ai metodi correntemente usati e basati sulla statistica e sull’utilizzo delle valutazioni degli esperti. Essa permette: a) di stabilire le incertezze di ogni parametro che caratterizza il sistema, attraverso un approccio matematico-deterministico in cui le evidenze sperimentali giocano un ruolo fondamentale e b) di predire una stima ‘migliorata’ sia delle risposte calcolate dai codici di calcolo che delle relative incertezze.
ABSTRACT
Sensitivity and uncertainty analyses can provide quantitatively in a mathematically and physically well-founded way answers to typical scientific and engineering questions such as: how much the model under consideration represents the physical phenomena, how far the calculated results can be extrapolated and etc… Nuclear Power Plant (NPP) technology has been developed based on the traditional defense in depth philosophy supported by deterministic and overly conservative methods for safety analysis. In the 1970s [1], conservative hypotheses were introduced for safety analyses to address existing uncertainties. Since then, intensive thermal-hydraulic experimental research has resulted in a considerable increase in knowledge and consequently in the development of best-estimate codes able to provide more realistic information about the physical behaviour and to identify the most relevant safety issues allowing the evaluation of the existing actual margins between the results of the calculations and the acceptance criteria.
However, the best-estimate calculation results from complex thermal-hydraulic system codes (like Relap5, Cathare, Athlet, Trace, etc..) are affected by unavoidable approximations that are un-predictable without the use of computational tools that account for the various sources of uncertainty. Therefore the use of best-estimate codes within the reactor technology, either for design or safety purposes, implies understanding and accepting the limitations and the deficiencies of those codes.
Uncertainties may have different origins ranging from the approximation of the models, to the approximation of the numerical solution, and to the lack of precision of the values adopted for boundary and initial conditions. The amount of uncertainty that affects a calculation may strongly depend upon the codes and the modeling techniques (i.e. the code’s users). A consistent and robust uncertainty methodology must be developed taking into consideration all the above aspects. Three main independent ways to perform the sensitivity and uncertainty analysis of thermal-hydraulic system code calculations have been identified in the present effort with approaches based on: a) propagation of code input errors and statistical treatment of the resulting uncertainty, b) propagation of code output errors and ‘deterministic’ treatment of the resulting uncertainty and c) experimental validation and calibration methodology of complex time-dependent numerical simulation models able to consistently incorporate both computational and experimental uncertainties making extensive use of the concepts of the sensitivity analysis. Taking into consideration the above framework, the main objective of the thesis is to contribute to the further development and qualification of the sensitivity and uncertainty tools for performing deterministic nuclear reactor safety analyses. To this aim, the PhD activity has been subdivided in two main parts mostly related with the different state of advancement and maturity of the involved methodologies. From one side, the goal is to consolidate and strengthen the Code with the capability of Internal Assessment of Uncertainty (CIAU, [24, 25]) proposed by University of Pisa and to demonstrate its robustness and achieved maturity level through the application of the methodology in the framework of the BEMUSE (Best
Estimate Methods Uncertainty and Sensitivity Evaluation, [92, 93]) project promoted by OECD. From the other side, the aim is to develop a fully deterministic method, named CASUALIDAD (Code with the capability of Adjoint Sensitivity and Uncertainty AnaLysis by Internal Data ADjustment and assimilation) based on advanced mathematical tools for performing the sensitivity and the uncertainty analyses internally to the thermal-hydraulic system code.
With respect to CIAU, the contributions of the thesis’s work are 1) the extension of the uncertainty database with the addition of twelve new tests [6] and 2) the development of a procedure for the ‘internal’ qualification of the method [7]. Both aspects result in a more accurate CIAU uncertainty evaluation as they contribute respectively to improve the statistical performance and to perform a systematic qualitative and quantitative analysis of the data constituting the CIAU database. With respect to the second goal of the thesis’s work, a comprehensive approach for utilizing quantified uncertainties arising from Integral Test Facilities (ITFs, [12]) and Separate Effect Test Facilities (SETFs, [13]) in the process of calibrating complex computer models for the application to NPP transient scenarios has been developed. The methodology proposed is capable of accommodating multiple SETFs and ITFs to learn as much as possible about uncertain parameters, allowing for the improvement of the computer model predictions based on the available experimental evidences. The pioneering CASUALIDAD approach can be considered also as an attempt to substitute the empiricism of the CIAU approach in relation with the statistical treatment of the accuracy for deriving the uncertainty values with rigorous mathematical deterministic methods like the advanced sensitivity tools for performing the local (the Adjoint Sensitivity Analysis Procedure, ASAP [14, 15], or the Forward Sensitivity Analysis Procedure, FSAP, [14, 15]) and global (Global Adjoint Sensitivity Analysis Procedure, GASAP [16, 17]) sensitivity analyses and the methodology (the Data Adjustment and Assimilation, DAA [17]) for consistently incorporating observed available information into a predicting model to obtain an improved uncertainty estimation.
As a main conclusion from the present effort, it is clear the industrial relevance of the best-estimate plus uncertainty approach compared with the conservative approach. More in detail, with respect to the CIAU uncertainty method, the attained results demonstrate, within the framework of an international initiative, the level of robustness and adequacy of the proposed uncertainty methodology. At the same time, both the achieved advancements and the performed applications, constitute fundamental supports for the use of the CIAU method in the NPP licensing process, like for Angra-2 NPP (Brazil) in the recent past (2000, [8]) and for Atucha-2 NPP (Argentina) currently under application [9, 10, 11].
With respect to the CASUALIDAD, for which a demonstrative application (i.e. the blowdown of a gas from a pressurized vessel taking into account the heat transfer through the vessel wall) is presented, the proposed methodology constitutes a major step forward with respect to the generally used expert judgement and statistical methods as it permits a) to establish the uncertainties of any parameter characterizing the system, based on a fully mathematical approach where the experimental evidences play the major role and b) to calculate an improved estimate of the computed response and relative improved (i.e. reduced) uncertainty.
CONTENTS
ACKNOWLEDGMENTS... I SOMMARIO... III ABSTRACT ... V CONTENTS ... VII LIST OF FIGURES ... XIII LIST OF TABLES... XXI LIST OF ACRONYMS ... XXV LIST OF SYMBOLS ... XXIX
1. INTRODUCTION... 1
1.1.Historical Background...2
1.2.Objective of the Thesis...4
1.3.Structure of the Thesis...5
2. SENSITIVITY AND UNCERTAINTY ANALYSIS ... 7
2.1.Accuracy, Sensitivity and Uncertainty...7
2.1.1. Definitions and Complementary Roles of the Analyses... 7
2.1.2. Needs for Uncertainty Analysis... 9
2.2.Sources of Uncertainties in Thermal-Hydraulic System Codes...13
2.3.The Methods to Evaluate the Uncertainty...19
2.3.1. The Three Main Approaches ... 19
2.3.2. Topics Relevant for the Uncertainty Evaluation (TRUE) ... 26
2.4.The Pioneering Work for Uncertainty in System Thermal-Hydraulics...29
2.4.1. Overview of the Code Scaling, Applicability and Uncertainty (CSAU)... 29
2.4.2. The GRS Method ... 32
2.4.3. The UMAE Methodology (Precursor of CIAU Method) developed at UNIPI... 34
2.5.The Industrial Applications of Sensitivity and Uncertainty (S&U) Analysis...36
2.5.1. Historical Background and Regulation Approaches in the Nuclear Industry... 37
2.5.1.1.The role of engineering judgment...40
2.5.1.2.Summary of the applications of Best-Estimate methodology...41
2.5.2. GRS Method for S&U Evaluation of Code Results ... 42
2.5.2.1.Application of the GRS method to a German reference reactor, 2 x 100% cold leg break...42
2.5.3. Westinghouse Realistic Large Break LOCA Evaluation Model .. 44
2.5.3.1.Westinghouse sample analysis results...47
2.5.4. AREVA NP Realistic Large Break LOCA Analysis Methodology ... 49
2.5.4.1.AREVA RLBLOCA demonstrative application...50
2.5.5. BEAU Methodology at AECL for CANDU NPP ... 51
2.5.5.1.Selected applications of BEAU methodology to CANDU-6 NPP...52
2.5.6. TE Deterministic Bounding Approach for Doel-2 NPP ... 54
2.5.6.1.The TE deterministic bounding approach...54
3. ADVANCEMENTS IN CIAU METHODOLOGY... 57
3.1.The CIAU Method...57
3.1.1. The Bases of the Method... 58
3.1.1.1.The UMAE Qualification Process (the Engine of CIAU)58 3.1.1.2.The NPP Status Approach...58
3.1.1.3.The Separation and Recombination of Time and Quantity Error...59
3.1.1.4.The Error Filling Process and the Error Extraction Process...61
3.1.1.5.The CIAU Process and Status...62
3.1.2. The “Empirical” Statistical Treatment of Experimental and Calculated Data ... 66
3.1.2.1.The AFE Tool...67
3.1.2.2.The DAST Tool...72
3.1.2.3.The UBEP Tool...76
3.1.3. Key Industrial Applications of CIAU ... 78
3.1.4. Extension to Coupled 3D TH-NK Codes: CIAU-TN... 83
3.1.4.1.Features of CIAU-TN...83
3.1.4.2.CIAU-TN Application to MSLB...84
3.1.5. Main Topics for Comparison with other Uncertainty Methods .... 85
3.2.Enlargement of the CIAU Database...88
3.2.1. The Status of the CIAU-RELAP5 Database 2008 ... 89
3.2.1.1.The Accuracy Database 2008...96
3.2.1.2.The Uncertainty Database 2008...98
3.2.2. The (External, Independent) Qualification of the Database 2008... 101
3.3.A Methodology for the (Internal) Qualification of the Database...103
3.3.1. Qualification at Accuracy Level... 104
4. THE BEMUSE PROGRAMME ... 109
4.1.Overview of Projects devoted to the Development and Evaluation of Uncertainty Methods (UMS and UAM)...109
4.2.BEMUSE Phase II: Re-Analysis of the ISP-13 Exercise, Post Test Analysis of the LOFT L2-5 Test Calculation...117
4.2.1. The Definition of the Problem ... 117
4.2.1.1.LOFT facility configuration...117
4.2.1.2.Test L2-5 (DEGB LBLOCA) description...119
4.2.1.3.Specification for BEMUSE Phase 2...120
4.2.2. Development and Results from University of Pisa ... 125
4.2.2.1.Description of the RELAP5 input deck...125
4.2.2.2.UNIPI steady state achievement...127
4.2.2.3.UNIPI reference calculation and on-transient qualification...128
4.2.2.4.UNIPI sensitivity calculations...135
4.2.3. Comparison among Participants... 140
4.2.3.1.Comparison of adopted code resources...140
4.2.3.2.Comparison and evaluation of steady state results...141
4.2.3.3.Comparison and evaluation of reference results...145
4.2.3.4.Critical evaluation of the results...156
4.2.3.5.Comparison and evaluation of sensitivity results...158
4.2.4. BEMUSE Phase II: Conclusions... 162
4.3.BEMUSE Phase III: Uncertainty and Sensitivity Analysis of the LOFT L2-5 Test...163
4.3.1. Uncertainty Evaluation by CIAU ... 163
4.3.2. Comparison among Participants... 170
4.3.2.1.Selection of input uncertain parameters, uncertainty ranges and phenomena...170
4.3.2.2.Uncertainty analysis results...172
4.3.2.3.Critical study of Wilks’ formula and complementary analyses...179
4.3.3. Critical Evaluation of the Results ... 181
4.4.BEMUSE Phase IV and V: Main Results and CIAU Applications...182
4.4.1. The Definition of the Problem ... 182
4.4.2. Best Estimate Calculation by Relap5... 183
4.4.2.1.Zion NPP nodalization...183
4.4.2.2.Steps of the ZION NPP nodalization qualification process...187
4.4.2.4.Kv-Scaling analysis: ZION NPP nodalization scaled to
LOFT L2.5 experiment...191
4.4.2.5.RELAP5 ZION NPP: Reference transient calculation....197
4.4.2.6.RELAP5 ZION NPP: Sensitivity calculations...203
4.4.3. Uncertainty Evaluation of ZION NPP LBLOCA DEGB Transient ... 206
4.4.3.1.CIAU application and results...206
4.4.3.2.Sensitivity analysis to support CIAU uncertainty evaluation...212
5. DETERMINISTIC METHODS FOR S&U ANALYSIS OF LARGE-SCALE SYSTEM ... 221
5.1.Mathematical Representation of the Physical System...222
5.2.Deterministic Method for Local Sensitivity and Uncertainty Analysis...225
5.2.1. The Forward Sensitivity Analysis Procedures (FSAP) ... 227
5.2.2. The Adjoint Sensitivity Analysis Procedure (ASAP) ... 230
5.2.3. Local Uncertainty Analysis... 231
5.3.Global Sensitivity Analysis...235
5.3.1. Mathematical Framework and Critical Points ... 236
5.3.2. Local Sensitivity Analysis of Critical Points ... 239
5.4.Data Adjustment and Assimilation (DAA) Methodology...240
5.4.1. Off-Line Data Adjustment/Assimilation with Foresight... 242
5.4.2. Other Data Adjustment/Assimilation Algorithms... 248
6. A PIONEERING DETERMINISTIC METHOD FOR UNCERTAINTY ANALYSIS AND A DEMONSTRATIVE APPLICATION... 249
6.1.The CASUALIDAD Method (Code with the capability of Adjoint Sensitivity and Uncertainty AnaLysis by Internal Data Adjustment and assimilation)...250
6.1.1. The Bases of the Method... 250
6.1.2. The Structure of the Method ... 252
6.2.The Demonstrative Application: the Blowdown Paradigm Problem...257
6.2.1. The Gas Blowdown Process... 258
6.2.2. The SIM-CODE... 259
6.2.2.1.Description of the system...259
6.2.2.2.Derivation of the non-linear system equations...261
6.2.2.3.Physical properties of nitrogen and air...263
6.2.2.5.Discretization of the differential system equations...270
6.2.2.6.Numerical solution of the discretized system...274
6.2.3. Validation against Experimental Results ... 275
6.3.The Deterministic Sensitivity Analysis Procedures...280
6.3.1. Derivation of FSAP for the SIM-CODE ... 281
6.3.2. Derivation of ASAP for the SIM-CODE... 286
6.3.3. Derivation of Direct Discretized Derivatives System Method for the SIM-CODE... 290
6.3.4. Implementation in CASUALIDAD and Comparison of the Results ... 296
6.4.The Uncertainty Evaluation...301
6.4.1. Derivation of the Propagation of Errors Method for the SIM-CODE and Results ... 302
6.4.2. Derivation of the DAA Procedure for the SIM-CODE and Results ... 308
6.5.Summary and Future Developments...314
7. CONCLUSIONS... 317
7.1.Main Achievements...319
7.2.Specific Remarks and Future Works...320
REFERENCES ... 323
APPENDIX A: THE TEST MATRIX FOR THE CIAU 2008 DATABASE A-1. Identification of the Available Database
A-2. Text Matrix for Uncertainty Evaluation based on Accuracy Extrapolation
APPENDIX B: DDDSM FOR THE TIME DEPENDENT EVALUATION OF DERIVATIVES RESPECT TO CODE MODEL AND INPUT NODALIZATION PARAMETERS
B-1. Possible Uses of the Derivatives into the Process of the Nodalization Qualification
B-2. The Mathematical Derivation of the DDDSM for a Thermal-Hydraulic System Code (RELAP5) APPENDIX C: DERIVATIVES FOR THE SIM-CODE
C-1. The Mathematical Representation of the Problem C-2. Derivatives of N Respect to State Variable (N1')
C-3. Derivatives of N Respect to System Parameters (
N
'2)C-4. Derivatives of hN ,
h
A ,F
out, W Respect to State VariablesC-5. Derivatives of hN ,
h
A ,F
out, W Respect to SystemParameters
C-6. Implementation of the Derivatives into the SIM-CODE APPENDIX D: IMPLEMENTATION OF DAA INTO CASUALIDAD
D-1. DAA Formulas into CASUALIDAD for the Blowdown Problem
LIST OF FIGURES
Figure 2.1 : Concept of safety margins respect to BEPU and conservative approaches……….. …11 Figure 2.2: Comparison between results of the original Shah correlation
for condensation heat transfer coefficient and Shah correlation after implementation in the Cathare code………... …16 Figure 2.3: User effect in interpreting the available information (pressure
drops across steam generator) from experiment……….. …16 Figure 2.4: User effect in accepting (and qualifying) a steady state
calculation……… …16 Figure 2.5: Computer/compiler effect: same code version and same input
deck run on different computational platforms produces different results (reference to a qualified input-deck)……… …18 Figure 2.6: Nodalization effect: same facility modeled with different
number of control volumes……… …18 Figure 2.7: Imperfect knowledge of boundary conditions: effect of steam
generator secondary side heat losses on the prediction of the peak cladding temperature……… …18 Figure 2.8 : Uncertainty methods based upon propagation of input
uncertainties……… …22 Figure 2.9: Spread of the upper limit of PCT using Wilks’ formula at first
and second order (KAERI analysis)……….…22 Figure 2.10: Uncertainty methods based upon propagation of output
uncertainties……… …23 Figure 2.11: Uncertainty methodology based on Adjoint Sensitivity Analysis
Procedure and Data Adjustment/Assimilation……… …24 Figure 2.12: TRUE, influence of the nodalization choices………..…27 Figure 2.13: TRUE, influence of the code versions………. …27 Figure 2.14: TRUE, consideration of bifurcation analysis by CIAU (tree of
uncertainty bands)... …27 Figure 2.15: The CSAU methodology framework……… …30 Figure 2.16: UMAE flow diagram (also adopted within the process of
development and application of CIAU)……… …35 Figure 2.17: Calculated one-sided 95%/95% uncertainty limit and BE
reference calculation compared with a “conservative” calculation of rod clad temperature………..…43 Figure 2.18: Sensitivity measures of the blowdown PCT with respect to the
selected 56 uncertain input parameters.………..……….. …43 Figure 2.19: Sensitivity measures of the reflood PCT with respect to the
selected 56 uncertain input parameters.………..……….. …43 Figure 2.20: Peak clad temperature (PCT) from the ASTRUM 124-runset…. …43 Figure 2.21: Oxidation and PCT from the ASTRUM 124-runset.….…………. …43
Figure 2.22: Clad temperature traces at the PCT elevation for the top-10
ranked PCT cases in the ASTRUM 124 runset………. …43
Figure 2.23: Scatter plot of operational parameters (AREVA NP RLBLOCA) …50 Figure 2.24: PCT versus break size scatter plot from 59 calculations……... …50
Figure 2.25: Minimum, mean and maximum PCT (independent of elevation) for limiting break for the 3-loop sample problem... …51
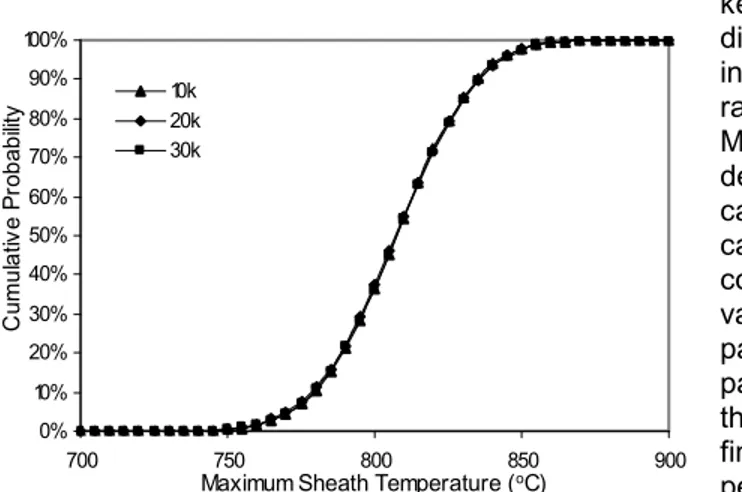
Figure 2.26: Convergence distribution function for the maximum sheath temperature with ±3 σ... …53
Figure 2.27: TE deterministic bounding approach... …56
Figure 2.28: Effect of uncertainties and conservatisms on minimum DNBR value... …56
Figure 3.1 : Comparison between ‘time domain’ and ‘phase-space’ representation among selected quantity evolutions characterizing different transients... ...60
Figure 3.2 : Definition of quantity and time errors to be included into the quantity and time uncertainty database... ...61
Figure 3.3 : The error filling process and the error extraction process... ...61
Figure 3.4 : CIAU flow diagram... ...65
Figure 3.5 : Example of derivation of the time error ∆t(i) and of the quantity error ∆Y(i) inside the same (calculated – experimental) phenomenological window... ...68
Figure 3.6 : Structures and filling process of QAM and TAV. QUM and TUV have a similar structure but they contain uncertainty values instead of accuracy values...70
Figure 3.7 : Definitions of Time Uncertainty (TU), Quantity Uncertainty (QU) and Total Quantity Uncertainty (TQU)... ...77
Figure 3.8 : Time, quantity and total quantity uncertainties for two different transients... ...78
Figure 3.9 : Result of CIAU application to Angra-2 LBLOCA analysis: uncertainty bands for rod surface temperature at ‘axial level 9’ of the realistic hot rod, obtained by the reference run... ...79
Figure 3.10 : Angra-2 LBLOCA uncertainty evaluation: final result from the CIAU study and comparison with results of the applicant... ...80
Figure 3.11 : Uncertainty analysis of the ‘200 mm’ LOCA-DBA of VVER-440 NPP: main result from CIAU application... ...81
Figure 3.12 : BE reference 500 mm LBLOCA analysis for Kozloduy Unit 3 NPP: Surface temperature at the PCT location in hot rod and uncertainty bands derived by CIAU application... ...82
Figure 3.13 : Application of CIAU-TN to MSLB: uncertainty bands... ...86
Figure 3.14: Number of tests inside TUV (DB 2003 and DB 2008)... ...94
Figure 3.15 : Number of tests inside QUM (DB 2003 and DB 2008)... ...95
Figure 3.17: Normalized time accuracy (DB 2003 and DB 2008)... ...96
Figure 3.18: Normalized primary pressure accuracy (DB 2003 and DB 2008)... ...97
Figure 3.19 : Normalized primary mass inventory accuracy (DB 2003 and DB 2008)... ...97
Figure 3.20 : Normalized maximum cladding temperature accuracy (DB 2003 and DB 2008)... ...98
Figure 3.21: Normalized time uncertainty (DB 2003 and DB 2008)... ...99
Figure 3.22: Normalized primary pressure uncertainty (DB 2003 and DB 2008)... ...99
Figure 3.23: Normalized primary mass inventory uncertainty (DB 2003 and DB 2008)... ...100
Figure 3.24: Normalized maximum cladding temperature uncertainty (DB 2003 and DB 2008)... ...100
Figure 3.25: Uncertainty bands for the primary pressure of SBLOCA experiment SB-CL-18 (DB 2003 and DB 2008)... ...101
Figure 3.26: Uncertainty bands for the Primary system mass inventory of SBLOCA experiment SB-CL-18 (DB 2003 and DB 2008)... ...102
Figure 3.27: Uncertainty bands for the cladding temperature of SBLOCA experiment SB-CL-18 (DB 2003 and DB 2008)... ...102
Figure 3.28: Internal qualification process at accuracy level: application of the FFTBM to the driving quantities of the test # 39 (IBLOCA) in Table 3.1... ...105
Figure 3.29: Accuracy distribution of the cladding temperature inside the hypercube 9 4 2 3 5 3. The distribution is independent on the type of transient and on the scaling factors of the ITF... ...106
Figure 3.30: Uncertainty distribution of the cladding temperature inside the hypercube 9 4 2 3 5 3. The distribution is independent on the scaling factors of ITF...107
Figure 3.31: Uncertainty distribution of the cladding temperature inside the hypercube 9 4 2 3 5 3. The distribution is independent on the type of transient... ...108
Figure 4.1: Calculated uncertainty range compared with measured values of rod clad temperature in LSTF-SB-CL-18, as predicted by uncertainty methods in UMS... ...113
Figure 4.2: Width of uncertainty bands for the primary pressure as predicted by various uncertainty methods in the UMS... ...118
Figure 4.3: Width of uncertainty bands for the cladding temperature as predicted by various uncertainty methods in the UMS... ...118
Figure 4.4: The steps of the UAM project... ...118
Figure 4.5: LOFT system configuration for Experiment L2-5... ...118
Figure 4.7: Linear heat generation rate profiles... ...121
Figure 4.8: UNIPI nodalization for LOFT L2-5...125
Figure 4.9: Normalized pressure drops distribution versus loop length... ...127
Figure 4.10: UNIPI time trends for absolute pressures... ...118
Figure 4.11: UNIPI time trends for fluid temperatures... ...118
Figure 4.12: UNIPI time trends for mass flow rates... ...118
Figure 4.13: UNIPI time trends for ECCS integral mass and primary side mass... ...118
Figure 4.14: UNIPI time trends for cladding temperatures... ...118
Figure 4.15: UNIPI sensitivity calculations: ∆PCT & ∆tref... ...138
Figure 4.16: UNIPI sensitivity calculations: UP pressure, PS mass inventory, cladding temperature... ...118
Figure 4.17: Global acceptability factors resulting from nodalization qualification... ...142
Figure 4.18: Comparison of normalized pressure curves along the loop for all participants... ...145
Figure 4.19: Resulting time sequence of events (0-120 s)... ...147
Figure 4.20: Comparison of time trends of intact loop pressure in hot leg... ...147
Figure 4.21: Comparison of time trends of break flow rate in cold leg... ...148
Figure 4.22: Comparison of time trends of primary side total mass... ...148
Figure 4.23: Comparison of hot rod temperature (2/3 level)... ...149
Figure 4.24: First PCT and time of first PCT as function of linear power in the PCT location... ...150
Figure 4.25: Distributions of AA per parameters... ...155
Figure 4.26: Distributions of AA per participants... ...155
Figure 4.27: Distribution of AAP1 and AATOT... ...157
Figure 4.28: Distribution of global acceptability factors & global average accuracy (AATOT)... ...157
Figure 4.29: ∆PCT distribution per parameters...159
Figure 4.30: ∆PCT distribution per participants... ...159
Figure 4.31: ∆PCT Gaussian distribution curves per parameters... ...160
Figure 4.32: ∆tref distribution per parameters... ...161
Figure 4.33: ∆tref distribution per participants... ...161
Figure 4.34: ∆tref Gaussian distribution curves per parameters... ...162
Figure 4.35: Distribution of time uncertainty (TU) and time error in CIAU...166
Figure 4.36: Upper plenum pressure: experimental, reference, sensitivity (from Phase II) calculations and uncertainty bands... ...168
Figure 4.37: Primary system mass inventory: experimental, reference, sensitivity (from Phase II) calculations and uncertainty bands... ...169
Figure 4.38: Cladding temperature at 2/3 core height: experimental, reference, sensitivity (from Phase II) calculations and
uncertainty bands...169
Figure 4.39 : Comparison between the ranges of variation selected by the participants for the decay heat and the critical heat flux... ...175
Figure 4.40 : Uncertainty analysis results for four single-valued output parameters... ...175
Figure 4.41 : Maximum cladding temperature: difference between upper band and reference calculation predicted by each participant.... ...175
Figure 4.42 : Uncertainty analysis for the maximum cladding temperature – sample cases... ...177
Figure 4.43 : Width of the uncertainty bands for the upper plenum pressure.. ...177
Figure 4.44 : Uncertainty analysis for the upper plenum pressure – sample cases...177
Figure 4.45 : Comparison of the sensitivities obtained for the 1st PCT with 100 and 1000 code runs... ...180
Figure 4.46 : RELAP5/Mod3.2 ZION NPP model nodalization... ...184
Figure 4.47 : RELAP5/Mod3.2 nodalization of the ZION reactor pressure vessel... ...184
Figure 4.48 : ZION NPP fuel assembly grouped in 5 groups of RELAP5 heat structures... ...184
Figure 4.49 : ZION NPP fuel assembly grouped in 5 groups of RELAP5 heat structures... ...186
Figure 4.50 : RELAP5/Mod3.2 nodalization of the ZION intact loop... ...186
Figure 4.51 : RELAP5/Mod3.2 nodalization of the ZION broken loop... ...186
Figure 4.52 : UMAE qualification steps for BEMUSE Phase II and IV... ...186
Figure 4.53: Normalized pressure distribution versus loop length... ...191
Figure 4.54: Break areas for the ZION-Kv scaled calculation... ...192
Figure 4.55: ZION Kv, upper plenum pressure... ...192
Figure 4.56: ZION Kv, primary side mass inventory... ...192
Figure 4.57: ZION Kv, total integral break mass flow rate... ...192
Figure 4.58: ZION Kv, total integral ECCS mass flow rate... ...192
Figure 4.59: ZION Kv, average rod cladding temperature (top elevation)... ...192
Figure 4.60: ZION Kv, hot rod cladding temperature (2/3 core height)... ...192
Figure 4.61 : ZION NPP reference calculation: primary pressure time trends. ...198
Figure 4.62 : ZION NPP reference calculation: liquid masses time trends... ...200
Figure 4.63 : ZION NPP reference calculation: hot rod surface temperature time trends... ...200
Figure 4.64: ZION NPP reference calculation: bottom-up and top-down reflooding in the hot rod... ...201
Figure 4.65: ZION NPP reference calculation: PCT in the core (different radial and axial position)... ...201
Figure 4.66: ZION NPP reference calculation: Time Of Reflooding (TOR) in
the core (different radial and axial position)... ...202
Figure 4.67: ZION NPP reference calculation: PCT and TOR in the core (different radial and axial position)... ...202
Figure 4.68: ∆PCT & ∆tref results for each sensitivity calculation... ...204
Figure 4.69 : Time trends of upper plenum pressure for each sensitivity calculation... ...204
Figure 4.70 : Time trends of primary system mass inventory for each sensitivity calculation... ...205
Figure 4.71: Time trends of hot rod surface temperature (zone 5 – 2/3 core height) for each sensitivity calculation... ...205
Figure 4.72 : Distribution of Quantity Uncertainty (QU) inside the hypercubes (values normalized to the maximum value of primary pressure, primary mass inventory and fuel clad temperature respectively)... ...206
Figure 4.73 : Upper plenum pressure - reference calculation (Phase IV) and CIAU uncertainty bands... ...209
Figure 4.74 : Primary system mass inventory - reference calculation (Phase IV) and CIAU uncertainty bands... ...209
Figure 4.75 : Hot rod cladding temperature (at 2/3 core height) - reference calculation (Phase IV) and CIAU uncertainty bands... ...210
Figure 4.76 : Maximum cladding temperature (Max_TC) - reference calculation (Phase IV) and CIAU uncertainty bands... ...210
Figure 4.77 : Nodalization effect on the first PCT... ...210
Figure 4.78 : Nodalization effect on the PCT... ...210
Figure 4.79 : Nodalization effect on the PCT time... ...210
Figure 4.80 : Nodalization effect on the full core quenching time... ...210
Figure 4.81 : Nodalization effect on the mass inventory... ...210
Figure 4.82 : Nodalization effect on the time when the minimum mass is reached... ...210
Figure 4.83 : Nodalization effect on the time when the accumulator starts to inject...210
Figure 4.84 : Nodalization effect on time when the accumulator ends to inject...210
Figure 4.85 : Upper plenum pressure: uncertainty bands and sensitivity results... ...217
Figure 4.86 : Primary system mass inventory: uncertainty bands and sensitivity results... ...217
Figure 4.87 : Hot rod cladding temperature: uncertainty bands and sensitivity results... ...218
Figure 4.88 : Single value output parameters: uncertainty bands and sensitivity results... ...219
Figure 6.1: The basic idea and framework of the CASUALIDAD method... ...251
Figure 6.2: Flow-chart of CASUALIDAD method: development process... ...254
Figure 6.3: Flow-chart of CASUALIDAD method: application process... ...256
Figure 6.4: Sketch of the blowdown system simulated in SIM-CODE... ...259
Figure 6.5: Nitrogen physical properties………. ...265
Figure 6.6: Dependence of Fbreak on external and internal pressure... ...266
Figure 6.7: Spatial discretization inside the thickness S of the vessel wall... ...270
Figure 6.8: Sample results from SIM-CODE... ...276
Figure 6.9 : Experimental results from test I1. Hatched regions span experimental measurements...277
Figure 6.10: Comparison between experimental and calculated pressure inside the vessel (test I1)... ...279
Figure 6.11: Comparison between experimental and calculated temperature (test I1)... ...279
Figure 6.12: Discrete adjoint sensitivity method...279
Figure 6.13: Implementation of sensitivity methods for SIM-CODE in CASUALIDAD... ...297
Figure 6.14: Responses variations for 1% variation of the parameter k…….. ...298
Figure 6.15: Responses variations for 1% variation of of the parameter D.... ...299
Figure 6.16: Responses variations for 1% variation of of the parameter Nk(T5;P5)... ...299
Figure 6.17: Sensitivity of selected responses respect with α ...300 i Figure 6.18: Some sensitivity profiles for gas pressure and gas temperature...301
Figure 6.19: Implementation of DAA method for SIM-CODE in CASUALIDAD... ...303
Figure 6.20: Uncertainty bands of computed responses (as derived by ‘sandwich rule’)... ...306
Figure 6.21: Covariance values between responses at different time instants (as derived by ‘sandwich rule’). Values normalized with the response values at selected instants... ...307
Figure 6.22: Covariance values between two responses at different time instants (as derived by ‘sandwich rule’). Values normalized with the response values at time zero...308
Figure 6.23: Improved estimate of the uncertainty bands of selected response (as derived by DAA). Comparison with results from the ‘sandwich rule’... ...314
LIST OF TABLES
Table 2.1 : Drawbacks and benefits of the conservative and BEPU approaches... ...12 Table 2.2: Main uncertainty classes and cross-reference to sources of
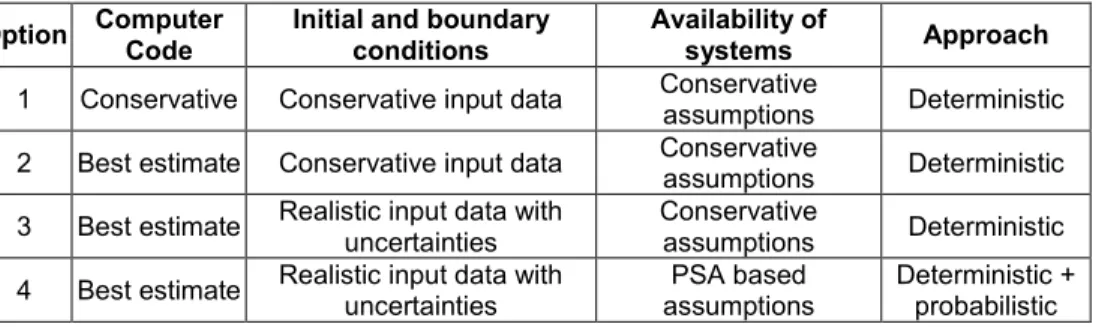
uncertainty... ...20 Table 2.3: GRS method - number of minimum calculations... ...34 Table 2.4: Various options for combining computer code and input data
(IAEA)... ...38 Table 2.5: PWR uncertainty contributors in Westinghouse BE
methodology... ...46 Table 2.6: Sample results of various BE LOCA analyses (comparison
between the 1996 EM and 2004 ASTRUM EM)... ...49 Table 2.7 : Statistics of the Calculated Distribution of Acceptance
Parameters... ...53
Table 3.1 : Subdivision of driving quantities (Q) into intervals... ...63 Table 3.2 : Subdivision of transient time into intervals*... ...63 Table 3.3 : List of procedures and computer tools necessary to develop
and to run the CIAU... ...66 Table 3.4 : List of time events used for identifying comparable time spans
in the experimental and calculated trends (input to the AFE computer tool)... ...67 Table 3.5 : Data inside QAM (sample)... ...71 Table 3.6 : Data inside TAV (sample)... ...72 Table 3.7 : Subdivision of the new driving quantities into intervals... ...83 Table 3.8 : New uncertainty matrixes and vectors in CIAU-TN...84 Table 3.9 : Main feature of some ITFs belonging to the CIAU database
2008... ...90 Table 3.10: Transients belonging to the CIAU database 2008 (DB 2008)... ...91 Table 3.11 : Subdivision of the tests of CIAU DB 2008 in transient classes... ...94
Table 4.1: Assumptions about characteristics of uncertainties in the UMS. ...110 Table 4.2: Comparison between UMS methods... ...111 Table 4.3: LOFT geometry... ...121 Table 4.4: Power distribution in each rod and in each zone... ...123 Table 4.5: LOFT L2-5 system initial conditions... ...123 Table 4.6: LOFT L2-5 sequence of imposed events... ...124 Table 4.7: BEMUSE Phase II: planning of sensitivity study... ...124 Table 4.8: RELAP5 code resources used for the UNIPI nodalization... ...126 Table 4.9: RELAP5 code resources used for the UNIPI nodalization... ...126
Table 4.10: UNIPI nodalization qualification and steady state data table... ...128 Table 4.11: UNIPI resulting time sequence of events... ...129 Table 4.12: UNIPI qualitative accuracy evaluation of time trends... ...130 Table 4.13: UNIPI judgment of code calculation performance on the basis
of phenomena included in the CSNI matrix (LOFT facility)... ...135 Table 4.14: UNIPI RTAs suitable for qualitative accuracy evaluation... ...136 Table 4.15: UNIPI quantitative accuracy evaluation by FFTBM... ...137 Table 4.16: List of participants, codes and nodalization resources used in
BEMUSE phase II... ...141 Table 4.17: Nodalization qualification – comparison between participants... ...143 Table 4.18: RTAs suitable for qualitative accuracy evaluation... ...151 Table 4.19: RTAs suitable for qualitative accuracy evaluation... ...154 Table 4.20: Output parameters for uncertainty and sensitivity analysis
(Phase III)... ...164 Table 4.21: Transients utilized in CIAU uncertainty database for
LOFT L2-5...165 Table 4.22: Hypercubes selected during LOFT L2-5 transient and quantity
uncertainty (QU)...166 Table 4.23: Total uncertainty TQU at some selected instants during the
transient... ...167 Table 4.24: Uncertainty evaluation for single value output parameters... ...168 Table 4.25 : Number of input parameters considered for each phenomenon
/ physical law by each participant... ...171 Table 4.26: Types of input uncertain parameters considered by each
participants...171 Table 4.27 : Maximum cladding temperature: main features of uncertainty
results and reference calculation... ...174 Table 4.28 : Number of code runs and output parameters considered for
the complementary analysis... ...179 Table 4.29 : ZION NPP power subdivision among the five RELAP group of
heat structures... ...186 Table 4.30: Fuel rod characteristics (hot condition for the average rod)... ...187 Table 4.31: RELAP5 nodalization code resources... ...188 Table 4.32: Maximum linear power and location... ...188 Table 4.33: Nodalization qualification and steady state data table... ...190 Table 4.34: Kv scaled features of the ZION Kv nodalization... ...193 Table 4.35: Comparison between ZION Kv scaled calculation and LOFT
L2-5 Experiment: Resulting events... ...194 Table 4.36: Resulting time sequence of events... ...198 Table 4.37: List of Relevant Thermalhydraulic Aspects... ...199 Table 4.38: List of sensitivity calculations and ∆PCT & ∆tref results... ...203
Table 4.39 : Hypercubes selected during ZION NPP DEGB LBLOCA transient and Quantity Uncertainty...207 Table 4.40 : Cross matrix between phenomena (not exhaustive list)
occurring in ZION NPP DEGB LBLOCA and experiments in CIAU Database (not full list) in Table 4.21... ...208 Table 4.41 : Single value output parameters... ...211 Table 4.42 : Total Uncertainty (Quantity ‘+’ Time) at some selected time
instants...211 Table 4.43 : Sensitivity calculations: nodalization effect (S#) and BEMUSE
Phase IV (SB#.a, SB#.b) sensitivities... ...213
Table 6.1: Nitrogen properties (γP ,Tr s
N,z )……… ...263
Table 6.2: Air properties Tk,
A q
γ (at about 1 atm)... ...265 Table 6.3: Uncertainty values of the physical properties of nitrogen and
air... ...266 Table 6.4: Accuracy values for the measurements... ...276 Table 6.5 : Size of the error bands for gas and wall temperatures
(generated from different measurement positions of the thermocouples)... ...277 Table 6.6: Reference values of the system parameters used for
experiment I1... ...278 Table 6.7: Sensitivity methods and needed resources... ...296 Table 6.8: Uncertainty values for the input parameters (95% probability)... ...306
LIST OF ACRONYMS
AA Accuracy Analysis
AFE Accuracy Finalized to Extrapolation (tool in CIAU) ASAP Adjoint Sensitivity Analysis Procedure
ASM Analytical Simulation Model
ATRUM Automated Statistical TReatment of Uncertainty Method
BAF Bottom of Active Fuel
BC Base Case
BDBA Beyond Design Basis Accident
BE Best Estimate
BEAU Best Estimate Analysis and Uncertainty
BEMUSE Best-Estimate Methods, Uncertainty and Sensitivity Evaluation BEPU Best Estimate Plus Uncertainty
BIC Boundary and Initial Conditions
BST Blowdown Suppression Tank
BT Bayesian Theorem
BWR Boiling Water Reactor
CASUALIDAD Code with the capability of Adjoint Sensitivity and Uncertainty AnaLysis by Internal Data ADjustment and assimilation CCFL Counter Current Flow Limiting or Limitation
CFD Computational Fluid Dynamics
CFR Code of Federal Regulations
CFR Code of Federal Regulations
CHF Critical Heat Flux
CHFR CHF Ratio
CIAU Code with capability of Internal Assessment of Uncertainty CIAU-TN Extension of CIAU to Thermal-hydraulic and 3D Neutron-kinetics
CL Cold Leg
CRP Coordinated Research Project (of IAEA) CSAU Code Scaling, Applicability and Uncertainty CSNI Committee on the Safety of Nuclear Installations CV+J Control Volume plus Junction (approach)
CWO Core-Wide Oxidation
DAA Data Adjustment and Assimilation DASM Discrete Adjoint Sensitivity Method DAST Data Analysis for Statistical Treatment
DB DataBase
DBA Design Basis Accident
DC DownComer
DDDSM Direct Discretized Derivatives System Method
DEGB Double Ended Guillotine Break
DIMNP Department of Mechanical, Nuclear and Production Engineering DNB Departure from Nucleate Boiling
DNBR DNB Ratio
ECCS Emergency Core Cooling Systems
EM Evaluation Model
EOP Emergency Operating Procedures
EUR European Utility Requirements
FA Fuel Assembly
FFTBM Fast Fourier Transform Bases Method FSAP Forward Sensitivity Analysis Procedure FSAR Final Safety Analysis Report
GAMA Group on Accident Management and Analysis (of OECD) GASAP Global Adjoint Sensitivity Analysis Procedure
GFM Green’s Function Method
GRS Gesellschaft für Anlagen- und Reaktorsicherheit mbH
HL Hot Leg
HPIS High Pressure Injection System HTC Heat Transfer Coefficient
IAEA International Atomic Energy Agency IAU Internal Assessment of Uncertainty
IBLOCA Intermediate Break Loss Of Coolant Accident
ID Identification
IPA Integral PArameters
ISP International Standard Problem ITF Integral Test Facility
LB Lower Band (of uncertainty)
LBLOCA Large Break Loss Of Coolant Accident
LHS Latin Hypercube Sampling
LMO Local Maximum Oxidation
LOCA Loss Of Coolant Accident LOE Limit of Operating Envelope LOFT Loss Of Fluid Test (facility)
LOFW Loss Of Feed-Water
LP Lower Plenum
LPIS Low Pressure Injection System LSTF Large Scale Test Facility
LUB Lower Uncertainty Bands
LWR Light Water Reactor
MCP Main Coolant Pump
MSLB Main Steam Line Break
NEA Nuclear Energy Agency
NK Neutron Kinetics
NPP Nuclear Power Plant
NRC Nuclear Regulatory Commission
OECD Organization for the Economic Cooperation and Development
PCT Peak Cladding Temperature
PDF Probability Density Function
Ph.W Phenomenological Window
PIE Postulated Initiating Event
PIRT Phenomena Identification and Ranking Table PML Principle of the Maximum Likelihood
PORV Pilot Operated Relief Valve (typically installed in PRZ) PS Primary System (including the steam generators) up to the
isolation valves
PWR Pressurized Water Reactor
QA Quality Accuracy
QAM Quantity Accuracy Matrix
QOBV Quick Opening Blowdown Valve
QU Quantity Uncertainty
QUM Quantity Uncertainty Matrix
RC reference Calculation
RG Regulatory Guide (of US NRC)
RLBLOCA Realistic LBLOCA
RPV Reactor Pressure Vessel
RS Response Surface
RTA Relevant Thermalhydraulic Aspect
SA Sensitivity Analysis
SBLOCA Small Break Loss Of Coolant Accident SETF Separate Effect Test Facility
SIM-CODE Simulator of a SYS-TH code
SLB Steam Line Break
SPDF Subjective Probability Distribution Functions SRRC Standardized Rank Regression Coefficient
SVP Single Valued Parameters
SYS-TH System Thermal-Hydraulics
TA Time Accuracy
TAF Top of Active Fuel
TAV Time Accuracy Vector
TH Thermal-Hydraulics
TMI Three Mile Island
TOR Time Of Reflooding
TPG Technical Program Group TQU Total Quantity Uncertainty
TRUE Topics Relevant for Uncertainty Evaluation
TSE Time Sequence of Events
TU Time Uncertainty
TUV Time Uncertainty Vector
UA Uncertainty Analysis
UAM Uncertainty Analysis in Best Estimate Modeling
UB Upper Band (of uncertainty)
UBEP Uncertainty Bands Extrapolation Process (tool of CIAU)
UE User Effect
UMAE Uncertainty Method based on Accuracy Extrapolation
UMS Uncertainty Method Study
UNIPI UNIversity of PIsa
UP Upper Plenum
UPI Upper Plenum Injection
US NRC Unites States Nuclear Regulatory Commission
US United States
UTP Upper Tie Plate
UTP Upper Tie Plate
UUB Upper Uncertainty Bands
V&V Verification and Validation (for computational tools) VASS Variational Adjoint Sensitivity System
VTS Variational Tangent System
LIST OF SYMBOLS
Greek Symbols
α Vector of system parameters α i β Expansion coefficient
γ Generic nitrogen or air properties
i
δα Increment of the parameter αi
∆ Finite difference θ Wall temperature
λw Thermal diffusivity of vessel wall µ Dynamic viscosity
ρ Density
σ Standard deviation
χ2 Computed and experimentally measured responses consistency indicator
Roman Symbols A Accuracy value
AA Average Amplitude (from FFTBM tool) Ar Break Area
AS Vessel surface area Cd Discharge coefficient
CP Heat capacity at constant pressure Cv Heat capacity at constant volume
CM Covariance matrix of the experimental responses
CR Computed covariance matrix of the responses
Cα Covariance matrix of the system parameters α
CαR Covariance matrix of the system parameters α and responses R
D Vessel internal diameter F Flow rate
Gr Grashof number
h Gas enthalpy or heat flux H Vessel height
h Variational vector
k Thermal conductivity (of nitrogen or air) or ratio between CP and Cv KV Scaling factor
Kw Thermal conductivity of vessel wall M Mass inventory
M Vector of experimental observations n Number of points
Nu Nusselt number
pd Subinterval of the driving quantity Qd P Pressure
Pr Prandtl
q Heat flux through the vessel wall Qd Driving Quantity
R Vector of responses Rj S Vessel wall thickness S Sensitivity Matrix
t Time
T Temperature u Gas internal energy U Uncertainty value
u Vector of dependent (i.e. state) variables
V Volume
W External source of power x Phase-space position vector y Vector of system’s critical points
Y Generic quantity/time trend or object quantity (in CIAU)
Superscripts
0 Nominal values
BIC Boundary, Initial Conditions (parameters characterizing BIC) CODE Code (parameters characterizing CODE)
Hyp Hypercube
IE Improved Estimate
NOD Nodalization (parameters characterizing NOD)
PP Properties and Phenomena (parameters characterizing PP) ν, µ Time nodes
Subscripts 0 Initial value A Air
C Calculation
E Experiment or External side of vessel wall env External environment
I Internal side of vessel wall inj Accumulator injection N Nitrogen
que Core quenching sat Saturation SS Steady State
1. INTRODUCTION
Nuclear power technology has been developed based on the traditional defense in depth philosophy for the design of the plant that was supported by deterministic and overly conservative methods for safety analysis.
In the 1970s conservative hypotheses were introduced for safety analyses to address existing uncertainties. Since then, intensive thermal-hydraulic experimental research has resulted in a considerable increase in knowledge, and the development of computer codes has improved their ability to calculate results that agree with experimental evidences.
The use of a conservative methodology may be so conservative that important safety issues may be masked. For example, the assumption of high core power may lead to high mixture level in the core in the case of Small Break Loss Of Coolant Accident (SBLOCA). Consequently, the calculated peak clad temperature may not be conservative as expected. Therefore, it may be preferable to use a more realistic approach together with an evaluation of the related uncertainties to compare with acceptance criteria. This type of analysis is referred to as a Best Estimate Plus Uncertainty (BEPU) approach and can provide more realistic information about the physical behavior, identifying the most relevant safety issues and supplying information about the actual existing margins between the results of calculations and acceptance criteria.
In addition to the establishment of best-estimate calculations for design and safety analysis, understanding uncertainties is important for introducing appropriate design margins and deciding where additional efforts should be undertaken to reduce uncertainties. For this reason the sensitivity and uncertainty analyses are fundamental tools for providing quantitatively in a mathematically and physically well-founded way answers to typical scientific and engineering questions such as how much the model under consideration represents the physical phenomena, how far the calculated results can be extrapolated and etc…
Models of complex physical systems, like the nuclear reactor power plants, usually involve two distinct sources of uncertainties, namely the stochastic uncertainty, which arises because the system under investigation can behave in many different ways, and the subjective or epistemic uncertainty, which arises from the inability to specify an exact value for a parameter that is assumed to have a constant value in the respective investigation.
Comprehensive uncertainty analysis methodology in complex system models requires treatment of all sources of uncertainty, considering all available information. Complexity of systems and their models with dependency of processes and phenomena can lead to insufficient understanding of simulation code behavior and predictions. In this case, the availability of information and data plays an important role in how uncertainties are quantified. Due to the multiplicity of sources and types of uncertainty and form of available information (qualitative and quantitative), the quantification of uncertainty requires a formal and comprehensive analysis methodology. The methodology shall consider uncertainties in inputs (broadly defined), in models (individual models and interaction among them), and in the outputs.
Based on the above, nuclear power plant analysis and design needs experimentally validated numerical simulation tools, capable of handling the inherently time-dependent and nonlinear nature of the underlying physical phenomena. The existence of large uncertainties in system parameters contributes significantly to discrepancies observed between measured and calculated quantities of interest (henceforth referred to as system responses). A comprehensive and efficient methodology for the experimental validation and calibration of complex time-dependent numerical simulation models has to incorporate both computational and experimental uncertainties. The resulting validated and calibrated models are capable of yielding true “improved-estimate” values for the quantities computed by the respective simulation tools and at the same time can provide a robust way for quantifying the uncertainties in the system parameters.
For those reasons the modeling aspects of Uncertainty Analysis (UA) and Sensitivity Analysis (SA) are at the center of the present activity that has the objective to contribute to the further development and validation on scientific ground of the proposed tools and to support their performance.
1.1.
Historical Background
The concepts of Design Basis Accident (DBA) and the rules and the criteria for the related analysis constitute the fundaments of nuclear reactor safety that were fixed in the seventies (e.g. US NRC 10 CFR50 and Appendix K, [1]) when the large majority of NPP now in operation were designed. Owing to several weaknesses in the knowledge and understanding, conservatisms were introduced at each level of the safety analysis (e.g. acceptance criteria, conservative assumptions in models, conservative input conditions, etc.).
The availability of only conservative models did not allow the calculation of the actual ‘distance’ between a plant status and the acceptability criteria, even in the case of an accident. Thus, nor the ‘safety margins’ could be established in a quantitative manner, neither the optimization of a safety solution could be demonstrated.
This brought to huge research programs in thermal-hydraulics that went on since the seventies and basically were completed in the nineties. The knowledge and the understanding acquired in this period is at the basis of the ‘modern’ safety culture, independent upon the NPP design, and if the case, upon the number of operational years.
Therefore, a modern safety analysis, though accounting for the historical acceptance criteria and established rules, namely of the Regulatory Body in the Country, should also make reference to the fundamentals of the safety technology: - The physical barriers to the release of the fission products;
- The safety functions realized by protective systems or features intended to preserve the integrity of barriers or to mitigate the effect of barrier failures.
This implies the consideration of: a) the most advanced computational tools and techniques, b) the interdisciplinary approach for accident analysis including the connection among different disciplines needed to address complex problems,
c) the recent guidelines issued by US Nuclear Regulatory Commission (NRC) and International Institutions like IAEA and OECD/CSNI and the European Utility Requirements (EUR).
A qualitative understanding of thermal-hydraulic phenomena till the seventies, including a qualitative understanding of the meaning of frequency and probability (i.e. with negligible operational feed-back at the time), was at the origin of the key associated concepts: DBA and Conservatism (code, boundary conditions, Acceptance Criteria, Appendix K approach).
The DBA was intended as a minimum set of enveloping scenarios whose positive-conservative evaluation, within the (overly) positive-conservative Appendix K approach, could ensure that an adequate level of protection is provided by the designers. TMI-2 and also Chernobyl-4 were practical demonstrations that complex accidents out of the DBA list may occur. The needs from operator training and, above all, the progress in the techniques for deterministic and probabilistic accident analysis, i.e. an outcome of the research programs carried out during three-four decades, suggested a change in the conservative approach.
A recent issued OECD/CSNI report, ref. [2], identifies four classes of deterministic methods that can be seen as a historical progress for the licensing approach: 1) Very Conservative (Appendix K for LOCA);
2) Best Estimate Bounding; 3) Realistic Conservative;
4) Use of Best-Estimate Plus Uncertainty (BEPU).
A similar classification was proposed earlier (2003) by IAEA, e.g. ref. [3], in a well known table where “Type of Applied Code”, “Type of BIC (Boundary and Initial Conditions”, “Assumption on System Availability” and “Type of Approach”, are distinguished.
Without entering into detail of the four classes of methods nor of the IAEA table, refs [2] and [3], two remarks apply:
• Drawbacks from the Applicant and from the Licensing Authority side are identified when the approaches 1) to 3) or the ‘conservative’ approaches of the IAEA table are pursued;
• BEPU constitutes the current trend (as also testified by ongoing projects like BEMUSE, IAEA CRP on uncertainty, or recently issued documents like US NRC RG 1.203 and IAEA Safety Series Report on uncertainty methods [4]). The development of BEPU methods had, as specific reference framework, the deterministic accident analysis and the acceptance criteria valid within the conservative approach, i.e. items 1) to 3) above. The BEPU approach in ref. [2] is considered as “… the biggest effort for a proper use of best estimate models in order to minimize unnecessary conservatism while accounting for uncertainties associated to simulation results.”.
The first framework for calculating the uncertainty was proposed by U.S. NRC and denominated Code Scaling, Applicability, and Uncertainty (CSAU) evaluation methodology [5]. The first application of the CSAU methodology resulted in the calculation of the Peak Cladding Temperature (PCT) during a Large Break LOCA