Masthead Logo
University of Iowa
Iowa Research Online
Driving Assessment Conference 2015 Driving Assessment ConferenceJun 23rd, 12:00 AM
Comparison of Novice and Experienced Drivers
Using the SEEV Model to Predict Attention
Allocation at Intersections During Simulated
Driving
Alexander J. Bos
Central Michigan University, Mount Pleasant, MI
Daniele Ruscio
Central Michigan University, Mount Pleasant, MI
Nicholas D. Cassavaugh
Central Michigan University, Mount Pleasant, MI
Justin Lach
Central Michigan University, Mount Pleasant, MI
Justin Lach
Central Michigan University, Mount Pleasant, MI
See next page for additional authors
Follow this and additional works at:https://ir.uiowa.edu/drivingassessment
This Event is brought to you for free and open access by the Public Policy Center at Iowa Research Online. It has been accepted for inclusion in Driving Assessment Conference by an authorized administrator of Iowa Research Online. For more information, please [email protected].
Bos, Alexander J.; Ruscio, Daniele; Cassavaugh, Nicholas D.; Lach, Justin; Lach, Justin; Gunaratne, Pujitha; and Backs, Richard W.. Comparison of Novice and Experienced Drivers Using the SEEV Model to Predict Attention Allocation at Intersections During Simulated Driving. In: Proceedings of the Eighth International Driving Symposium on Human Factors in Driver Assessment, Training and Vehicle Design, June 22-25, 2015, Salt Lake City, Utah. Iowa City, IA: Public Policy Center, University of Iowa, 2015: 120-126.
PROCEEDINGS of the Eighth International Driving Symposium on Human Factors in Driver Assessment, Training and Vehicle Design
120
COMPARISON OF NOVICE AND EXPERIENCED DRIVERS USING THE SEEV MODEL TO PREDICT ATTENTION ALLOCATION AT INTERSECTIONS DURING SIMULATED
DRIVING
Alexander J. Bos1, Daniele Ruscio1, Nicholas D. Cassavaugh1, Justin Lach1, Pujitha Gunaratne2 & Richard W. Backs1
1Central Michigan University Mount Pleasant, MI, USA
2Toyota Motor Engineering & Manufacturing North America Ann Arbor, MI USA
Summary: We compared the eye movements of novice drivers and experienced
drivers while they drove a simulated driving scenario that included a number of intersections interspersed with stretches of straight road. The intersections included non-hazard events. Cassavaugh, Bos, McDonald, Gunaratne, & Backs (2013) attempted to model attention allocation of experienced drivers using the SEEV model. Here we compared two SEEV model fits between those experienced drivers and a sample of novice drivers. The first was a simplified model and the second was a more complex intersection model. The observed eye movement data was found to be a good fit to the simplified model for both experienced (R2 = 0.88) and
novice drivers (R2 = 0.30). Like the previous results of the intersection model for
the experienced drivers, the fit of the observed eye movement data to the intersection model for novice drivers was poor, and was no better than fitting the data to a randomized SEEV model. We concluded based on the simplified SEEV model, fixation count and fixation variance that experienced drivers were found to be more efficient at distributing their visual search compared to novice drivers.
INTRODUCTION
One important area of research is understanding the differences in visual scanning of novice drivers and experienced drivers. Efficacy of visual exploration is a driving expertise factor that differentiates novice drivers and experienced drivers (Jackson, Chapman, & Crundall, 2009). Different types of road intersection can be associated with different variation in visual search, and experienced drivers are able to adapt visual search strategies as a function of driving complexity (Underwood, Crundall & Chapman, 2011). We set out to investigate how
experienced and novice drivers differ in attention allocation at intersections, and to determine differences in the SEEV model fit between experienced and novice drivers.. Attention allocation was only investigated in non-hazard situations.
SEEV is a model of scanning behavior developed by Wickens, Helleberg, Goh, Xu and Horry (2001). SEEV refers to the Salience (S), Effort (Ef), Expectancy (Ex), and Value (R*P) associated with any particular area of interest (AOI). Salience is characterized by how conspicuous events are that occur within a specific visual AOI. Effort is determined by the differences in visual angle between information sources which may inhibit visual scanning. Expectancy is the frequency that relevant information is obtained from a certain AOI. Value is
the product of priority (P; the importance of when to attend to an event) and relevance (R; the applicability of an event to the task being performed). The model describes the probability that a given AOI will attract attention, referred to as P(AOI). Equation 1 below illustrates the SEEV model in prescriptive terms (Horrey, Wickens, & Consalus, 2006; Wickens, Goh, Helleberg, Horrey, & Talleur, 2003; Wickens, et al., 2001).
P(AOI) = S*Ex*(R*P) – Ef (1)
Horry et al. (2006) applied the SEEV model to predict attention allocation to up and head-down displays in simulated driving and interactions with in-vehicle technologies. While they found that the SEEV model fit well, only two AOIs were modeled: the task display and the outside world (OW). Steelman-Allen, McCarley, Wickens, Sebok, & Bzostek (2009) extended the SEEV model to include dynamic salience to create the N-SEEV model. Cassavaugh, Bos, McDonald, Gunaratne, and Backs (2013) attempted to extend the SEEV model to attention allocation to multiple AOIs defined for entities within the OW for experienced drivers. The prediction (R2) using a simplified model like in Horrey et al. (2006) was quite good at 0.88, but
unfortunately, the prediction using the individual entities as AOIs was no better than with a random set of weights. This result may be due in part to reduced scanning behavior among experienced drivers who may be able to extract information more efficiently than inexperienced drivers. In this study we compare the SEEV model for novice and experienced drivers.
METHOD Participants
Data from eight experienced participants (three male and five female; M age of 30.26 years) and ten novice participants (four male and six female; M age 19.00 years) are presented here. The experienced participants had been driving for an average of 13.50 years and the novice participants had been driving an average of 2.50 years at the time of testing. The experienced participants were recruited via advertisements placed in local media and paid for their time. The novice participants were recruited through Central Michigan University’s Department of
Psychology Subject Pool and received extra credit for participation in the study.
Method
Apparatus. A DriveSafety DS-600c simulator was used to for the study. The simulator provided a 180º forward field of view and LCD panels in the side-view and rear-view mirrors provided the rear views. The cab of the simulator was the forward passenger cabin of a Ford Focus.
HyperDrive 1.9.35 (DriveSafety) was used to create the simulator scenarios. The eye movements of participants were recorded using SmartEye Pro 5.5. Three cameras were mounted to the dashboard of the simulator cab. Eye movement data were analyzed using MAPPS 3.1 (EyesDX) software.
Simulator Scenario. The experimental scenario was comprised of seven intersections dispersed throughout approximately 18 km of straight road. The speed limit was 64.4 km/h (40 mph), and a software governor was used to limit participant speed to 72.4 km/h (45 mph) or less. Each
PROCEEDINGS of the Eighth International Driving Symposium on Human Factors in Driver Assessment, Training and Vehicle Design
122
intersection contained non-hazard events that attempted to draw driver attention. The events are listed in Table 1. See Cassavaugh et al. (2013) for the manipulated SEEV parameters.
Procedure. Participants were first informed of the purpose of the study and filled out an
informed consent form. Next, the participants were asked to drive an adaptation scenario to help acclimate them to the simulator. Upon completion of the adaptation, participants were taken to another room to test their visual acuity at near and far distances, collect biographical information and other information on driving behavior and experience. The participants were then taken back to the simulator. A profile was created for the eye tracking system followed by participants driving the experimental scenario. Finally, upon completion of the scenario, experienced
participants were paid, novice participants were granted credit, and the participants were thanked for their time. The entire experiment lasted approximately one hour.
Analysis plan
SEEV Models. As in Cassavaugh et al. (2013), we employed two different SEEV models. First was a simplified model using only three AOIs (Dashboard, Looking Ahead, Other). Second was a more complex model in an attempt to address the question of attention allocation at
intersections. All AOIs in the simplified model were defined as static areas of the display for the entire duration of the driving scenario and were mutually exclusive. The three AOIs
encompassed the entire forward view of the simulator. The AOIs for the intersection model were defined only in the areas near intersections and these were divided into seven three-second epochs for analysis. AOIs were defined separately for each epoch. Each vehicle, signal, sign and the roadway ahead (“Looking Ahead”) were marked as AOIs. Details regarding the development of the model are available in Cassavaugh et al. (2013).
Observed data. Eye tracking data were analyzed based on the marked AOIs, MAPPS produced an output with total fixation times for each AOI based on the marked AOIs. P(AOI) was calculated as the ratio of the total fixation duration on each AOI to the total duration of the epoch.
Model Fit. A linear regression analysis was performed to fit the eye tracking data to the SEEV model. The R2 value for the regression model was used to define goodness-of-fit. Additionally,
one-way ANOVAs were used to test differences between the regression line slopes based on driving experience.
Fixations and variance of visual search: We also calculated the variance of all fixations while approaching the intersections as well as the fixation count towards: traffic lights, vertical and
Table 1. List of the non-hazard events presented at intersections
Intersection # SEEV Parameter Manipulation Intervening Vehicle Behavior Traffic Light Status
1 None Left turn from West lane Red 2 Expectancy Right turn from South lane Green 3 Expectancy Left turn from East lane Red 4 Value Right turn from North lane Green 5 Value Left turn from South lane Red 6 Expectancy Right turn from West lane Green 7 Value Left turn from North lane Green
horizontal road signals, and vehicles in the intersections. More demanding intersections should be associated with less wide, longer and more frequent fixations, and experienced drivers are expected to look for potentially important information about temporally unfolding AOIs more efficiently than novice drivers.
RESULTS
Simplified Model
The parameters used for the simplified model are presented in Table 2. The simplified model parameters are ordinal rankings based upon the implemented manipulations within the scenario (Horrey et al., 2006). The simplified model predicted 6% of total fixation time would be on the dashboard, 82% of the time would be looking down the road (Ahead), and 12% on other areas (Other). A regression analysis was performed to fit the observed data to the predicted data for experienced drivers and novice drivers separately. We found that the simplified model
successfully predicted 88% of the variance in the observed data for experienced drivers and 30% of the variance in the observed data for novice drivers (see Figure 1). ANOVA was performed to test for a driving experience difference in the slopes obtained from the simplified model. We found a significant difference between the slopes of the regression line for driving experience, F(1,16) = 5.28, p < .05, η2 = .24.
Table 2. Simplified SEEV Model Parameters
AOI Relevance Priority Expectancy
Other 1 2 2
Dash 2 1 1
PROCEEDINGS of the Eighth International Driving Symposium on Human Factors in Driver Assessment, Training and Vehicle Design
124
Figure 1. Regression results for fitting the simplified model to the observed data. Experienced N=8; Novice N = 11
Intersection Model
The results of fitting the intersection model to the 8 experienced drivers and 10 novice drivers are presented in Tables 3 and 4 below. For experienced drivers the average R2 was 0.034, and for
novice drivers the average R2 was 0.031. Thus, the present intersection SEEV model does not
provide a good prediction of scanning behavior for experience or novice drivers. A random set of SEEV parameters was generated and fit to the observed data to provide a comparison to the intersection model. The random SEEV model was still a poor fit for both experienced drivers (R2
= 0.062) and novice drivers (R2 = 0.070). The slopes of the regression lines for the intersection
model were not significantly different based on driving experience, F(1,16) = 0.09, p > .05.
Table 3. Experienced Average Regression Results for two SEEV Models
Intersection Model Random SEEV Model
Slope Intercept R2 Slope Intercept R2
-0.111 0.068 0.034 -.0475 0.055 0.062
Table 4. Novice Average Regression Results for two SEEV Models
Intersection Model Random SEEV Model
Slope Intercept R2 Slope Intercept R2
-0.039 0.028 0.031 -.0449 0.040 0.070
Fixations and variance of visual search
Repeated-measures ANOVA for all AOI was performed to test differences in fixation duration, count and spread, between experienced and novice drivers. No differences emerged for vertical and horizontal spread. Experienced drivers presented overall longer mean durations in the AOIs
(M = 0.70; SD = 0.08 sec.) than novice (M = 0.50; SD = 0.04 sec.) and the difference was statistically significant F(1,16) = 13.27, p = .002, η 2= .45. The only AOI that had a different
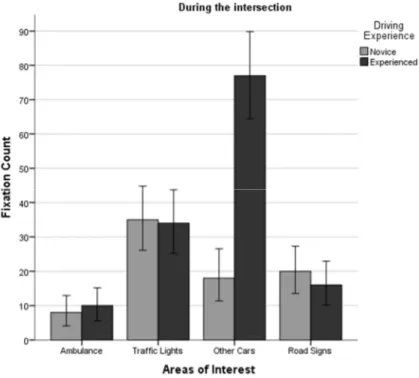
distribution of fixation count for driving experience was “other vehicles” during the
intersections, with more fixations for experienced drivers F(1,16) = 4.14, p = .04, η 2 = .20 (see
Figure 2).
Figure 2. Total fixation count by AOI at all the intersections combined
DISCUSSION
When approaching road intersections it is important to monitor target locations where potentially useful information for safe driving can be found. Similar to the results of Horrey et al. (2006), modeling attention using the simplified SEEV model was found to be a strong predictor of the observed data. The simplified model was also a much better predictor for experienced drivers’ visual attention compared to the novice drivers. Additionally, the fact that experienced drivers had overall longer durations in the target AOIs (traffic lights, vertical and horizontal road signals, and vehicles in the intersections) in spite of a similar distribution of vertical and horizontal spread of fixations, means that a more efficient visual search strategy is adopted by experienced drivers that optimizes the gaze mainly towards salient elements of the intersection. Novice drivers seemed to not have similar strategies, especially for the interactive elements of the intersection (like other vehicles) that require more frequent fixation to monitor unfolding changes in the driving scene, and that could explain the different results predicted by the simplified model.
The intersection SEEV model proved to be a poor predictor of the observed novice data similar to what was found by Cassavaugh et al. (2013) for experienced drivers. We estimated the model parameters based on pilot data obtained via a survey. These parameters clearly did not correctly weight the value and expectancy of the entities presented within the scenario. Subjective ratings
PROCEEDINGS of the Eighth International Driving Symposium on Human Factors in Driver Assessment, Training and Vehicle Design
126
on a Likert scale were collected for the parameters of every entity which may not have been representative of a driver’s actual attention allocation. It is possible that the attempts to report on a cognitive state that is not normally reported may have resulted in errors (Ericsson & Simon, 1980). Specifically, the reported differences between entities may have been too small. Future research should look at alternative methods of scaling the SEEV parameters (e.g., ordinal ranking of all the entities similar to the simplified model).
ACKNOWLEDGEMENTS
This work was funded through a contract from Toyota Motor Corporation, Japan.
REFERENCES
Cassavaugh, N.D., Bos, A., McDonald,C., Gunaratne, P., & Backs, R.W. (2013). Assessment of the SEEV model to predict attention allocation at intersections during simulated
driving. Proceedings of the Seventh International Driving Symposium on Human Factors in Driver Assessment, Training, and Vehicle Design (pp. 334-340). Iowa City, IA: University of Iowa.
Ericsson, K. A., & Simon, H. A. (1980). Verbal Reports as Data. Psychological Review, 87(3), 215-251.
Horrey, W. J., & Wickens, C. D. (2006). Examining the impact of cell phone conversations on driving using meta-analytic techniques. Human Factors, 48(1), 196-205.
Horrey, W. J., Wickens, C. D., & Consalus, K. P. (2006). Modeling Drivers' Visual Attention Allocation While Interacting With In-Vehicle Technologies. Journal of Experimental Psychology: Applied, 12(2), 67-78.
Jackson, L., Chapman, P., & Crundall, D. (2009). What happens next? Predicting other road users’ behaviour as a function of driving experience and processing time. Ergonomics, 52(2), 154–164.
Steelman-Allen, K. S., McCarley, J. S., Wickens, C. D., Sebok, A., & Bzostek, J. (2009). N-SEEV: A Computational Model of Attention and Noticing. Paper presented at the 53rd Annual Meeting of the Human Factors and Ergonomics Society Annual Meeting, San Antonio, TX.
Underwood, G., Crundall, D., & Chapman, P. (2011). Driving simulator validation with hazard perception. Transportation Research Part F: Traffic Psychology and Behaviour, 14(6), 435– 446. doi:10.1016/j.trf.2011.04.008
Wickens, C. D., Goh, J., Helleberg, J., Horrey, W. J., & Talleur, D. A. (2003). Attentional Modeals of Multitask Pilot Performance Using Advanced Display Technology. Human Factors, 45(3), 360-380.
Wickens, C. D., Helleberg, J., Goh, J., Xu, X., & Horrey, W. J. (2001). Pilot Task Management: Testing an Attentional Expected Value Model of Visual Scanning (pp. 23): Aviation