2018
Publication Year
2021-01-27T16:16:32Z
Acceptance in OA@INAF
The 2016-2017 peak luminosity of the pre-main sequence variable V2492 Cygni
Title
GIANNINI, Teresa; Munari, U.; ANTONIUCCI, Simone; Lorenzetti, D.; Arkharov, A.
A.; et al.
Authors
10.1051/0004-6361/201731611
DOI
http://hdl.handle.net/20.500.12386/30050
Handle
ASTRONOMY & ASTROPHYSICS
Journal
611
Number
DOI:10.1051/0004-6361/201731611 c ESO 2018
Astronomy
&
Astrophysics
The 2016–2017 peak luminosity of the pre-main sequence variable
V2492 Cygni
T. Giannini
1, U. Munari
2, S. Antoniucci
1, D. Lorenzetti
1, A. A. Arkharov
3, S. Dallaporta
4, A. Rossi
5, and G. Traven
61 INAF–Osservatorio Astronomico di Roma, via Frascati 33, 00040 Monte Porzio Catone, Italy
e-mail: [email protected]
2 INAF–Osservatorio Astronomico di Padova, via dell’ Osservatorio 8, 36012 Asiago (VI), Italy 3 Central Astronomical Observatory of Pulkovo, Pulkovskoe shosse 65, 196140 St. Petersburg, Russia 4 ANS Collaboration, Astronomical Observatory, 36012 Asiago (VI), Italy
5 INAF–IASF Bologna, Area della ricerca CNR, via Gobetti 101, 40129 Bologna, Italy
6 Faculty of Mathematics and Physics, University of Ljubljana, Jadranska 19, 1000 Ljubljana, Slovenia
Received 21 July 2017/ Accepted 6 October 2017
ABSTRACT
Context.V2492 Cyg is a young pre-main sequence star presenting repetitive brightness variations of significant amplitude (∆R ≥ 5 mag) whose physical origin has been ascribed to both extinction (UXor-type) and accretion (EXor-type) variability, although their mutual proportion has not been clarified yet. Recently, V2492 Cyg has reached a level of brightness ever registered in the period of its documented activity.
Aims.We aim to derive the variation of the mass accretion rate between low- and high-state and to get new insights on the origin of the variability of V2492 Cyg.
Methods.Optical and near-infrared (NIR) photometry and spectroscopy have been obtained in October 2016 and between March and July 2017. The source has remained bright until the end of May 2017, then it started to rapidly fade since the beginning of June at a rate of ∼0.08 mag/day. On mid-July 2017 the source has reached the same low-brightness level as two years before. Extinction and mass accretion rate were derived by means of the luminosity of the brightest lines, in particular Hα and Hβ. A couple of optical high-resolution spectra are also presented to derive information on the gas kinematics.
Results.Visual extinction variations do not exceed a few magnitudes, while the mass accretion rate is estimated to vary from less than 10−8up to a few 10−7 M
yr−1. This latter is comparable to that estimated on the previous high-state in 2010, likely occurred under
more severe extinction conditions.
Conclusions.The combined analysis of the optical and NIR observations extends to the present event the original suggestion that the V2492 Cyg variability is a combination of changing extinction and accretion.
Key words. stars: formation – stars: variables: T Tauri, Herbig Ae/Be – infrared: stars – stars: individual: V2492 Cyg
1. Introduction
Intermittent outbursts of significant amplitude (∆V ∼ 3–5 mag), due to repetitive accretion events onto pre-main sequence (PMS) stars, are referred as EXor phenomena (Herbig 1989, 2008;
Hartmann et al. 2016). These bursts are thought to be trig-gered by instabilities in the inner parts of the circumstellar disk (D’Angelo & Spruit 2010,2012;Armitage 2016). Observation-ally, EXor are quite rare systems, with only a few tens of ex-amples known so far (see e.g.,Audard et al. 2014) and in some cases the classification is uncertain since the observed properties (burst amplitude, cadence, optical/IR colors) are attributable to accretion as well as to extinction episodes related to orbiting dust structures that move along the line of sight (UXors variables,
Grinin 1988). These latter are more compatible with repeating brightness variations with the same period and amplitude, while more erratic variations favor the accretion hypothesis. This is the reason why a photometric and spectroscopic monitoring of sub-sequent outbursts are in order.
In the framework of our monitoring program EXORCISM (Antoniucci et al. 2014), an ideally suited candidate is the young low-mass object V2492 Cyg located in the Pelican Nebula (α2000 = 20h51m26.23s, δ2000 = +44◦05023.900), which has
shown repetitive brightness variations with ∆R >∼ 5 mag. The first recorded episode was discovered on 2010 August 23 by Itagaki & Yamaoka (2010). This event has been followed by brightening and fading events carefully investigated by
Hillenbrand et al. (2013), and interpreted as a quasi-periodical phenomenon consistent with changes of extinction in the in-ner disk material (∆AV <∼ 30 mag). The role of dust
obscura-tion was further enhanced by the study ofKóspál et al.(2013). Based on the constancy of the far-infrared fluxes, these authors conclude that the observed variability is due to the occultation of the inner disk by a dense, long-live dust cloud, and there-fore they regarded V2492 Cyg as a young UXor variable. From a spectroscopic point of view, however, V2492 Cyg presents features more typical of EXor spectra, such as H
i
lines and CO overtone bandheads in emission, as well as signatures of a well developed outflow (Covey et al. 2011;Aspin et al. 2011;Hillenbrand et al. 2013). Therefore, a unified picture of the phys-ical phenomena occuring on V2492 Cyg and in its environment is still lacking.
The most recent (November 2016–March 2017) peak of brightness, the highest ever recorded, has been announced by
Ibryamov & Semkov(2017) and photometrically monitored by
A&A 611, A54 (2018) Table 1. Optical photometry.
MJD Date B V RC IC 57 829 2017 03 17 15.68 13.93 12.88 11.84 57 838 2017 03 26 16.20 14.36 13.27 12.19 57 862 2017 04 19 16.75 14.83 13.67 12.53 57 872 2017 04 29 16.37 14.43 13.27 12.15 57 879 2017 05 05 – 14.50 13.36 12.21 57 896 2017 05 23 – 15.09 – 12.68 57 900 2017 05 27 – 14.89 – 12.59 57 902 2017 05 29 16.71 14.72 13.59 12.46 57 912 2017 06 07 – 16.17 – 13.63 57 930 2017 06 25 – 16.97 – 14.38 57 950 2017 07 16 – 17.60 16.29 15.00
Notes. Errors are about 0.02 mag.
optical and near-infrared (NIR) photometry and spectroscopy taken during this phase of maximum brightness along with the subsequent fading currently ongoing. Observations are described in Sect. 2, while the results are presented and discussed in Sect.3. Our summary is given in Sect.4.
2. Observations 2.1. Photometry
BVRCIC optical photometry (Table1 and Fig.1) has been
ob-tained with the telescope ID 310 operated in Cembra (Italy) by the Asiago Novae and Symbiotic stars (ANS) Collaboration. Data reduction involved correction for nightly bias, dark and flat fields. Full photometric calibration was achieved from APASS survey data (Henden et al. 2012; Henden & Munari 2014) us-ing the SLOAN-Landolt transformation equations calibrated in
Munari(2012) and Munari et al. (2014a,b).
JHK photometry (Table2 and Fig.1) was obtained at the 1.1 m AZT-24 telescope located at Campo Imperatore (L’Aquila – Italy) equipped with the imager and spectrometer SWIRCAM (D’Alessio et al. 2000). All the observations were obtained by dithering the telescope around the target position. The raw imag-ing data were reduced by usimag-ing standard procedures for bad pixel removal, flat fielding, and sky subtraction. Photometric calibra-tion was obtained from the 2MASS photometry of bright stars present in the 40.4 × 40.4 field.
2.2. Spectroscopy
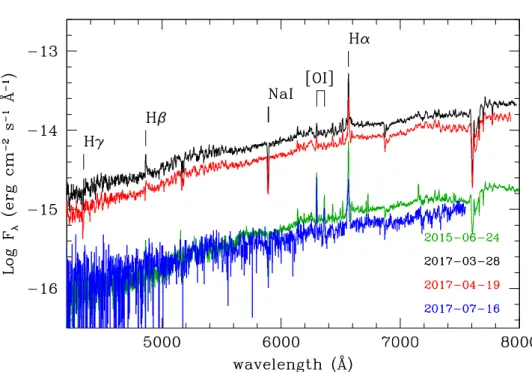
Table3gives the journal of the spectroscopic observations. We obtained four optical low-resolution spectra of V2492 Cyg, shown in Fig.2. The first one was taken using the Multi-Object Double Spectrograph (MODS; Pogge et al. 2010) mounted at the Large Binocular Telescope (LBT) on 2015 June 24, when the source was at a low level of activity (AAVSO1 magnitudes of 2015 June 22: V = 17.6, R = 16.0, I = 14.5). We inte-grated 1500 s in the spectral range 3200−9500 Å by using a 000. 8 slit (< ∼ 1500). Other three low-resolution spectra were
obtained on 2017 March 28, 2017 April 19, and 2017 July 16, being the first two very close in time to the brightness peak, and the last one obtained when the source was already faded. These spectra (∼3500−8000 Å at < ∼ 2400) were obtained with
1 American Association of Variable Star Observers,
(https://www.aavso.org/)
Table 2. NIR photometry.
MJD Date J H K 57 645 2016 09 14 10.88 9.61 8.18 57 646 2016 09 15 10.89 9.66 8.24 57 647 2016 09 16 11.10 9.83 8.35 57 654 2016 09 23 10.95 9.66 8.21 57 656 2016 09 25 11.04 9.71 8.26 57 657 2016 09 26 11.06 9.68 8.21 57 659 2016 09 28 11.20 9.76 8.28 57 661 2016 09 30 11.40 9.90 8.42 57 662 2016 10 01 11.58 10.01 8.48 57 666 2016 10 05 11.20 9.73 8.23 57 694 2016 11 02 10.83 9.53 8.12 57 884 2017 05 11 10.82 9.35 7.87 57 887 2017 05 14 10.72 9.34 7.86 57 888 2017 05 15 10.92 9.48 8.01 57 891 2017 05 18 11.17 9.44 8.13 57 894 2017 05 21 10.86 9.46 7.90 57 895 2017 05 22 10.86 9.46 7.93 57 896 2017 05 23 11.04 9.66 8.12
Notes. Errors are less than 0.03 mag.
Table 3. Journal of the spectroscopic observations.
MJD Date Instr/Tel < Tint
(yyyy mm dd) (s) 57 197 2015 06 24 MODS/LBT 1500 1500 57 665 2016 10 04 LUCI2/LBT 1000 1200 57 829 2017 03 17 ECH/1.82 m 18 000 2400 57 840 2017 03 28 B&C/1.22 m 2400 600 57 852 2017 04 09 ECH/1.82 m 18 000 4200 57 862 2017 04 19 B&C/1.22 m 2400 900 57 950 2017 07 16 B&C/1.22 m 2400 1800
the 1.22 m telescope+ B&C spectrograph (Asiago, Italy) oper-ated by the University of Padova. The steps adopted for of the data reduction are: correction for dark and bias, bad-pixel map-ping, flat-fielding, and extraction of one-dimensional spectrum by integrating the stellar trace along the spatial direction. Wave-length calibration was obtained from the spectra of arc lamps. The Asiago spectra have been calibrated in flux through observa-tions of standards before and after V2492 Cyg, while the MODS spectrum was calibrated by using the AAVSO magnitudes given above.
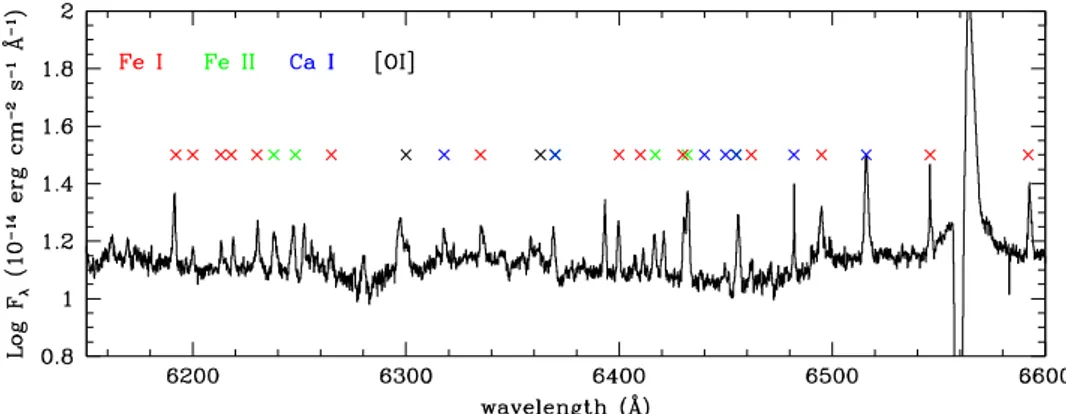
Two high-resolution optical spectra at < ∼ 18 000 were ac-quired on 2017 March 17 and 2017 April 9 in the range 3300−8050 Å with the REOSC Echelle spectrograph mounted on the Asiago 1.82 m telescope. Data reduction and calibration were performed following the same steps cited above. Profiles of interesting lines are shown in Fig.3while a sample interval of the spectrum of March 17 is depicted in Fig.4.
A NIR spectrum at < ∼ 1300 was obtained with LUCI2 at LBT on 2016 October 4, when the source was already in a high-state of activity (Fig.5). The observations were carried out with the G200 low-resolution grating coupled with the 000. 75 slit. The
standard ABB’A’ technique was adopted to perform the obser-vations using the zJ and HK grisms (1.0−2.4 µm), for total in-tegration times of 12 and 8 minutes, respectively. The raw spec-tral images were flat-fielded, sky-subtracted, and corrected for optical distortions in both the spatial and spectral directions. A54, page 2 of8
Fig. 1. Optical and NIR light curve. Our new photometric data are depicted as large open circles, while other points are from AAVSO (dots); Froebrich et al.(2017) (crosses), andIbryamov & Semkov(2017) (open squares). Vertical dotted lines indicate the dates of the spectroscopic observations.
Atmospheric absorptions were removed using the normalized spectrum of a telluric standard star, after fitting its intrinsic spectral features. Wavelength calibration was obtained from arc lamps, while for flux calibration the photometry of the day after the spectroscopic observation was assumed. No intercalibration was performed between the zJ and HK parts of the spectrum, since they were already optimally aligned.
3. Results and discussion 3.1. Light curve
Since its first recorded outburst in 2010, V2492 Cyg has con-tinuously shown a high degree of photometric variability (see e.g., the AAVSO light-curve). In the present paper we con-centrate on the last maximum phase and subsequent declin-ing from September 2016 to July 2017 (MJD from 57 645 to 57 950). In Fig.1, together with our photometric data, we show also some literature (Ibryamov & Semkov 2017;Froebrich et al. 2017) and AAVSO data that optimally trace the brightness evo-lution. The peak of this last event corresponds to V ' 13.5 mag. Previous brightness enhancements, monitored during the last seven years, peaked between 16 and 14 mag in the V band (AAVSO light-curve). In the “extinction-driven” scenario, the light-curve V2492 Cyg roughly resembles that of long-term (years to decades), quasi-cyclic UXor variables, such as, for example, BF Ori (Herbst & Shevchenko 1999), albeit in these sources the amplitude difference between subsequent peaks is definitely lesser (typically a few tens of magnitude) than in V2492 Cyg.
Our NIR monitoring does not cover exactly the five months of maximum brightness, but it significantly samples the peak activity period (September 2016–May 2017, MJD from 57 645 to 57 896) during which the average magnitude fluctuations did
not exceed 0.2 mag in all the NIR bands. An exception is the local brightness drop occurred between MJD= 57 659 and MJD= 57 666 (peak minimum at MJD = 57 662), registered also in the optical AAVSO light-curve. After this event, the NIR brightness has returned to the previous level and then remained fairly stable until the last photometric observation acquired in May 2017.
The optical monitoring started on March 2017
(MJD= 57 829), immediately after the brightness peak, and extended during the course of the declining phase, roughly started on April 2017 and still ongoing at the date of the last photometric point on 16 July 2017 (MJD= 57 950). From the beginning of April to the end of May 2017 the source has slowly faded at a rate of ∼0.01 mag/day, then, since the beginning of June, it started a quick declining at ∼0.08 mag/day, as also shown by recent AAVSO data. This latter speed is similar to that of ∼0.1 mag/day measured byHillenbrand et al.(2013) in three larger brightness drops occurred between 2010 and 2012.
3.2. Photometric diagrams
In Fig.6the photometric data are presented in form of two-colors and magnitude-color plots: [J−H] vs. [H−K] (left panel), [V −R] vs. [R − I] (middle panel), and [V] vs. [V − I] (right panel). NIR colors align well with the extinction vector (law ofCardelli et al. 1989). Their spread corresponds to a∆AV between 1 and 3 mag,
being the reddest colors those of the local brightness minimum occurred at MJD= 57 662 (see Fig.1). This confirms the overall picture derived by the NIR color variations between 2010 and 2012 over a much larger range of magnitudes (∆J ∼ 5 mag), corresponding to∆AV ∼ 30 mag (Hillenbrand et al. 2013).
The optical colors, however, do not fully agree with ex-tinction variability alone. While during the rising and declining phases color variations are consistent with AV changes <∼1 mag,
A&A 611, A54 (2018)
Fig. 2. Optical low-resolution spectra of V2492 Cyg in the four dates reported on the bottom-right. Black, red and blue: 1.22m/B&C; green: LBT/MODS. Main emission/absorption lines are labeled.
Fig. 3. Examples of line profiles in the Echelle spectrum obtained at the reported dates. Interstellar absorption features are marked in the Na
i
profile.at the brightness peak [R − I] becomes significantly redder of about 0.4 mag, while [V − R] maintains roughly constant (see the data ofFroebrich et al. 2017andIbryamov & Semkov 2017
in Fig.6). This behavior is similar to that exhibited by the opti-cal colors of the EXor source V1118 Ori during its 2015 outburst (Fig. 7 ofGiannini et al. 2017).
An even more evident deviation from the reddening vec-tor is evident in the [V] vs. [V − I] data points taken
be-tween June and July 2017 (right panel of Fig.6). This chang-ing in slope is likely contributed by both extinction and accretion rate variations, whose combined effect might also be responsible for the acceleration in the declining speed from 0.01 to 0.08 mag/day (Sect.3.1), observed in the same pe-riod. Noticeably, the observed feature is characteristic of a number of objects, like V1180 Cas (Kun et al. 2011), V1647 Ori (Mosoni et al. 2013), and in particular V346 Nor, where A54, page 4 of8
Fig. 4. A sample segment from our Echelle spectrum of March 17, 2017 that highlights the rich, low ionization emission spectrum presented by V2492 Cyg.
Fig. 5. Near-infrared LBT/LUCI2 spectrum. Main emission lines are labeled.
accretion rate and extinction enhancements appear significantly correlated (Kóspál et al. 2017). Also, the photometric variabil-ity of the PMS source V1184 Tau has been interpreted by
Grinin et al.(2009) as due to repetitive accretion bursts followed by an increase of the geometric thickness of the inner disk rim, which is able to obscure a relevant portion of the central star.
3.3. Description of the observed spectra
The 2010−2012 optical-NIR spectrum of V2492 Cyg has been studied in detail byAspin et al.(2011) andCovey et al.(2011), both in low- and high-brightness phases. It was rich of forbidden, permitted, and recombination atomic lines as well as molecular lines. In our low-resolution optical spectra of March and April 2017 the brightest lines are Hα, Hβ, Hγ, and Na
i
5890/6 Å, with Hγ and Nai
seen in absorption (Fig.2). In these spectra [Oi
]6300 Å is also identified at signal-to-noise ratio of about five, while, together with Hα, it becomes the brightest line in the quiescence spectra of June 2015 and July 2017. In addi-tion, some Hi
lines of the Paschen series and Hei
6678 Å are detected in the MODS spectrum of June 2015. Permitted lines emission of neutral and singly ionized species (mainly Fei
, Feii
,and Ca
i
) is also detected in our high-resolution optical spectra of March and April 2017 (see Fig.4).In the NIR the most prominent lines are the H
i
lines of the Paschen and Brackett series (Fig.5). We also report the detec-tion of the Nai
2.206, 2.207 µm doublet along with CO v= 2–0 and v = 3–1 bandhead emission. Noticeably, in EXor spectra Nai
and CO are seen both in absorption or emission depending on the level of the source activity. Examples are, among others, XZ Tau, PV Cep, V1647 Ori, V1118 Ori (Lorenzetti et al. 2009;Aspin et al. 2008; Giannini et al. 2017), and V2492 Cyg itself (Hillenbrand et al. 2013).
In Table4we give the fluxes of the lines that we have used for the subsequent analysis, and in particular for the determination of the mass accretion rate.
3.4. Mass accretion rate determination
The computation of the mass accretion rate ˙Maccis based on the
empirical relationships by Alcalá et al. (2017), which connect the accretion luminosity Lacc to the luminosity of many
emis-sion lines (Lline) in the optical and NIR range. These
A&A 611, A54 (2018) Table 4. Fluxes of diagnostic lines.
Date F ±∆F
(yyyy mm dd) (10−14erg s−1cm.2)
Hα Hβ Pa10 Pa9 He
i
6678 Å [Oi
]6300 Å2015 06 24 5.07 ± 0.04 0.06 (–0.03) ± 0.01 0.65 ± 0.2 0.7 ± 0.2 0.1 ± 0.03 1.25 ± 0.04
Paδ Paγ Paβ Brγ
2016 10 04 11.8 (–1.2) ± 0.3 20.1 ± 0.4 29.1 ± 0.4 12.1 ± 0.4 Hα Hβ Hγ Ca
ii
-K Hei
6678 Å [Oi
]6300 Å 2017 03 17 41.7 (–5.0) ± 0.2 1.9 (–1.1) ± 0.2 –0.7 ± 0.2 – 0.8 ± 0.1 2.7 ± 0.2 2017 03 28 39.8 ± 0.3 2.6 ± 0.2 – 0.9 ± 0.3 1.0 ± 0.2 2.2 ± 0.4 2017 04 09 15.4 (–2.2) ± 0.3 – – 0.5 ± 0.1 – 2017 04 19 23.4 ± 0.3 1.4 ± 0.3 – <1 – 2.0 ± 0.3 2017 07 16 2.1 ± 0.1 – – – – 1.3 ± 0.1Table 5. Extinction, accretion luminosity and mass accretion rate. Date AV Lacc±∆Lacc M˙acc±∆ ˙Macc
(yyyy mm dd) (mag) (L ) (10−7M yr−1) 2015 06 24 4 0.4 ± 0.1 0.65 ± 0.15 2016 10 04 2.5 4.4 ± 1,1 5.3 ± 0.9 2017 03 17 3 1.4 ± 0.7 1.6 ± 0.8 2017 03 28 3.5 2.8 ± 0.5 2.2 ± 0.8 2017 04 09 3 0.9 ± 0.3 0.6 ± 0.3 2017 04 19 3 0.7 ± 0.2 0.8 ± 0.3 2017 07 16 2.5−5a 0.02−0.3 0.03−0.3
Notes.(a)Assumed range.
sample of Class II sources in Lupus, by modeling the emission observed in excess to the stellar photosphere as the continuum emission of a slab of hydrogen, which provides a independent measurement of Lacc(seeAlcalá et al. 2014;Manara et al. 2013).
Alcalá et al. (2017) provide relations for all the H
i
lines ob-served in our V2492 Cyg spectra, plus the Hei
6678 Å and Ca II K lines.From each of these lines we are able to derive a value of Lacc, provided that the distance and extinction are known, as
we need to convert the measured line fluxes into luminosities. For the distance to the Pelican Nebula, we take d = 550 pc (Bally & Reipurth 2003). Since V2492 Cyg is subject to a highly variable extinction, we preferred not to assume a previously de-termined estimate of AV, so we adopted the following method.
We considered a range of values for AV (from 0 to 30 mag in
steps of 0.5 mag) and for each of these values we computed Lacc
from each line by using the relevant relationship byAlcalá et al.
(2017). This way, we obtained different sets of accretion
lumi-nosities (one for each AV value) that are characterized by di
ffer-ent dispersions. The extinction for which the obtained Lacc
dis-persion shows a minimum is the AVvalue we eventually adopted.
Once the extinction was thus determined, we computed Lacc as
the median value of the accretion luminosities of this least dis-persed set (see e.g.,Giannini et al. 2016, 2017). The AV and Lacc
values derived from this procedure are reported in Table5. In particular, we derived AV = 4 mag in June 2015, and between
2.5−3.5 mag in March and April 2017, which is in reasonable agreement with the indications of the color-color diagrams dis-played in Fig.6. The previous method could not be applied to estimate AV on the spectrum of July 2017, since only Hα is
de-tected there. A reasonable range of AV is derived in this case
by taking as lower limit the same value as in the previous dates (AV= 2.5 mag) and as upper limit the one derived by assuming
that the observed fade is caused only by the extinction increase (AV ∼ 5 mag, see Fig.1).
Finally, we adopted the relation byGullbring et al.(1998) to convert Lacc into ˙Macc:
˙ Macc= LaccR∗ GM∗ 1 − R∗ Rin !−1 , (1)
where M∗ and R∗ are the stellar mass and radius and Rin is the
inner truncation radius of the disk. We consider R∗= 2 R and
M∗= 0.7 M , as evaluated from the EXor HR diagram recently
published byMoody & Stahler(2017), while for the factor 1 − R∗/Rinwe assumed a value of 0.8, which implies a typical inner
disk radius Rin= 5 R∗.
The derived ˙Macc are reported in the final column of Table5.
We find M˙acc ∼ 1.5−5 × 10⁻⁷ M yr−1 during the
high-brightness phase, with fluctuations that roughly follow the pho-tometric evolution. The highest ˙Macc determination is derived on
October 2016. Since it was derived from NIR lines only, how-ever, we cannot exclude that it might be biased, for example, by an underestimate of the AV, to which the NIR lines are less
sensitive than the optical lines, and/or an overestimate of Lacc.
For comparison, we applied the method described above to the H
i
fluxes of two optical spectra obtained between August and October 2010 by Hillenbrand et al. (2013) andAspin et al. (2011). We obtained AV = 5−9 mag and ˙Macc∼
2 × 10⁻⁷M
yr−1, in optimal agreement with the estimates (AV ∼
6–12 mag and ˙Macc≈ 2.5 × 10⁻⁷M yr−1) given byCovey et al.
(2011). Therefore, we can conclude that the 2010 and 2016 brightness enhancements have occurred at a similar level of the intrinsic luminosity but under different obscuration conditions.
As far as the low-brightness spectra is concerned, MODS lines observed in June 2015 are consistent with ˙Macc∼ 5−8 ×
10−8M
yr−1, roughly a factor of approximately ten or less lower
than the peak value. Conversely, a significant drop of ˙Macc might
have occurred on July 2017. A more precise AV estimate,
how-ever, should have been derived to make this result more reliable. Summarizing, at variance for example with the case of V346 Nor, it seems that in V2492 Cyg there is not a simul-taneous increase of mass accretion rate and extinction. Rather, there are evidences for the opposite trend. We remark, how-ever, that our data do not cover the entire variability range dis-played by V2492 Cyg in the past (the minimum registered V is >
∼20 mag, AAVSO light-curve). Observations during a deep min-imum should be of great help to solve the question.
Fig. 6. Left panel: NIR two-color plot [J − H] vs. [H − K]. The red point represents the NIR colors at MJD= 57 662 (see text). Continuous line: locus of T Tauri stars (Meyer et al. 1997). Dotted line: unreddened main-sequence. Dashed line: linear fit through the data. Arrow: extinction vector corresponding to AV = 3 mag (reddening law of Cardelli et al. 1989). The average error is indicated with a cross. Middle panel: optical
two-color plot [V − R] vs. [R − I]. Arrow: extinction vector corresponding to AV = 1 mag. Dotted line: unreddened main-sequence. Red and
dark-red large dots: our data taken before and after June 2017. The green dot represents the colors of 2015 June 22 (AAVSO database). Black data: literature/AAVSO data with the same symbols as in Fig.1. Right panel: [V] vs. [V − I]. Symbols and colors as in the middle panel.
3.5. Line profiles
The two Echelle spectra, obtained at about one a month inter-val from each other, significantly differ, being the spectrum of March 17 much brighter. In this latter, the Balmer lines from Hα to Hδ are detected. Hγ and Hδ are seen only in absorp-tion while Hα and Hβ present composite profiles with a broad emission component slightly red-shifted and a flattened P Cyg absorption extending up to −200 km s−1. The spectrum is rich also in low-lying ionized metallic lines (mainly Fe
i
, Feii
, and Nii
, as depicted in Fig.4). Their FWHM ranges between 45 to 85 km s−1 depending on ion and multiplet. This is typicalof gas in funnel flows close to the disk surface, where photons from the central star are partially shielded (Sicilia-Aguilar et al. 2012;Kóspál et al. 2011;Beristain et al. 1998). All the lines are seen in emission, with the exception of Fe
ii
lines of multi-plet 42 at 4923.93 Å, 5018.45 Å, 5169.03 Å, and possibly Mgi
5183.60 Å (Fig.3). These lines present absorption profiles cen-tered at vlsr= −80 km s−1, FWHM= 154 km s−1and a blue-endvelocity similar to that of Balmer lines and Na
i
doublet. Their profiles are therefore suggestive of an accelerated and ionized gas outflowing in proximity of the star. Conversely to the case of V2492 Cyg, the Feii
lines of multiplet 42 have been observed in emission on the spectra of the EXors DR Tau (Beristain et al. 1998) and EX Lup (Sicilia-Aguilar et al. 2012). In the latter source in addition to the main component in emission they also present a blue-shifted absorption consistent with a wind origin.The [O
i
]6300 Å line is also observed. It presents a dou-ble component, one roughly centered at the rest velocity with FWHM ∼144 km s−1, and a blue-shifted component peaking atabout −100 km s−1and extending up to ∼−200 km s−1, in agree-ment with the permitted wind lines. The [O
i
]6363 Å is detected at a lower signal-to-noise ratio, while the [Nii
] and [Sii
] nebu-lar emission lines reported, among others, byAspin et al.(2011) and byCovey et al.(2011), are absent on our spectra.4. Summary
We have presented optical and NIR photometric and spectro-scopic observations of the PMS variable V2492 Cyg, obtained during the peak luminosity reached on 2016–2017. The main re-sults of our observations can be summarized as follows:
– One cause of the observed brightening is likely a strong de-cline of the local obscuration, with the estimated extinction definitively lower than during faint states (when AV may
in-crease up to 30 mag).
– A significant enhancement of the mass accretion rate has also likely occurred during the investigated period. This is testi-fied by the deviation of the optical colors from the extinction law direction, the detection of Na
i
2.2 µm and CO bands both in emission, and the enhancement of the Hi
fluxes in the high-brightness spectra, and by the variation of the mass accretion rate obtained from the observed line luminosity. The existence of gas in funnel flows is also supported by the detection of metallic lines with width >∼50 km s−1.– We obtain ˙Macc of ∼2−5 × 10⁻⁷M yr−1 at the peak, namely
about a factor up to ten higher than in a fainter state prior the brightness enhancement. Conversely, our analysis suggests that a rapid drop of ˙Macc is ongoing since July 2017. The
˙
Macc value estimated at the brightness peak is similar to that
reached in 2010, this latter likely occurred under more severe obscuration conditions.
– A high-velocity wind is probed by the Hydrogen recom-bination, [O
i
]6300 Å and some Feii
lines. These profiles are characterized by a similar central and terminal velocity, which extends up to −200 km s−1.Acknowledgements. This work is based on observations made with different struments: [1] the LBT. The LBT is an international collaboration among in-stitutions in the United States, Italy and Germany. LBT Corporation partners are: the University of Arizona on behalf of the Arizona university system; Is-tituto Nazionale di Astrofisica, Italy; LBT Beteiligungsgesellschaft, Germany, representing the Max-Planck Society, the Astrophysical Institute Potsdam, and
A&A 611, A54 (2018)
Heidelberg University; The Ohio State University, and The Research Corpo-ration, on behalf of The University of Notre Dame, University of Minnesota and University of Virginia; [2] the Asiago ANS Collaboration telescopes oper-ated under the responsability of the INAF-Osservatorio Astronomico di Padova (OAPd); [3] the AZT-24 IR telescope at Campo Imperatore (L’Aquila – Italy) operated by INAF-Osservatorio Astronomico di Roma (OAR). We acknowledge the observers who contribute to the AAVSO International Database. The authors are grateful to Lynn Hillenbrand for providing her spectra of V2492 Cyg.
References
Alcalá, J. M., Natta, A., Manara, C. F., et al. 2014,A&A, 561, A2
Alcalá, J. M., Manara, C. F., Natta, A., et al. 2017,A&A, 600, A20
Alves, J., Hartmann, L., Briceno, C., & Lada, C. J. 1997,AJ, 113, 1395
Antoniucci, S., Arkharov, A. A., Di Paola, A., et al. 2014,A&A, 565, L7
Armitage, P. J. 2016,ApJ, 833, L15
Aspin, C., Beck, T. L., & Reipurth, B. 2008,AJ, 135, 423
Aspin, C., Beck, T. L., Davis, C. J., et al. 2011,AJ, 141, 139
Audard, M., Ábrahám, P., Dunham, M. M., et al. 2014,Protostars and Planets VI
(Tucson: University of Arizona Press), 387 Bally, J., & Reipurth, B. 2003,AJ, 126, 893
Beristain, G., Edwards, S., & Kwan, J. 1998,ApJ, 499, 828
Cardelli, J. A., Clayton, G. C., & Mathis, J. S. 1989,ApJ, 345, 245
Covey, K. R., Hillenbrand, L. A., Miller, A. A., et al. 2011,AJ, 141, 40
D’Alessio, F., Di Cianno, A., Di Paola, A., et al. 2000,Proc. SPIE, 4008, 748
D’Angelo, C. R., & Spruit, H. C. 2010,MNRAS, 406, 1208
D’Angelo, C. R., & Spruit, H. C. 2012,MNRAS, 420, 416
Froebrich, D., Campbell-White, J., Zegmott, T., et al. 2017,ATel, 10259, 259
Giannini, T., Lorenzetti, D., Antoniucci, S., et al. 2016,ApJ, 819, L5
Giannini, T., Antoniucci, S., Lorenzetti, D., et al. 2017,ApJ, 839, 112
Grinin, V. P. 1988,Sov. Astron. Lett., 14, 27
Grinin, V. P., Arkharov, A. A., Barsunova, O. Y., Sergeev, S. G., & Tambovtseva, L. V. 2009,Astron. Lett., 35, 114
Gullbring, E., Hartmann, L., Briceño, C., & Calvet, N. 1998,ApJ, 492, 323
Hartmann, L., Herczeg, G., & Calvet, N. 2016,ARA&A, 54, 135
Henden, A. A., Levine, S. E., Terrell, D., Smith, T. C., & Welch, D. 2012,J. Am. Assoc. Variable Star Observers (JAAVSO), 40, 430
Henden, A., & Munari, U. 2014,Contrib. Astron. Obs. Skalnate Pleso, 43, 518
Herbig, G. H. 1989,Eur. Southern Obs. Conf. Workshop Proc., 33, 233
Herbig, G. H. 2008,AJ, 135, 637
Herbst, W., & Shevchenko, V. S. 1999,AJ, 118, 1043
Hillenbrand, L. A., Miller, A. A., Covey, K. R., et al. 2013,AJ, 145, 59
Kóspál, Á., Ábrahám, P., Goto, M., et al. 2011,ApJ, 736, 72
Kóspál, Á., Ábrahám, P., Acosta-Pulido, J. A., et al. 2013,A&A, 551, A62
Kóspál, Á., Ábrahám, P., Westhues, C., & Haas, M. 2017,A&A, 597, L10
Kun, M., Szegedi-Elek, E., Moór, A., et al. 2011,ApJ, 733, L8
Ibryamov, S., & Semkov, E. 2017,ATel, 10170, 170,
Itagaki, K., & Yamaoka, H. 2010, Central Bureau Electronic Telegrams, 2426, 1
Lorenzetti, D., Larionov, V. M., Giannini, T., et al. 2009,ApJ, 693, 1056
Lorenzetti, D., Antoniucci, S., Giannini, T., et al. 2012,ApJ, 749, 188
Manara, C. F., Beccari, G., Da Rio, N., et al. 2013,A&A, 558, A114
Meyer, M. R., Calvet, N., & Hillenbrand, L. A. 1997,AJ, 114, 288
Moody, M. S. L., & Stahler, S. W. 2017,A&A, 600, A133
Mosoni, L., Sipos, N., Ábrahám, P., et al. 2013,A&A, 552, A62
Munari, U. 2012,J. Am. Assoc. Variable Star Observers (JAAVSO), 40, 582
Munari, U., Traven, G., Dallaporta, S., et al. 2017,ATel, 10183, 183
Munari, U., Henden, A., Frigo, A., & Dallaporta, S. 2014a,J. Astron. Data, 20, 4
Munari, U., Henden, A., Frigo, A., et al. 2014b,AJ, 148, 81
Pogge, R. W., Atwood, B., Brewer, D. F., et al. 2010,Proc. SPIE, 7735, 77350A
Sicilia-Aguilar, A., Kóspál, Á., Setiawan, J., et al. 2012,A&A, 544, A93


![Fig. 6. Left panel: NIR two-color plot [J − H] vs. [H − K]. The red point represents the NIR colors at MJD = 57 662 (see text)](https://thumb-eu.123doks.com/thumbv2/123dokorg/8088069.124586/8.892.98.777.118.443/fig-left-panel-nir-color-point-represents-colors.webp)
