Alma Mater Studiorum
Alma Mater Studiorum –
– Università di Bologna
Università di Bologna
DOTTORATO DI RICERCA IN
ULTRASONOLOGIA UMANA
Ciclo XXIV
Settore Concorsuale di afferenza: 06/B1 Settore Scientifico disciplinare: MED/09
TITOLO TESI
Portal hypertension: a comparison between portal-‐venous
pressure measurement and ARFI measurement of liver and spleen
stiffness
Presentata da: Dr. Alberto Borghi
Coordinatore Dottorato
Relatore
Prof. Luigi Bolondi
Dr Fabio Piscaglia
Introduction
Liver cirrhosis is a debated problem in hepatology. Pathologists define it as the presence of a high transformation of liver tissue, where inflammatory disease of peri-‐portal space, new nodule of hepatic regenerative tissue and bridging fibrosis through portal spaces coexist. METAVIR or Ishak pathological scores, describe cirrhosis as the worst damage in chronic liver disease, which corresponds to the highest amount of fibrosis apposition. Cirrhosis is also characterised by clinical features, much of them related to portal hypertension and loss of liver function. Seldom clinical and histological cirrhosis are synchronous and the latter is not always followed by the development of complications1. A
status of compensated cirrhosis could last years before the comparison of complications. Nonetheless, people with well-‐compensated cirrhosis have longer life expectancies and a low mortality rate, compared to decompensating patients2. Main complications, such oesophageal
varices and ascites, are principally connected to portal hypertension. Bridging fibrosis around portal spaces, a growing presence of regenerative nodules and the progressive epithelia deposition in sinusoids increase pressure in portal venous system, leading to development of both ascites and porto-‐systemic shunts as oesophageal varices. Portal pressure increase could also carry to oesophageal bleeding, the worst and life-‐threatening emergency in cirrhosis. Nonetheless, portal hypertension generates a decrease of splanchnic circulation resistance and a redistribution of blood during a later phase, bringing hepatic-‐renal syndrome and chronic ascites, refractory to diuretic treatments. Thus, there is a pressing need to redefine cirrhosis, in a manner that better describes patients with chronic liver disease, pointing out favourable and unfavourable endpoints that correlates with distinct clinical outcome3. After
Baveno Consensus Conference in 2005, a classification has been purposed that stratifies population in four clinical classes of growing severity in order to plan an adequate clinical
management. The classification discerns between stage 1 and 2 of patients without ascites and varices, or patients with only varices, that have a similar life expectancies (1-‐3,4% of mortality risk per year) and risk of decompensation. The third stage comprises patients who developed both varices and ascites. The risk of bleeding is higher than stage 1 or 2, so patients should be strictly followed with endoscopy at least every year and treated with non-‐selective beta-‐blockers (mortality risk at 1 year 20%). Finally, stage 4 comprises patient with variceal bleeding, a life threatening adverse event with a mortality risk of 57% per year2, 4.
Portal pressure assessment has always been considered a useful tool in clinical management. Originally, it was accomplished by the direct puncture of the portal trunk or intrahepatic or intra-‐splenic portal branches, but was dangerous and full of adverse event. Almost 50 years ago, Wegde Hepatic Venous Pressure (WHVP) measurement showed a safer profile and substituted direct portal puncture5. Cannulating the jugular vein or brachial vein
and approaching the hepatic vein is possible to measure WHVP by blocking the catheter with a balloon. After that, Free Hepatic Venous Pressure (FHVP) could be sampled, leaving the catheter flowing free in hepatic vein flow. The difference between WHVP and FHVP, give the Hepatic Venous Pressure Gradient (HVPG) that is directly related to portal pressure. HVPG is today the gold standard in portal hypertension assessment and it could stratify cirrhotic patients according to risk of decompensation and death2. Indeed, a pressure gradient higher
than 5 mmHg identifies the presence of Portal Hypertension (PH) whereas a gradient above or equal to 10 mmHg is associated to a status of Clinical Significant Portal Hypertension (CSPH) 6. CSPH is related to a bad prognosis, also in patient without esophageal varices or
ascites, and is a sign of cirrhosis evolution. Once the presence of CSPH has been demonstrated, patients should undergo to a strict follow up with esophagel-‐gastro-‐endoscopy once a year. The 16 mmHg threshold defines a status of Severe Portal Hypertension correlating with severe risk of death7. Nonetheless, HVPG is the best independent marker of outcome during
variceal bleeding. Patients with a decrease of HVPG after beta-‐blocker therapy, have a better clinical outcome8, 9. Even useful, HVPG measurement is minimally invasive, creating
discomfort to the patient, and expensive, increasing the cost of medical care and the amount of medical providers. Nonetheless, these limits avoid the possibility to repeat HVPG and follow the development of portal hypertension in single patients. Thus, scientific strains are turned to the identification of non-‐invasive, cost-‐effective and easy-‐repeatable technique to predict the presence of severe portal hypertension10. Despite new technological development,
nothing has been found that suits perfectly, even if new device are now under evaluation. The characteristics of US evaluation make it useful in portal hypertension assessment. Guidelines suggest that every patient with cirrhosis should undergo at least one US scan every six months and US scan should be the first line assessment in suspect of portal hypertension11.
Doppler and B-‐Mode US signs showed a high specificity for CSPH and are slightly related to HVPG12 (Berzigotti J Gastroenterology 2011). Nonetheless, their concomitant presence has a
good positive prognostic value11. Spleen enlargement and dilatation of portal trunk or its
confluents are the main grey scale US signs of portal hypertension. Even more, the identification of porto-‐systemic collaterals strongly correlates with HVPG higher than 16 mmHg, identifying patients with a bad prognosis12. Ultrasound is also sensible in detecting
subclinical ascites especially in perihepatic spaces. Doppler is almost useful in the assessment of portal blood flow. Presence of hepatofugal portal flux and flux velocity below 24 cm/s in portal trunk are highly specific for the presence of CSPH13. Other parameters as the flattening
of hepatic vein flow and the increase of splenic and hepatic artery resistance indexes (RI) are still under debate. Contrarily, the decrease of resistance index in superior mesenteric artery14
and the increase of RI of renal cortex arteries15 are signs of the splancnic redirection of blood
and renal reaction, maybe bringing to the development of hepatic-‐renal syndrome. Unfortunately, the majority of scientific studies on this field are mainly case control studies or
case series of patients, producing only weak evidences. Control randomized trials are lacking11. Worth noting is also the choice of patients population, where the diagnosis of
clinical significant portal hypertension has been assessed by the meanwhile presence of varices, splenomegaly and platelets count less than 100000/mmc, instead of an HVPG measurement higher than 9 mmHg16. Moreover, US technique is also strongly operator-‐
dependant. Especially Doppler assessment suffers of a huge inter-‐observer and inter-‐ equipment variability17.
Recently new machines have been developed to assess tissue stiffness, basing on generation of shear wave and Ultrasound physic. First and foremost, Transient Elastography (Fibroscan) was purpose by Echosens to assess liver stiffness in patients with chronic hepatitis, riding the need to estimate liver fibrosis degree in a non-‐invasive way18. Fibroscan
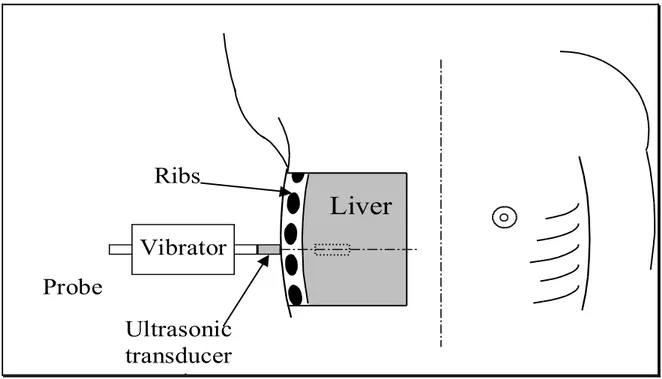
probe contains both a low frequency vibrator (50 Hz) and an ultrasonic 3,5-‐5 MHz transducer. The operator usually places the probe in the right intercostal spaces (Figure 1)18. The
vibrator generates a low-‐amplitude mechanic wave propagating to liver tissue. US transducer follow elastic wave and allows the measurement of its velocity inside a 4 x 1 cm ROI located at 2,5 cm under the skin surface. The transducer could also produce an M-‐Mode image (1 to 6 cm from skin surface) that help the operator to guide the measurement avoiding fibrotic and vascular structure inside the liver parenchyma. Final stiffness result is the median value of ten valid measurements; it is expressed in Kilopascal units (kPa) with a maximum allowed IQR of 30% and a Success Rate of 60%. Transient Elastography showed some good results in assessment of chronic liver disease. Although it could not substitute biopsy at all, the 13.0 kPa threshold has been demonstrated to identify patients with or without cirrhosis with an excellent accuracy and independently from the hepatic disease19. However, the technique
showed only weak results in diagnosis of clinical significant fibrosis with high variation of AUROC, according to liver disease aetiology19. Nonetheless, Fibroscan shows also other
advantages. It is easily repeatable, free from dangerous side effects and, differently from US, reasonably operator independent. Therefore, it could be performed frequently to monitor fibrosis progression20. Despite a good correlation with liver fibrosis, other liver pathological
feathers could influence liver stiffness. Thus, Fibroscan has also been purpose to assess the presence of portal hypertension and to predict the presence of CSPH. Firstly, Fibroscan demonstrates to be accurate in predicting risk of developing cirrhosis, clinical decompensation and graft lost in a subpopulation liver transplanted patients who underwent to HCV re-‐infection21. Seemly, in patients with chronic HCV infection, a correlation was found
between HVPG measurement and liver stiffness. Regrettably, the correlation was optimal for HVPG less than 10 mmHg or 12 mmHg, but for higher value of HVPG the correlation hardly reach a statistical significance22. The authors argued that the development of a portal
hypertension is only partially independent from the fibrotic transformation of the liver. After certain level of portal hypertension, some other factors, such as hyperdinamic circulation, collaterals development and splancnic vasodilatation contributes to the development of decompensation, but have no influence on liver stiffness22. Authors purpose 13,6 kPa as the
best cut-‐off to predict CSPH (AUROC 0,99; sensitivity 97% and specificity 92%) that is never been reproduced in subsequent scientific paper both in HCV population (20.5 kPa in Lemoine paper) 23 and in mixed population affected by heterogeneous liver diseases (21.1 kPa in
Bureau paper) 24. Lastly, LS was proven to be independently associated with Portal
Hypertension complications. No patients with chronic hepatitis run to decompensation when LS was less than 21.1 kPa both in cirrhotic subgroup and in patients without cirrhosis25.
Despite good premises, Fibroscan has some technical limitation. US Operator could not move the ROI deeper than 2,5 cm from skin surface. This avoids measurements in patients where liver is deeper as obese patients26 or in presence of ascites. Nonetheless, the transducer could
that are insonated. Failure or unreliable results occur in 10-‐20% of patients due to overweight, narrow intercostal spaces3, or high variability of measurements27. Moreover, the
technical feature of the standard probe avoids stiffness sampling in other organ than liver. New probe were born recently, permitting the measurements on spleen or in obese or child patients, but are expensive and suffer of the same technical drawbacks of the standard probe.
Figure 1. Fibroscan probe is correctly placed in the intercostal space. After generation of vibration, the US transducer collects the information about tissue dislocation from a 3D ROI that has a cylindrical shape (1 cm base diameter and 4 cm length) and is about 10000 times bigger than biopsy sample
Ultrasonic
transducer
axis
Vibrator
Probe
Ribs
Liver
More recently, new elastometric tools have been developed, which employ shear waves to assess liver stiffness. Embedded on common US machine, they can generate both an ultrasound image and stiffness measurement. Siemens has patented Virtual Touch Tissue Quantification Imaging (Siemens Medical Solution, Mountain View, CA, USA). Virtual Touch™ allows the operator to place a small ROI (0,6 cm width and 1 cm length) under B-‐mode guidance at a desired depth, up to 8 cm from skin surface. The US convex probe (2,5-‐4,5 MHz)
sends a high-‐energy ultrasound pulses at a fixed transmit frequency of 2,67 MHz. It produces a mechanical excitation along the wave propagation path, generating a double shear waves, called Acoustic Radiation Force Impulses (ARFI), that are opposite phased, parallel and laterally sided to the ROI. The US machine calculates the shear wave speed by measuring the time to peak displacement at each lateral location until the ROI depth. Displacement magnitude is connected to the local tissue stiffness and its velocity is connected to the viscoelastic proprieties of tissue28. Thus, stiffness is expressed in m/s (range 0,5-‐4,4 m/s with
a ± 20% accuracy). While number of measurements and success rate are clearly defined by Echosense for Transient Elastography, ARFI measurement has not been already standardized. Similarly to Fibroscan, Virtual Touch™ shows a good performance in prediction of fibrosis. Recently, a meta-‐analysis has summarized the data from eight different studies published between 2009 and 2011. It collects about 518 patients with chronic hepatitis, analysing the performance of Virtual Touch™ in assessing the degree of fibrosis. The diagnostic accuracy of ARFI quantified by AUROC was 87% in significant fibrosis (liver stiffness cut-‐off 1,34 m/s) growing up to 91% and 93% in severe fibrosis and cirrhosis (cut-‐off 1,55 m/s and 1,80 m/s)
29. Slightly but significant higher accuracy was found comparing Transient Elastography to
ARFI in predicting significant fibrosis and cirrhosis. The authors ascribe the worst performances of ARFI to the little accordance of sampling methods and sites between the papers of meta-‐analysis29. The diagnostic power to discern between fibrosis stages increases
according to the severity of fibrosis with both Virtual Touch™ and Fibroscan30. According to
Ebinuma and Friedrich-‐Rust the techniques showed higher diagnostic power when liver fibrosis is more severe29, 30. Although Virtual Touch™ is little less accurate than Fibroscan,
advantages are evident. The usefulness of the integration between B-‐mode imaging and stiffness measurement allows changing the sampling depth, avoiding the need of several probes. Nevertheless, also patients with ascites might be evaluated. Consequently, overall
failure rate has been reported to be 2,9%, impressively less than Fibroscan29. Even more, the
flexibility of ROI placement shows its usefulness also in a setting of inhomogeneous liver fibrosis deposition31. The combination of US imaging and stiffness measurement of Virtual
Touch™ allows also the assessment of other organ than liver. Spleen stiffness accurately identifies patients with cirrhosis (87,1% accuracy with 2,51 m/s spleen stiffness cut off) 32.
Contrarily, liver stiffness and spleen stiffness did not show a sure correlation with the presence of oesophageal varices at EGDS and could not predict the degree of varices in cirrhotic population32, 33.
Aims
The location of spleen, upstream to the portal system, makes it interesting to assess stiffness in portal hypertension. Albeit, no studies are now available on portal hypertension, where stiffness measured with Virtual Touch™ is matched to HVPG. Thus, aim of the study is to assess a potential relationship between spleen and/or liver stiffness, with Hepatic Venous Pressure Gradient, in order to find if ARFI values could be considered surrogate marker of portal hypertension.
Methods
During July and September 2011, all consecutive patients who underwent to HVPG measurement, were prospectively considered for the inclusion in the study protocol. All patients without hepatic chronic disease and with portal thrombosis, previous spleen resection, transaminases level up to 10 times the normal level or advanced/intermediate HCC were excluded. We admitted patients with early HCC inside Milan criteria.
ARFI was performed at least one week before HVPG. Sonographer (A.B.) was blinded to HVPG report. Before examination, clinical history and blood examination were obtained. Transaminases level, gamma-‐glutamiltranspeptidase, alkaline phosphatase, albumin, coagulation, total bilirubin levels and platelets count were collected. Available reports of oesophageal-‐gastric endoscopy performed within 2 months to HVPG assessment, were also collected.
The Etic Committee of S. Orsola -‐ Malpighi University Hospital of Bologna approved the study protocol. All patients gave their written informed consent before stiffness measurement and clinical data collection, in accordance with the principle of Declaration of Helsinki.
US imaging
The same operator (A.B.) performed both US scan and stiffness assessments on fasting patients. The examined patient lied in the dorsal decubitus position, with right and left arms bended behind the head. Before ARFI assessment, a B-‐mode standard ultrasonography scan was performed using a Siemens Acuson S2000 (Siemens Medical Solution, Mountain View, CA, USA) with a 4Cl transducer. The operator checked the presence of ascites, liver steatosis and portal venous shunts12. Portal trunk calibre34, 35 and spleen size (both section area and bipolar
diameter) were also measured36. Pulsatile Index (PI) and Resistance Index (RI) of intra-‐
splenic arteries (3 samples for each patient in upper, medium and lower spleen) 37, portal
ARFI measurement
After US scan, operator measured stiffness using the same probe of abdominal exploration (4Cl). Sonographer asked to the patient to hold on the breath during every stiffness sampling. Stiffness was measured choosing two areas in the right liver lobe, an area in the left lobe and two areas in the spleen, avoiding vessels or fibrotic structures that could affect the results. In the right lobe, stiffness was sampled in 5th or 6th segment through
intercostal spaces, both at 1 cm (Right Lobe Surface) and 5 cm (Right Lobe Centre) from liver surface. In the left lobe, stiffness was assessed between 2nd and 3rd segment portal branches
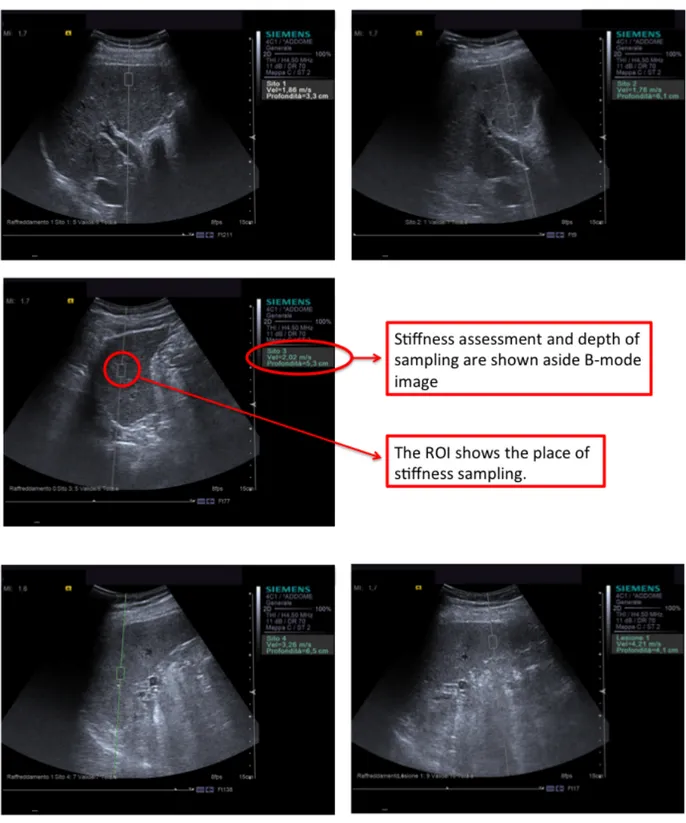
(Left Liver) placing the US probe on a longitudinal axis. Spleen stiffness was assessed both at superior (Superior Spleen) and inferior half spleen region (Inferior Spleen). Just by pointing ROI and clicking, US machine could measure stiffness expressing results in meters per second (m/s) as showed in Figure 2. Sonographer should perform at least 10 successful measures in every sample areas, with a 60% Success Rate (SR).
Figure 2. The five US images show the 5 areas where stiffness where assessed. The white panel on the right explains which is the ROI and where stiffness was recorded.
HVPG
WHVP, FHVP and HVPG measurements were performed in the Angiography Room (Radiologia Dr.ssa Rita Golfieri) according to standard protocol of S.Orsola-‐Malpighi Hospital. A 7 French catheter was placed in the basilica vein of the right forearm, using Seldinger technique. A 5 French balloon-‐tipped catheter (OB-‐Medi_Tech, Boston Scientific Cork Ltd., Cork, Ireland) was advanced into the right hepatic vein to measure WHVP and FHVP. Balloon catheter was inflating to obtain the wedge position. The injection of a small amount of medium confirmed the occlusion of hepatic vein. An external electromechanical transducer and polygraph connected to OB catheter (PowerLab, ADI Instruments, Milford, MA, USA) recorded FHVP for at least 20 seconds and WHVP for at least 40 seconds until the stability of measurements. The procedures were performed by experienced radiologists (C.M. and M.R.), and were supervised by a hepatologist (P.Z. or C.T.) for the recording and interpretation of pressure tracing. HVPG was calculated as the difference between WHVP and FHVP. Permanent tracing were recorded, according to the published guidelines40.
Statistic analysis
Median values, SR and IQR of all measurements in each patient were calculated.
1) Scatter-‐plot distribution of ARFI (median vs. interquartile range) was provided to compare the difference between quantiles and interquartiles both in liver and spleen. 2) Correlations between stiffness and HVPG were accomplished with Spearman bivariate
analysis until our data were not normally distributed. AUROC analysis was performed to assess the accuracy of ARFI in predicting a HVPG higher than 10,12 or 16 mmHg.
According to AUROC, optimal cut-‐off was chosen according to the maximal sum of sensitivity and specificity. Graphic box-‐plots were also provided to assess the power of ARFI values to discern group of patients with HVPG≥10, 12 and 16 mmHg and patients with or without varices.
3) Confounding factors analysis was performed using univariate and multivariate regression analysis to evaluate weather their presence or elevation could influence the outcome of Virtual Touch™.
Data were collected in Excel file (Mac version 2011; Microsoft Corporation, Redmond, Washington) and statistical analysis was performed by using the SPSS statistical package for Machintosh (SPSS 16.0, SPSS Inc. IBM, Chicago, IL, USA).
Results
Population
Forty-‐two consecutive patients were considered valid for the inclusion criteria. Two patients were excluded from the study after withdrawal of consent to catheterisation procedure. Thus, 40 patients finally underwent to HVPG measurement and were enrolled in the study. Patients characteristic are included in Table 1. Thirty patients were male (75%). Mean age was 62±9.9 years. Mean BMI value was 26±3.8 kg/h2. Most frequent aetiology was
HCV-‐related chronic hepatitis (16 patients). Six patients had HBV-‐related chronic hepatitis, 4 alcohol-‐related hepatitis and 7 cryptogenic hepatitis. Almost 7 patients had combining etiologic factors (2 HCV/Alcohol, 1 HCV/Hemochromatosis and 4 HBV/HDV). Five patients had ascites, not clinically evident, whereas 2 patients had mild-‐abundant ascites, clinically evident.
Table 1. Population characteristics are summarized in the table.
Liver Function and blood examination
Patients was both compensated or decompensated. Mean Child Pugh Score was A6 (range A5-‐B9); 11 patients have an unpaired liver function with a Child Pugh above A level. Five patients have little ascites, not detectable at physical examination, and 2 of them mild ascites. None of them showed Encephalopathy. Blood examination are expressed as mean±SD: total Bilirubin value was 1,41±1,28 mg/dl, Albumin 3,71±0,62 g/dl, INR 1,27±0,3, GOT 63±38 U/l, GPT 57±48 U/l, gamma-‐GT 86±80 U/l, ALP 241±193 U/l and Plt 105000±53.000/mmc.
Total patients (n) 40
Age (mean; years) 62 (range 40-‐80)
Gender 10 Female (25%) and 30 Male (75%) Chronic liver disease aetiology:
HCV HBV Alcohol Cryptogenic HCV/alcohol HCV/hemochromatosis HBV/HDV 16 6 4 7 2 1 4 BMI 26 (range 20-‐38) Diabetes 17
EGDS
33 patients underwent also to EGDS within one month from HVPG measurement. 18 patients have varices at endoscopy. F1 varices were found in 13 patients, F2 in 4 patients and F3 in only 1 patient. Two patients have also gastric varices and 20 patients suffer for congestive gastropathy.
US Imaging and ARFI Measurements
All ultrasound features of study population are summarized in Table 2. Steatosis was present at US scan in 6 patients. Spleen size ≥45 cm2 or diameter ≥ 12 cm36, portal trunk
diameter ≥ 12 mm34, 35, mean time average velocity portal flow ≤ 16 cm/s2 38, RI ≥ 0,66 and PI
≥ 137 were considered abnormal and suggestive of PH. Seemly, a bi/mono-‐phasic hepatic vein
flux39 and presence of portal-‐venous shunts were pathological findings11. Valid ARFI values
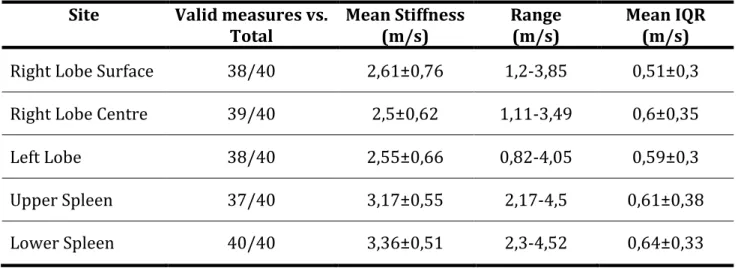
were obtained in 38 out of 40 patients on Right Lobe Surface (95% global success), because the presence of abundant ascites avoids ARFI sampling in 2 of them. ARFI was unsuccessful on Right Lobe Centre in 1 patient for a 44% SR, (97,5% global success on right lobe). Left lobe was not visible by ultrasound both during normal breathing and after deep inspiration in 1 patient and only 25% SR was achieved in Left Lobe of another patient (95% global success on left lobe). Three inadequate success rates resulted from Upper Spleen stiffness measurement (92,5% global success on upper spleen). All ARFI measurements (Table3) were valid on Lower Spleen (100% global success on lower spleen). Mean ARFI value was 2,61±0,76 m/s (range 1,2-‐3,85 m/s) on Right Lobe Surface, 2,5±0,62 m/s (1,11-‐3,49 m/s) on Right Lobe Centre, 2,55±0,66 m/s (0,82-‐4,05 m/s) on Left Lobe, 3,17±0,55 (2,17-‐4,5 m/s) on Upper Spleen and 3,36±0,51 m/s (2,3-‐4,52 m/s) on Lower Spleen.
Table 2. Main US imaging features. In 2 patients was impossible to calculate the main portal calliper and in 1 patients the hepatic vein flux for the presence of abdominal gas or for the deepest position of vascular structures. Two patients had a reversed flux in main portal trunk. Seemly a patient has a small and hide spleen under diaphragm, so, spleen size could not be assessed.
Table 3. Data on stiffness assessment are summarized as mean values and standard deviation.
Site Valid measures vs.
Total Mean Stiffness (m/s) Range (m/s) Mean IQR (m/s)
Right Lobe Surface 38/40 2,61±0,76 1,2-‐3,85 0,51±0,3
Right Lobe Centre 39/40 2,5±0,62 1,11-‐3,49 0,6±0,35
Left Lobe 38/40 2,55±0,66 0,82-‐4,05 0,59±0,3
Upper Spleen 37/40 3,17±0,55 2,17-‐4,5 0,61±0,38
Lower Spleen 40/40 3,36±0,51 2,3-‐4,52 0,64±0,33
B-‐Mode and Doppler PH features
Results (mean) Un-‐normal results (n pts.)
No result
Steatosis -‐ 6 (15%) -‐
Portal-‐Venous Shunt -‐ 5 (12,5%) -‐
Spleen size (cmq) 74(range 30-‐136) 31 (79,5%) 1 Main Portal Trunk
Calliper (mm)
14(range 9-‐21) 29 (76,3%) 2
Spleen Artery Resistance Index
0,66(range 0,51-‐0,93) 19 (47,5%) -‐ Spleen Artery Pulsatile
Index
1,24(range 0,83-‐1,72) 33 (82,5%) -‐ Portal Blood Flow
Velocity (cm/s)
21 (range 7-‐34); 26 (68,4%) 2 Hepatic vein phasic
flux
Data Analysis
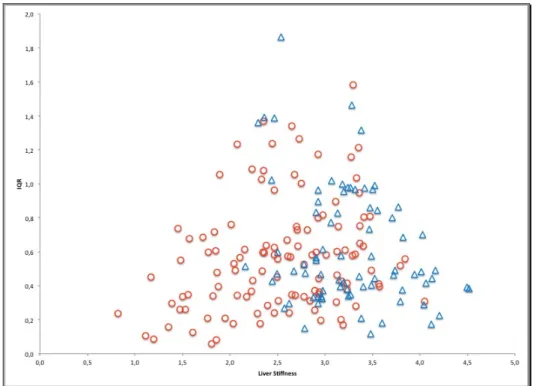
1) Scatterplot (Figure 3) shows the distribution of stiffness median values vs. interquartile range (IQR) of both spleen and liver. Spleen stiffness assessments were more concentrated in the lower right part of the graph. No relationship between spread of values and degree of spleen stiffness could be argued. Differently, when liver stiffness increase from about 1 m/s (IQR 0,4 m/s) to 3,5 m/s (IQR 1,6 m/s), also IQR increase, showing how variability of results rises according to the degree of fibrosis.
Figure 3. Scatterplot distribution of acoustic radiation force impulse (ARFI) values that compares median and IQR among spleen (blue triangles) and liver (red dots) samples.
2) Bivariate Spearman non-‐parametric analysis showed a positive correlation between stiffness values and HVPG but only spleen stiffness vs. HVPG correlation was statistically significant. Spearman r coefficient was 0,224 (p= 0,176) for Right Lobe Surface, 0,132 (p=0,423) for Right Lobe Centre, 0,293 (p=0,075) for Left Lobe, 0,532 (p=0,001) for Upper Spleen and 0,531 (p<0,001) for Lower Spleen. Trying to reproduce Rizzo experience31, which calculated the median value of 20 stiffness measurements on
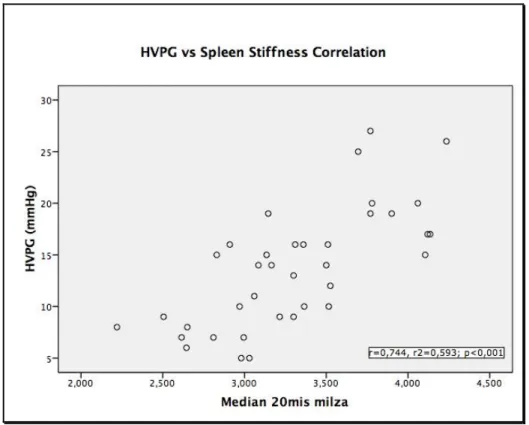
several areas of liver, we computed also the median value of all 20 measurements on spleen. Indeed, since Virtual Touch™ allows measuring stiffness quite everywhere, we thought that the median value of all measurements on upper and lower spleen could better mirror real spleen stiffness. 37 patients underwent to all 20 measurements; mean ± SD value of whole Spleen Stiffness were 3,30±0,5 m/s. Spearman non-‐parametric analysis showed a higher correlation with HVPG than Upper or Lower Spleen stiffness (r=0,744; p<0,001). Figure 4 displays scatter plot of correlation between HVPG and spleen stiffness.
Figure 4. Scatterplot shows the relationship between the variables Hepatic Venous Pressure Gradient (HVPG) and Spleen Stiffness, when it is calculated as the median values of all 20 measurements of both upper and lower side of spleen.
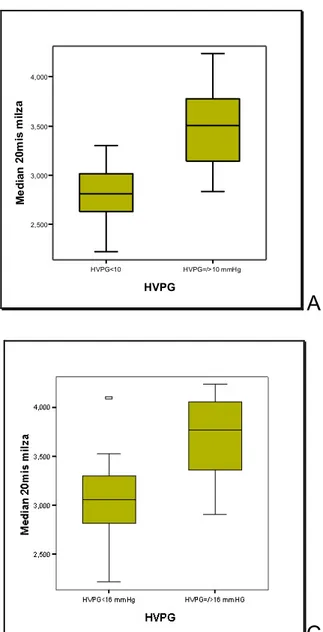
When we split population according to HVPG ≥ 10 (Clinical Significant Portal Hypertension), 12 (High Risk of Complication Development) or 16 mmHg (High Mortality Risk Connected to Portal Hypertension), patients appear distinctly distributed in separate group only according to the presence or absence of CSPH (Figure 5). Eleven patients with HVPG<10 mmHg had a 2,82 m/s mean spleen stiffness; mean spleen stiffness was 3,51 m/s in the remaining 26 patients with HVPG≥10 mmHg. Mean spleen stiffness was 2,92 m/s in 14 patients with HVPG <12 had and 3,54 m/s in the 23 patients with HVPG≥12 (High Risk of Complication Development). Twenty-‐three patients had a HVPG<16 mmHg and 3,07 m/s mean stiffness. Fourteen patients with HVPG≥16 mmHg (High Mortality Risk for portal hypertension) had 3,69 m/s mean stiffness.
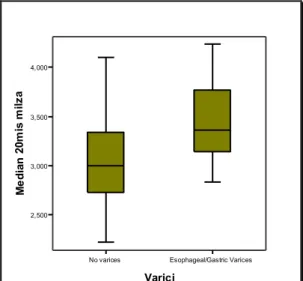
ROC analysis identified an ARFI value ≥ 3,26 m/s as the best cut-‐off to predict the presence of CSPH (AUROC 0,91, S.E. 0,05, CI 95% 0,82-‐1). A 3,34 m/s (AUROC 0,85, s.e. 0,06, CI 95% 0,73-‐0,97) is the best cut of to detect patients at high risk to develop complication connected to PH (HVPG≥12 mmHg). Finally, the best Spleen Stiffness cut-‐ off to predict a High Mortality Risk was 3,51 m/s (AUROC 0,86, s.e. 0,06, CI 95% 0,74-‐ 0,99). The concordance rate of ARFI cut-‐offs and angiographic diagnosis of portal hypertension was calculated. CSPH cut-‐off reached a concordance of 75,7% (k=0,505). Concordance between ARFI ≥ 3,34 m/s vs. HVPG≥12 mmHg was 70,3% (k=0,424), and between ARFI≥ 3,51 m/s vs. HVPG ≥ 16 mmHg concordance was 81,1% (k=0,592). A box plot analysis was also provided according to the presence of varices in the set of patients who underwent to oesophageal-‐gastric endoscopy (Figure 6). The graph shows that spleen stiffness could not satisfactory discern patients with or without varices, because an overlap of spleen stiffness values was found within the two groups of patients.
HVPG<10 HVPG=/>10 mmHg HVPG 2,500 3,000 3,500 4,000 Me d ia n 2 0m is m ilz a
A
HVPG<12 mmHg HVPG=/>12 mmHg HVPG 2,500 3,000 3,500 4,000 Me d ia n 2 0m is m ilz aB
C
Figure 5. The three box-‐plots showed the distribution of stiffness values according 10, 12 and 16 mmHg cut offs. Stiffness could discern groups of patients with HVPG higher or lower 10 mmHg (panel A), but when we try to split population according 12 mmHg a partial overlap appears (panel B). Seemly, an outlier (patient n° 30) appears in the set of patients with HVPG<16 mmHg, having 4,1 m/s of spleen stiffness and 15 mmHg of HVPG (panel C).
No varices Esophageal/Gastric Varices
Varici 2,500 3,000 3,500 4,000 Me d ia n 2 0m is m ilz a
3) The analysis of confounding factors was provided testing the effects on spleen stiffness. Discrete (Child-‐Pugh) and continuous (BMI, spleen dimension, GPT level) independent variables were correlated to spleen stiffness in linear regression univariate model showing no significant correlation between spleen stiffness and BMI (t=0,030, p=0,976) or GPT level (t=-‐0,882, p=0,384). A correlation was found at univariate and multivariate with Child-‐Pugh score (t=2,981, p= 0,005) and spleen size (t=4,01, p<0,001 respectively).
Figure 6. Box plot shows the distribution of spleen stiffness values according to the presence or absence of varices in patients that underwent to oesophageal-‐gastric endoscopy within a month from HVPG assessment.
Discussion
Actually, HVPG is the gold standard in portal pressure assessment, playing a key role in clarification of portal hypertension’s pathophysiology. It is almost helpful in figuring survival and complication risk, providing essential information in clinical management of patients with liver cirrhosis40. Guidelines strongly suggest measuring HVPG in patients with
oesophageal varices, where a therapeutic decision should be taken, or, after acute bleeding episode, to assess risk of recurrence4. Nonetheless, a bleeding risk close to zero has been
proven when HVPG drop under 12 mmHg level after non-‐selective beta-‐blockers intake41.
However, HVPG measurement is an invasive technique. It could be dangerous in cirrhotic patients with variable degrees of coagulopathy and is not readily available in all centres. Nonetheless, it seems cost effective only in patients at high risk of variceal bleeding or at least in patient with a 3-‐5 years life expectancies42, a feature that could weight on clinical decision
in a setting of low financial resources. Therefore, the technique is not suitable to screen all cirrhotic patients suspected for portal hypertension.
New promising tools appeared recently on scene. Basing on ultrasound technology, they are safe, manageable and cheap. They were originally purposed to measure liver stiffness, a surrogate marker of liver fibrosis. Transient Elastography (Fibroscan), an Echosens project, has been the first elastometric machine in commerce. Using ultrasound wave, Fibroscan measures the velocity of a short burst vibration, inside a 4x1 cm ROI at 2,5 cm depth from skin surface. Velocity of mechanical vibration is directly related to stiffness, a viscoelasticity proprieties of tissue18. Large casuistic validated in a meta-‐analysis study,
showed a high accuracy in predicting fibrosis F419. Technical features of Fibroscan hardly
liver stiffness measurement, and its employment in measuring other kind of tissue, i.e. spleen tissue, is practically tangled and still a matter of scientific debate43. Virtual Touch™ (Siemens
Medical Solution, Mountain View, CA, USA) has been recently purposed by Siemens. The elastometric system is embedded on a common US device. The B-‐mode image allows the operator to explore abdomen, choosing organ, areas and depth of stiffness measurement28.
Despite a little lower accuracy than Fibroscan in predicting significant fibrosis and cirrhosis, Virtual Touch™ is more handy and less subject to sampling failure29.
Appearance of elastometric tools opened new interesting fields of research and stiffness as been purpose as surrogate marker of portal hypertension. We employed Virtual Touch™ to measure liver and spleen stiffness in a cohort of 40 consecutive patients with cirrhosis, which were sent to Radiology Unit of Dr. Rita Golfieri for HVPG measurement. Since no standard quality of liver and spleen stiffness measurements has been validated for Virtual Touch™, we assessed stiffness (median of 10 valid measurements with a SR of 60%) in three areas of liver (Right Lobe Surface, Right Lobe Centre and Left Lobe) and in two areas of the spleen (Upper and Lower Spleen). Mean spleen stiffness value was 3,17±0,55 m/s in upper spleen and 3,36±0,51 m/s in lower spleen. Liver stiffness was lower (2,61±0,76 m/s in Right Lobe Surface, 2,5±0,62 m/s in Right Lobe Centre and 2,55±0,66 m/s in Left Lobe), in accordance to previous papers conducted with either Fibroscan43 or Virtual Touch™32. Global
success rate of the technique (Table 3) was 95,8% on liver (range 95-‐97,5%) and 96,3% on spleen (range 92,5-‐100%), paralleling previous results that reported a 97,1% SR on liver (in a recent meta-‐analysis)29 and a 95,1%-‐100% on spleen32, 44. In 2 patients with mild-‐abundant
ascites, no valid measurements were reached on Right Liver Surface, maybe because the presence of fluid magnified the movement of liver affecting the examination. In a patient with moderate steatosis and 29 BMI, an invalid SR (44%) was achieved on Right Lobe Centre. The presence of gas in epigastrium avoided stiffness measurements on Left Lobe in one patient
and only a 25% SR was achieved in another one, maybe due to intense cardiac movement. Three patients achieved a non-‐valid SR (44% in all three patients) on Upper Spleen. When spleen has normal dimension, the presence of diaphragm could hide its higher portion, making difficult to get a sufficient number of samples. Anyway, our data confirm a better performance of Virtual Touch™ in comparison to Transient Elastography, which was reported in literature to have a global success rate of 85,6% on spleen43 and 79% on liver, in a vast
casuistic on about 13000 patients over 5 years experience27.
Preliminary studies showed a liver stiffness correlation with portal hypertension at HVPG level lower than 10-‐12 mmHg22. Some cut-‐offs showed a good accuracy in CSPH
prediction, but they are not still validated 22-‐24. In our study, Spearman bivariate analysis
showed a non-‐significant correlation between HVPG and liver stiffness (Right Lobe Surface p=0,176, Right Lobe Centre p=0,224 and Left Lobe p=0,075). This is not surprising, since liver stiffness is the outcome of multiple factors as fibrosis deposition, inflammatory activity45, fat
cell deposition and blood flow congestion. Secondly, fibrosis deposition has been demonstrated to be extremely inhomogeneous46. Original studies, using Virtual Touch31 or
most panoramic technique like MRI47, showed how the variability of liver stiffness increase in
patients with chronic hepatitis than in healthy subject and even more in cirrhosis than in milder degree of fibrosis. Seemly in our data, IQR increases together to the elevation of liver stiffness (Figure 1), confirming an extreme variability of sampling in patients with a severe disease and probably affecting the correlation with portal pressure. The data confirms also the clinical evolution of portal hypertension that is usually asynchronous with cirrhosis occurrence and with complication development1. Otherwise, spleen stiffness distribution
seems much more limited to a single area in the scatter plot of Figure 1. Differently from liver, spleen is not affected by inflammatory reaction and fibrosis deposition during chronic hepatitis. Intrasplenic microvascular pressure modification and fluid extravasation answer
directly to a hemodynamic reaction and neuronal reflex to portal pressure elevation, leading to spleen congestion48. Consequently, during portal hypertension spleen stiffness should
increase only due to spleen congestion, as well as liver stiffness increase during congestive heart failure49. Indeed, a good correlation was found between spleen stiffness and HVPG
(Upper Spleen r=0,532, p=0,001 and Lower Spleen r=0,531, p<0,001) in our population. Moreover, when we computed the median value of the 20 stiffness samplings in both superior and inferior spleen, correlation increases to 0,744 (p<0,001) with a linear distribution of the results (Figure 4). The data confirm a previous Japanese report where portal pressure, measured directly in a small group of transplant recipients, correlates well with spleen stiffness, but not with liver stiffness50. In order to assess eventual confounders factors of
spleens stiffness, a regression analysis was also provided. BMI and GPT level was found to be unrelated to spleen stiffness. Differently from liver stiffness assessed with Fibroscan, BMI did not affect stiffness assessment27 as well as major changes in GPT level51. A positive linear
correlation was found out with Child-‐Pugh levels and spleen dimension. Since portal hypertension is related to reduction of liver function and to enlargement of spleen, we are convinced that this relationship could not affect spleen stiffness measurement but only confirms the previous data, corroborating the good performance of spleen stiffness in assessing portal hypertension.
Since portal pressure assessment helps physician to stratify population in classes of growing risk, we tested the ability of spleen stiffness to discern population at different stage of PH. In our population, patients with CSPH, namely HVPG≥10 mmHg, have higher spleen stiffness degrees (mean spleen stiffness 3,5±0,42 m/s) than patients without CSPH (mean spleen stiffness 2,82±0,32 m/s) as displayed in Figure 5 (panel A). AUROC analysis confirms the data, showing a good accuracy of spleen stiffness in predicting CSPH. The best cut off of spleen stiffness was 3,26 m/s (sens 69% and spec 91%). The discriminant capacity of spleen
stiffness will drop if we split population according to 16 mmHg and 12 mmHg HVPG threshold. A discrete area of overlap could be seen in between HVPG< 12 mmHg and HVPG ≥12 mmHg and an outlier with high stiffness value (patient n° 30) falls also in the group of patients with HVPG <16 mmHg. Thus, we thought that ARFI does not allow discrimination of patients at high risk of decompensating or death related to PH. According to previous data of our group33, we found a scarce ability of spleen stiffness to assess the presence of varices in a
setting of cirrhotic patients. The presence of CSPH describes a population at risk of varices and is not directly related to the presence of them, seemly the surrogate marker should assess the same risk and not predict the presence or absence of varices.
Despite good results, the study has some limitations and it should be considered a pilot study. Primarily, the population was small and inhomogeneous, with the presence of several aetiologies of liver disease and multiple degrees of liver dysfunction. This situation reflects a clinical aspect of our Hospital, where HVPG is rather than a routinely request to our Radiology Unit. Thus, further prospective study should verify our data, in wider cohort of patients with single chronic liver disease aetiology. We are also convinced that the best result might be achieved by monitoring both liver and spleen stiffness in cirrhotic patients in order to verify the progression of liver disease and portal hypertension, correlating them to the development of liver related complication and time to death.
In conclusion, there are evidences that measurements of spleen stiffness by ARFI is more reliable and accurate in predicting Clinical Significant Portal Hypertension than liver stiffness, and that should be taken into account as a non-‐invasive method for the evaluation of PH in patient with cirrhosis.