Typeset using LATEX twocolumn style in AASTeX62
The Soft-Excess in Mrk 509: Warm Corona or Relativistic Reflection?
Javier A. Garc´ıa,1, 2 Erin Kara,3 Dominic Walton,4 Tobias Beuchert,5 Thomas Dauser,2Efrain Gatuzz,6, 7Mislav Balokovic,8 James F. Steiner,9 Francesco Tombesi,10, 11, 12, 3 Riley M. T. Connors,1
Timothy R. Kallman,12 Fiona A. Harrison,1 Andrew Fabian,4J¨orn Wilms,2 Daniel Stern,13 Lauranne Lanz,14 Claudio Ricci,15, 16, 17 and David R. Ballantyne18
1Cahill Center for Astronomy and Astrophysics, California Institute of Technology, Pasadena, CA 91125, USA 2Dr. Karl Remeis-Observatory and Erlangen Centre for Astroparticle Physics, Sternwartstr. 7, 96049 Bamberg, Germany
3Department of Astronomy, University of Maryland, College Park, MD 20742, USA 4Institute of Astronomy, Madingley Road, Cambridge CB3 0HA, UK
5Anton Pannekoek Institute for Astronomy, Universiteit van Amsterdam, Science Park 904, 1098 XH, Amsterdam, The Netherlands 6ESO, Karl-Schwarzschild-Strasse 2, D-85748 Garching bei M¨unchen, Germany
7Excellence Cluster Universe, Boltzmannstr. 2, D-85748, Garching, Germany
8Harvard-Smithsonian Center for Astrophysics, 60 Garden Street, Cambridge, MA 02140, USA 9MIT Kavli Institute for Astrophysics and Space Research, MIT, 70 Vassar Street, Cambridge, MA 02139 10Dipartimento di Fisica, Universit`a di Roma “Tor Vergata”, via della Ricerca Scientifica 1, I-00133, Roma, Italy
11INAF Astronomical Observatory of Rome, Via Frascati 33, 00078 Monteporzio Catone, Italy 12NASA/Goddard Space Flight Center, Code 662, Greenbelt, MD 20771, USA
13Jet Propulsion Laboratory, California Institute of Technology, 4800 Oak Grove Drive, Mail Stop 169-221, Pasadena, CA 91109, USA 14Department of Physics and Astronomy, Dartmouth College, 6127 Wilder Laboratory, Hanover, NH 03755, USA
15N´ucleo de Astronom´ıa de la Facultad de Ingenier´ıa, Universidad Diego Portales, Av. Ej´ercito Libertador 441, Santiago, Chile 16Kavli Institute for Astronomy and Astrophysics, Peking University, Beijing 100871, China
17Chinese Academy of Sciences South America Center for Astronomy, Camino El Observatorio 1515, Las Condes, Santiago, Chile 18Center for Relativistic Astrophysics, School of Physics, Georgia Institute of Technology, 837 State Street, Atlanta, GA 30332-0430
Submitted to ApJ ABSTRACT
We present the analysis of the first NuSTAR observations (∼ 220 ks), simultaneous with the last Suzaku observations (∼ 50 ks), of the active galactic nucleus of the bright Seyfert 1 galaxy Mrk 509. The time-averaged spectrum in the 1 − 79 keV X-ray band is dominated by a power-law continuum (Γ ∼ 1.8 − 1.9), a strong soft excess around 1 keV, and signatures of X-ray reflection in the form of Fe K emission (∼ 6.4 keV), an Fe K absorption edge (∼ 7.1 keV), and a Compton hump due to electron scattering (∼ 20 − 30 keV). We show that these data can be described by two very different prescriptions for the soft excess: a warm (kT ∼ 0.5 − 1 keV) and optically thick (τ ∼ 10 − 20) Comptonizing corona, or a relativistically blurred ionized reflection spectrum from the inner regions of the accretion disk. While these two scenarios cannot be distinguished based on their fit statistics, we argue that the parameters required by the warm corona model are physically incompatible with the conditions of standard coronae. Detailed photoionization calculations show that even in the most favorable conditions, the warm corona should produce strong absorption in the observed spectrum. On the other hand, while the relativistic reflection model provides a satisfactory description of the data, it also requires extreme parameters, such as maximum black hole spin, a very low and compact hot corona, and a very high density for the inner accretion disk. Deeper observations of this source are thus necessary to confirm the presence of relativistic reflection, and to further understand the nature of its soft excess.
Corresponding author: Javier A. Garc´ıa
Keywords: galaxies: active, galaxies: nuclei – Mrk 509 – accretion: accretion disks – black hole physics
1. INTRODUCTION
Accretion onto supermassive black holes in active galactic nuclei (AGN) is one of the most efficient mech-anisms to convert gravitational energy into radiation, comprised mostly of very energetic photons. For this reason, X-ray spectroscopy is a resourceful technique to study supermassive black holes and their interaction with their surroundings. In the case of most Seyfert AGN, the X-ray continuum is typically dominated by a power-law that extends to high energies, which is thought to be produced either in a central hot corona (e.g., Shakura & Sunyaev 1973;Haardt 1993), or at the base of a jet (e.g.,Matt et al. 1992;Markoff et al. 2005), although the exact mechanism is still a matter of study. Thermal emission from the accretion disk peaks in the ultraviolet (UV) band, extending partially to the soft X-rays. A fraction of the coronal emission illuminates the accretion disk, producing a rich reflection spectrum of fluorescent lines and other spectral features. This reflection component can be ionized, as changes in the ionization state of the disk determine spectral features observed (e.g., Ross & Fabian 2005;Garc´ıa & Kallman 2010), and also blurred and distorted by relativistic ef-fects (e.g., Laor 1991; Crummy et al. 2006), if it orig-inates close enough to the supermassive black hole; or it can be cold and neutral, if produced farther from the black hole in either the broad-line region or the torus (e.g.,Matt et al. 1991;George & Fabian 1991).
In a large fraction of Seyfert AGN a soft excess compo-nent is also observed peaking near 1–2 keV. Its origin has been debated over the years. This soft excess was first believed to be the hard tail of UV blackbody emission from the accretion disk (Singh et al. 1985;Arnaud et al. 1985;Pounds et al. 1986;Magdziarz et al. 1998;Leighly 1999); however, this explanation was ruled out given that systems with very different accretion rates and/or masses would be characterized by the same blackbody temperature, which is not expected for an accretion disk (Gierli´nski & Done 2004;Porquet et al. 2004;Piconcelli et al. 2005; Miniutti et al. 2009). The current models invoked to explain the soft excess tend to favor either Comptonization of UV photons or blurred ionized re-flection. In the first case, the disk photons are Comp-tonized by a corona above the disk, which is optically thicker and cooler than the corona responsible for the primary X-ray emission (Czerny & Elvis 1987; Middle-ton et al. 2009;Jin et al. 2009;Done et al. 2012). In the second case, the emission lines produced in the disk are
relativistically blurred due to the proximity to the black hole (Fabian et al. 2002;Ross & Fabian 2005; Crummy et al. 2006;Garc´ıa & Kallman 2010;Walton et al. 2013). The Seyfert type 1 galaxy Mrk 509 was one of the first AGN to be studied in detail because it is luminous (LBol= 1.07 × 1045erg s−1;Woo & Urry 2002) and
rela-tively nearby (z = 0.0344;Fisher et al. 1995). The corre-sponding X-ray flux of Fx = (2–5) × 10−11erg cm−2s−1
(Kaastra et al. 2011) is powered by a 1.4 × 10⁸M black
hole (Peterson et al. 2004), which is accreting at 20–30% of the Eddington rate (Petrucci et al. 2013). Excess soft (. 2 keV) emission above the extrapolation of the hard X-ray continuum was first identified bySingh et al. (1985). AfterMorini et al.(1987) detected the Fe line, improved X-ray instruments and detectors led to a full discussion of reflection features byPounds et al.(1994). An intense campaign of multi-wavelength monitoring of Mrk 509 involving the X-ray observatories XMM-Newton and Suzaku has provided a detailed model for the observed set of soft-X-ray absorption features, caused by differentially ionized warm absorbing gas (Kaastra et al. 2011). Portions of this gas phase have been observed to be outflowing at different velocities (Smith et al. 2007), including a component classed as an ultra-high velocity outflow (Cappi et al. 2009). This campaign also resulted in the most complete study of the Fe K complex of Mrk 509 to date, revealing a neutral narrow component and an ionized broad com-ponent. The latter has been interpreted as relativistic reflection from the inner regions of the accretion disk (Walton et al. 2013). Despite the presence of a warm absorber, Mrk 509 can still be considered a “bare” AGN. The intrinsic absorption is low enough that it does not complicate determination of the reflection continuum (Walton et al. 2013).
Most of the previous analyses of Mrk 509 mentioned above have predominantly focused on understanding the physical details of the warm absorber, the soft excess and the high-velocity outflows. Our emphasis is upon the detection or not of relativistic reflection features, namely the Fe K complex and the Compton hump, which are likely to originate due to the reprocessing of hard X-rays in the inner-most regions of the accretion disk. To date, observations of the hard X-ray component in which these signatures are most evident are quite lim-ited, and the physical picture is accordingly subject to large and fundamental uncertainties (e.g.,Petrucci et al. 2013;Ponti et al. 2013;Kaastra et al. 2014).
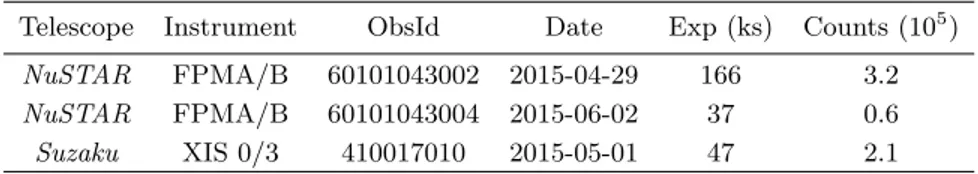
The Soft-Excess in Mrk 509: Warm Corona or Relativistic Reflection? Table 1. Observational Data Log for Mrk 509
Telescope Instrument ObsId Date Exp (ks) Counts (105)
NuSTAR FPMA/B 60101043002 2015-04-29 166 3.2
NuSTAR FPMA/B 60101043004 2015-06-02 37 0.6
Suzaku XIS 0/3 410017010 2015-05-01 47 2.1
The Nuclear Spectroscopic Telescope Array (NuSTAR, Harrison et al. 2013) low background, high sensitivity and ∼ 3–79 keV bandwidth (which captures the key reflection features), together with the development of advanced relativistic reflection models such as relxill (Dauser et al. 2013;Garc´ıa et al. 2013,2014), have revo-lutionized studies of X-ray reflection spectroscopy (e.g., Risaliti et al. 2013;Walton et al. 2014;Keck et al. 2014; Kara et al. 2017;Porquet et al. 2018). In this paper, we present analysis of the first NuSTAR and the last Suzaku observations of the bright AGN Mrk 509. Implementing a variety of X-ray spectral models, we investigate the origin of the soft excess and the possibility for relativis-tic ionized reflection in this source. Based on these fits, we present a theoretical discussion on the physical im-plications of two competing models to explain the soft excess: the warm corona and the relativistic reflection.
2. OBSERVATIONAL DATA
The first NuSTAR observations of Mrk 509 were taken during Cycle 1 of the Guest Observer Program on 2015-April-29, with a total requested exposure time of 200 ks. A simultaneous Suzaku observation was performed with a 50 ks exposure in order to provide low energy coverage. The NuSTAR exposure was interrupted after ∼165 ks due to a Target of Opportunity trigger. The remaining ∼35 ks were taken roughly a month later on 2015-June-02. A log with details of the observational data analyzed in this paper is shown in Table 1.
2.1. NuSTAR Extraction
The NuSTAR data are split over two ObsId, 60101043002 and 60101043004, separated by roughly a month. We reduced these data following standard procedures using the NuSTAR Data Analysis Software (NUSTARDAS, v1.6.0) and instrumental calibration files from caldb v20160824. We first cleaned the unfiltered event files withNUPIPELINE. We used the standard depth correc-tion, which significantly reduces the internal high-energy background, and also removed passages through the South Atlantic Anomaly, again using standard filtering parameters. Source and background spectra/lightcurves and instrumental responses were then produced for both focal plane modules FPMA and FPMB using
NUPRODUCTS. Source products were extracted from circular regions of radius 12000, and background was es-timated from regions of blank sky on the same detector as Mrk 509. In order to maximize the signal-to-noise (S/N), in addition to the standard ‘science’ (mode 1) data, we also extracted the ‘spacecraft science’ (mode 6) data followingWalton et al.(2016). In this case, the mode 6 data provide ∼10% of the total ∼220 ks good NuSTAR exposure.
2.2. Suzaku Extraction
The Suzaku data were reduced starting from the unfil-tered event files and then screened applying the standard selection criteria described in the Suzaku ABC guide1. The source spectra were extracted from circular regions of 2.50 radius centered on the source, whereas back-ground spectra were extracted from a region of the same size offset from the main target and avoiding the cali-bration sources. We generated the redistribution matrix file (RMF) and the ancillary response file (ARF) of the X-ray Imaging Spectrometer (XIS) with the xisrmfgen and xissimarfgen ftools, respectively. We selected the XIS data in both the 3×3 and 5×5 modes. The spectra were inspected for possible pile-up contamination and this possibility was excluded. The spectra of the front-illuminated XIS instruments (XIS 0 and XIS 3) were merged after checking that their fluxes were consistent. The data from the back-illuminated XIS instrument, XIS 1, is not used due to its much lower sensitivity in the Fe K band and cross-calibration uncertainties with the front-illuminated XIS 0 and XIS 3.
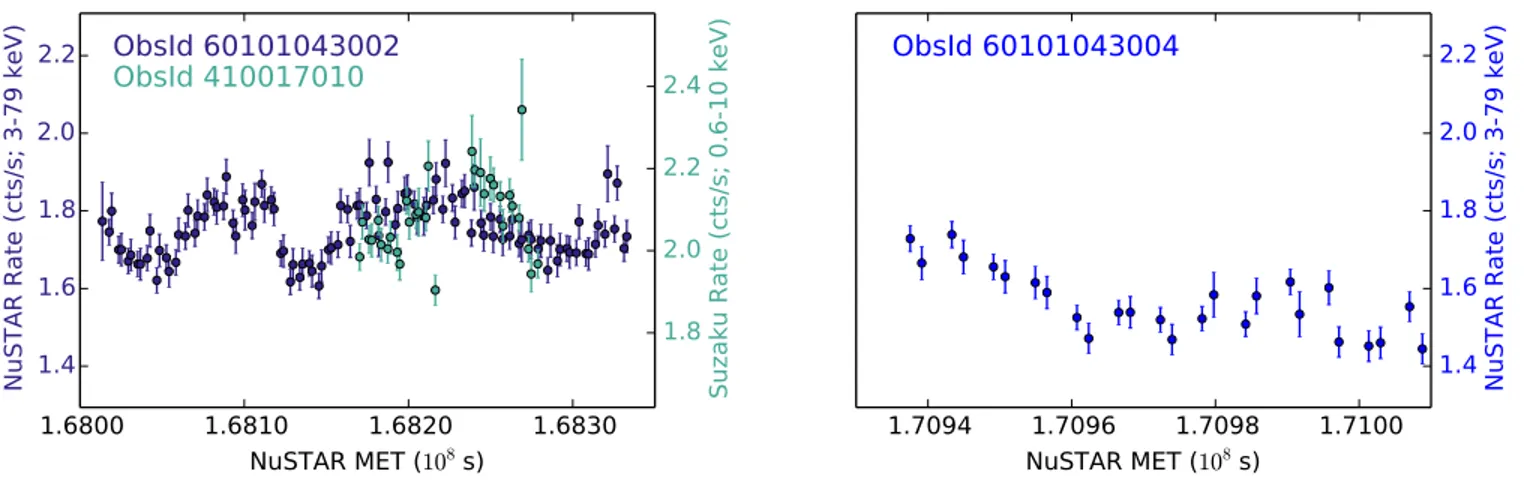
2.3. Light Curves and Time-Averaged Spectra The lightcurves for the two NuSTAR and the Suzaku exposures are shown in Figure1. The data were binned in 2 ks intervals. The Suzaku exposure is simultane-ous with the first and longer NuSTAR exposure. The lightcurves show a very similar level of variability, which in both cases is very weak (∼ 6%). This value cor-responds to the normalized excess variance (Vaughan et al. 2003) that suppresses a possible rms-flux
1.6800
1.6810
1.6820
1.6830
NuSTAR MET (
10
8s)
1.4
1.6
1.8
2.0
2.2
NuSTAR Rate (cts/s; 3-79 keV)
ObsId 60101043002
1.7094
1.7096
1.7098
1.7100
NuSTAR MET (
10
8s)
1.4
1.6
1.8
2.0
2.2
NuSTAR Rate (cts/s; 3-79 keV)
ObsId 60101043004
1.8
2.0
2.2
2.4
Suzaku Rate (cts/s; 0.6-10 keV)
ObsId 410017010
Figure 1. Light curves for the NuSTAR FPMA and Suzaku XIS exposures of Mrk 509 binned in 2 ks intervals. The left panel shows the first ∼165 ks NuSTAR exposure (ObsId 60101043002), together with the ∼50 ks Suzaku exposure (ObsId 410017010), while the right panel shows the shorter ∼65 ks NuSTAR observation (ObsId 60101043004). The source shows a very stable count rate through the full range, with no obvious flares or dips.
tion usually found for un-normalized rms measures. The right panel of Figure 1 contains the lightcurve for the shorter NuSTAR exposure taken roughly a month later. It shows a similar count rate with no significant variabil-ity; neither flares nor strong dips are detected. Spectra extracted from the two NuSTAR exposures imply con-sistency after visual inspection. We therefore combined these into a single spectrum taking advantage of the full ∼220 ks exposure.
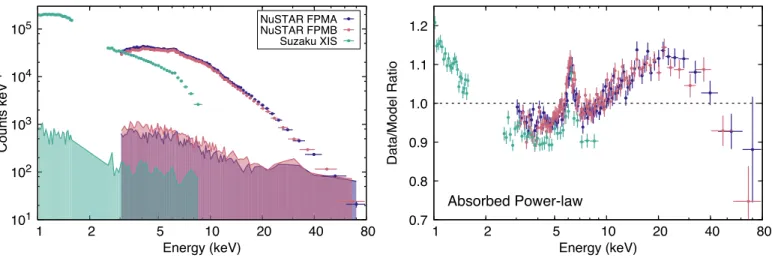
The final extracted total count spectra for NuSTAR’s FPMA and FPMB, and Suzaku’s XIS instruments are shown in Figure2. The shaded region depicts the corre-sponding backgrounds, which are well below the source counts up to ∼50 keV. We include Suzaku data in the 1–8 keV range, excluding the 1.7–2.5 keV range due to calibration uncertainties. We ignore data below 1 keV due to concerns over the quality of the calibration given molecular contamination of the XIS detectors; contami-nation reduces the effective area differently on each de-tector, and as a function of off-axis angle (Koyama et al. 2007;Kettula et al. 2013), and it is expected to worsen over time (Madsen et al. 2017). NuSTAR data is in-cluded in the 3–79 keV range. The spectra were rebinned in order to oversample the instrument’s resolution by a factor of 3, and to ensure a minimum signal-to-noise of 6 per bin.
3. SPECTRAL ANALYSIS
We simultaneously fit the two NuSTAR FPMA and FPMB spectra extracted from the full ∼220 ks exposure together with the ∼ 50 ks Suzaku spectrum. The fitting and statistical analysis presented here was carried out using the xspec package v-12.9.0d (Arnaud 1996). A cross normalization constant is included to account for differences in the flux calibration among all three
instru-ments (i.e., FPMA, FPMB, and XIS). The fitted values are consistent with those previously reported by Mad-sen et al.(2015). All model parameter uncertainties are quoted to 90% confidence level.
Figure2(right) shows the data-to-model ratio of these observations when fitted with a simple absorbed power-law model (i.e., TBabs*pow). The TBabs component is used to describe the Galactic absorption (see Sec-tion3.1). The typical signatures of X-ray reflection off optically thick material are evident in the spectrum: the fluorescent iron emission near 6.4 keV, the iron K-edge near 7 keV, and the Compton hump peaking at ∼25 keV. Both instruments satisfactorily agree in the shape and intensity of the iron emission. In absence of relativistic effects, these features are well described by the repro-cessing of the X-rays in a relatively cold and neutral material, located far away from the central region, pos-sibly at the broad line region (e.g.,Costantini et al. 2016; Nardini et al. 2016), or even at the torus (e.g., Yaqoob et al. 2007; Murphy & Yaqoob 2009; Marinucci et al. 2018).
The nature of the soft excess in Suzaku’s bandpass, however, is not yet very well established. As we shall show next, the particular choice of the components used to model the soft excess has an important effect in mod-eling of the reflected spectrum, and in fact leads to differ-ent interpretations for this system. We will then presdiffer-ent fits with two different scenarios, and later discuss the physical interpretation and implications for each one.
3.1. Approach 1: Fitting the Soft Excess with a Warm Corona
In their analysis of the XMM-Newton and INTE-GRAL campaign, Petrucci et al. (2013) proposed that the clearly observed soft excess in Mrk 509 is due to the
The Soft-Excess in Mrk 509: Warm Corona or Relativistic Reflection? ��� ��� ��� ��� ��� �� �� ��� ��� ��� �� ��� ������ ���� �� ������������ ����������� ����������� ���������� ��� ��� ��� ��� ��� ��� �� �� ��� ��� ��� �� ��� ������������������ ���������� ������ ������������
Figure 2. Left: Count spectra from the 50 ks Suzaku XIS (green) and the 220 ks NuSTAR FPMA/B (blue/red) exposures. The shaded regions show the level of background for each of the instruments. Right: Ratio of the data to an absorbed power-law model, showing the soft excess at ∼ 1 keV, the Fe K emission at ∼ 6.4 keV, and the Compton hump at ∼ 20 − 30 keV.
presence of a warm corona, which they reproduced using a Comptonization model. This corona can then be visu-alized as a warm (kTe∼ 0.5 − 1 keV) but optically thick
(τ ∼ 10 − 20) atmosphere sitting on top of the accre-tion disk. This extended, slab-like corona is much colder than the centrally located and possibly spherical corona responsible for the power-law continuum emission that extends to high energies. The emission of the hot corona was fitted with a second Comptonization model, with a higher coronal temperature (kTe ∼ 100 keV) and lower
optical depth (τ ∼ 0.5).
We adopted the prescription ofPetrucci et al. (2013) to fit the soft excess. For this, we implemented two Comptonization components using the nthComp model (Zdziarski et al. 1996; Zycki et al. 1999˙ ) with the re-quired parameters to reproduce the power-law contin-uum (hot corona) and the soft excess (warm corona). The hot corona component is characterized by a slope of Γ ∼ 1.84 and a relatively low electron temperature of kTe ∼ 30 keV. The temperature of the seed photons
for this component cannot be constrained and it is thus fixed to a relatively low value (kTBB = 100 eV). The
warm corona component is characterized by a very soft continuum fixed at Γ = 2.5 and a much colder electron temperature kTe∼ 0.4−0.5 keV, as well as a much lower
temperature for the seed photons, fixed at kTBB= 3 eV.
The parameters held fixed in these two components cannot be constrained with the current dataset, likely due to the lack of data below 1 keV. Their values were chosen following the best-fit results of Petrucci et al. (2013). The intrinsic galactic absorption in this sys-tem is modeled using the TBabs model with the cor-responding abundances as set by Wilms et al. (2000). This model automatically implements the Verner et al.
(1996) photoelectric cross sections. We freeze the col-umn density to NH= 4.25 × 1020cm−2 (Kalberla et al.
2005), and the source redshift to z = 0.035.
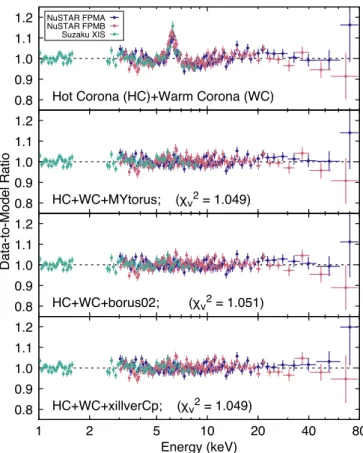
A data-to-model ratio plot of the fit using these mod-els for the continuum is shown in the top panel of Fig-ure 3. These two Comptonization components, which are independent from one another, provide a good fit to both the continuum and the soft excess, and the only obvious residuals are those from the Fe K fluorescence emission due to X-ray reflection.
The residuals that remain after fitting the continuum can be well fitted with a distant reflection model compo-nent, in which the gas is assumed either to be completely neutral or at a very low ionization stage, and no rela-tivistic effects are included. We have tested this idea by implementing three different (non-relativistic) reflection models, namely, MYtorus, borus02, and xillverCp, which we describe below. The residuals of these fits are shown in the last three panels of Figure3, and the best-fit values summarized in Table2.
Model 1.1: The MYtorus reflection model (Murphy & Yaqoob 2009) calculates the attenuation in the line-of-sight of X-rays produced by a central source, together with the scattered continuum, and the fluorescence emis-sion from neutral iron and nickel, assuming a toroidal ge-ometry. In this model, the X-ray source emits a power-law continuum with no cutoff at high energies. All el-emental abundances are at their Solar values. In our fit, all the parameters of the transmitted and scattered components are tied to each other. The photon index is linked to the one from the hot-corona component. The inclination is fixed to 60◦, as it has no appreciable effect on the fit. Thus, the column density and normalization are the only free parameters.
Model 1.2: The borus02 model (Balokovi´c et al. 2018), is similar to MYtorus in nature, but is more flexi-ble as it provides additional tunaflexi-ble spectral parameters such as the high-energy cutoff in the intrinsic continuum, the torus covering factor, and the relative abundance of iron. The approximately toroidal geometry assumed for the model employed here2is the same as in the popular model by Brightman & Nandra (2011), but the model is updated, expanded, and corrected for known issues as described inLiu & Li(2015) andBalokovi´c et al.(2018). Like MYtorus, borus02 allows us to model the average column density of the torus separately from the line-of-sight column density through the spectral shape of the reflection from material outside of our line of sight. As before, the inclination is degenerate in our fits, which al-lows us to fix it at 60◦. Again, the photon index is linked to the one describing the Comptonized emission of the hot corona. Furthermore, the covering fraction was fixed to 50%, and and the iron abundance is set to its Solar value. Finally, the simple relation Ecut∼ (2 − 3)kTe is
used to link the cutoff at high energies with the electron temperature of the hot corona (e.g.;Petrucci et al. 2001; Garc´ıa et al. 2015). While this is a crude approximation that depends on the combination of temperature, opti-cal depth, and geometry, we found that it is adequate for this model fit. First, the value of Ecut is unconstrained
when set free to vary in the borus02 model, while all the other model parameters remain unchanged. Fur-thermore, replacing the Comptonization continuum by a simple cutoff power-law model provides an identical fit with Ecut = 95 − 175 keV (90% confidence),
consis-tent with Ecut ∼ 3kTe. Thus, we use this relation to
link the cutoff in the reflection model with the temper-ature of the hot corona. As in the case of Model 1.1, the only free parameters are the column density and the normalization.
Model 1.3: We reproduced the observed residuals with our ionized reflection model xillverCp. This particular flavor of the model computes the reflected spectrum us-ing an illumination continuum produced by the Comp-tonization model nthComp. nthComp is a more physi-cally consistent treatment than the standard and com-monly used power-law continuum with an exponential cutoff. While xillverCp has a more accurate treatment of the reflection by self-consistently solving the ioniza-tion balance and radiative transfer, the geometrical con-siderations are much more simplistic than in MYtorus or borus02. In xillverCp a single zone, plane-parallel slab is assumed. Despite this approximation, this model also
2We used table model borus02 afe1p00 v161220.fits available atwww.astro.caltech.edu/∼mislavb/download. ��� ��� ��� ��� ��� �������������������������������� � ����������� ����������� ���������� ��� ��� ��� ��� ��� ������������������������������� � ��� ��� ��� ��� ��� ����������������������������������� ������������� ������ � ��� ��� ��� ��� ��� � � �� �� �� � �� ��������������������������������� ������������
Figure 3. Data-to-model ratios for the fits with the warm corona and different models for the distant reflection. provides a satisfactory fit to the data (Figure3, bottom panel). As before, the slope of the illumination is fixed to that in the hot-corona model. Moreover, we fixed the ionization parameter, defined as the ratio of the ionizing flux to the gas density (ξ = 4πFx/ne) to its minimum
value in the model order to mimic reflection off neutral gas (log ξ/erg cm s−1 = 0). We assumed Solar abun-dance of iron. In this case, the inclination has a small but noticeable effect in the fit, with the best-fit value pegged at its maximum (i = 89◦). Fixing the inclina-tion to a more reasonable value (e.g., i = 60◦) worsens the fit significantly (∆χ2∼ 60), due to strong residuals
at high energies and near the Fe K band. While this could be taken as the possible presence of a broad Fe line component, its statistical significance is low. More-over, given the simplicity of the xillverCp model in its geometrical considerations, we do not interpret the de-rived inclination as a meaningful estimate. In addition to the inclination, the normalization is the only other free parameter in this fit.
From a statistical point of view, these three models are indistinguishable. Only very small differences in the goodness of the fit are apparent in the bottom of Table 2. From these, the fit with the borus02 model
The Soft-Excess in Mrk 509: Warm Corona or Relativistic Reflection? ���� ���� ���� ���� ���� ��� ���������� ��� ���� ������ ��� ��������������� ���������� ����������� ����������������� �� � � ��� � �� ��� �� ������������ ����������� ���� ���� ���� ���� ���� ��� ���������� ��� ���� ������ ��� ������������� ���������� ���������������������� ����������������� �� � � ��� � �� ��� �� ������������ �����������
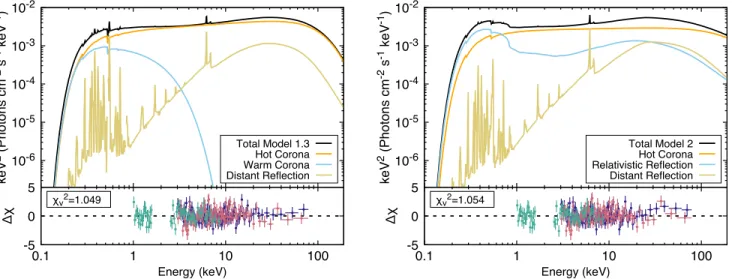
Figure 4. Model components (top panels) and residuals (bottom panels) for the best fits using the warm corona approach (Model 1.3, left) and the relativistic reflection approach (Model 2, right) to describe the soft excess observed in Mrk 509. (Model 1.2) is slightly worse, but with a marginal
in-crease in χ2 of ∼ 4 when compared to the other two.
From the ratio plots shown in Figure3, it appears that these three models perform equally well in describing the data. Despite some small differences, these three fits share the same relevant aspects. First, no inner-disk (relativistic) reflection is required in any of the fits, as no significant residuals remain in the Fe K region. Second, the electron temperature of the hot corona is relatively low (kTHC
e ∼ 30 keV), which suggests a low
energy cutoff in the continuum. Finally, the electron temperature of the warm corona is similar in all the fits at kTWC
e ∼ 0.4−0.5 keV, which is consistent with values
previously derived byPetrucci et al.(2013). 3.2. Approach 2: Fitting the Soft Excess With
Relativistic Reflection
Another approach that has been proposed in the past to explain the soft excess in AGN is relativistic reflection (e.g., Crummy et al. 2006; Fabian et al. 2009; Nardini et al. 2012;Walton et al. 2013). As the X-rays from the central source illuminate the inner regions of the accre-tion disk, the reflected or reprocessed radiaaccre-tion displays a spectrum rich in fluorescence lines and other atomic features. This spectrum is particularly populated with emission lines in the low energy range (. 1 keV), where most of the K-shell transitions from low-Z elements oc-cur. As the reprocessing is produced near the supermas-sive black hole, relativistic effects will blur and skew all the atomic features, effectively smoothing the entire re-flected spectrum. As a result, this component can in fact produce enough flux at low energies to explain the ob-served soft excess. Furthermore, we have recently shown that this effect is further enhanced if the density of the
reflecting material lies above the typically assumed value of ne = 1015cm−3, due to the extra heating produced
by the increased free-free emission (Garc´ıa et al. 2016). In order to test this approach, we replaced the warm-corona component with a relativistic-reflection compo-nent. For this, we implemented our model relxillD, which describes both the incident Comptonized con-tinuum and the reflection spectra calculated with our code xillver (Garc´ıa & Kallman 2010; Garc´ıa et al. 2013) in the case of a high-density gas (xillverD,Garc´ıa et al. 2016), taking into account all the relativistic ef-fects (Dauser et al. 2013;Garc´ıa et al. 2014). While the relxillD model has the advantage of providing the gas density as a free parameter, one limitation is that the illumination continuum assumed is a power-law spec-trum with an e-folded cutoff fixed at 300 keV (instead of the Comptonization continuum used in xillverCp). However, freeing up the cutoff energy will only intro-duce a significant effect in the fit if the curvature im-printed in the power-law continuum falls within the cov-ered bandpass and it can be detected given the instru-ment’s signal-to-noise.
In this fit, from here on Model 2, the distant (non-relativistic) reflection is still modeled with xillverCp, as in Model 1.3. For the relativistic reflection, we use the specific flavor of relxillD, namely relxilllpD, in which a lamppost geometry is assumed for the hot corona (Dauser et al. 2013,2016) that is self-consistently linked with the reflected continuum. The slopes of both the distant and inner-disk reflection components are tied to that in the hot corona, as well as the electron tem-perature in xillverCp. The inclination of the system is tied among the two reflection components. Unlike the previous fits with Models 1.1–1.3, in this case the
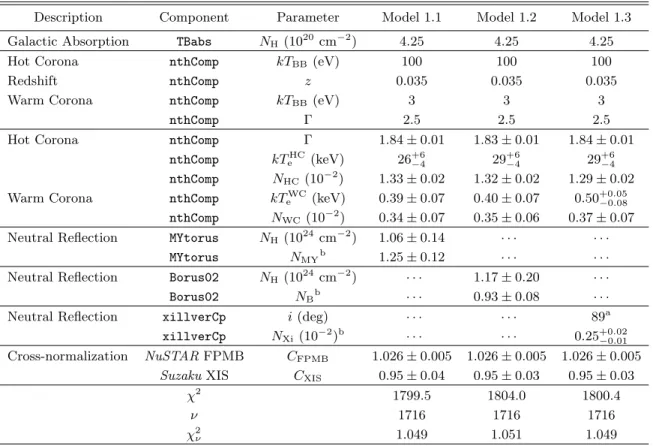
Table 2. Best-fit parameters and fit statistics for the three models featuring a warm corona prescription.
Description Component Parameter Model 1.1 Model 1.2 Model 1.3
Galactic Absorption TBabs NH(1020cm−2) 4.25 4.25 4.25
Hot Corona nthComp kTBB(eV) 100 100 100
Redshift nthComp z 0.035 0.035 0.035
Warm Corona nthComp kTBB(eV) 3 3 3
nthComp Γ 2.5 2.5 2.5
Hot Corona nthComp Γ 1.84 ± 0.01 1.83 ± 0.01 1.84 ± 0.01
nthComp kTeHC(keV) 26+6−4 29 +6 −4 29 +6 −4 nthComp NHC(10−2) 1.33 ± 0.02 1.32 ± 0.02 1.29 ± 0.02 Warm Corona nthComp kTeWC (keV) 0.39 ± 0.07 0.40 ± 0.07 0.50+0.05−0.08
nthComp NWC (10−2) 0.34 ± 0.07 0.35 ± 0.06 0.37 ± 0.07 Neutral Reflection MYtorus NH(1024cm−2) 1.06 ± 0.14 · · · ·
MYtorus NMYb 1.25 ± 0.12 · · · ·
Neutral Reflection Borus02 NH(1024cm−2) · · · 1.17 ± 0.20 · · ·
Borus02 NBb · · · 0.93 ± 0.08 · · ·
Neutral Reflection xillverCp i (deg) · · · 89a
xillverCp NXi (10−2)b · · · 0.25+0.02−0.01 Cross-normalization NuSTAR FPMB CFPMB 1.026 ± 0.005 1.026 ± 0.005 1.026 ± 0.005
Suzaku XIS CXIS 0.95 ± 0.04 0.95 ± 0.03 0.95 ± 0.03
χ2 1799.5 1804.0 1800.4
ν 1716 1716 1716
χ2ν 1.049 1.051 1.049
aParameter pegged at its maximum value. b Model normalizations in 1020
photons cm−2s−1.
Note—Model 1.1: TBabs*(nthComp+nthComp+MYtorus), Model 1.2: TBabs*(nthComp+nthComp+borus02), and Model 1.3: TBabs*(nthComp+nthComp+xillverCp). The parameters listed in the first block were assumed fixed at the same value in all the models.
electron temperature of the hot corona is loosely con-strained. Fixing kTe = 30 keV (similar to the value
found with the fits in Section 3.1), results in a signif-icantly worse fit (with χ2increasing by ∼ 40), and obvi-ous residuals in excess at high energies. This indicates that this particular fit prefers a cutoff a much larger en-ergies. Adopting once again the simple approximation Ee= 3kTe, we fixed the electron temperature of the hot
corona at 100 keV (i.e., one third of the cutoff energy of 300 keV in the relxilllpD component). The best-fit parameters are summarized in Table3.
In terms of fit statistics, the relativistic reflection pre-scription reproduces the data similarly well as the warm corona prescription from Models 1. The fit with Model 2 is marginally worse, with an increase of ∆χ2 ∼ 6 − 10,
despite using three more free parameters. It is, how-ever, unclear if any of these fits is preferred on statistical grounds. The model components and residuals of the fits with the two scenarios (Models 1.3 and 2) are compared
in Figure4. The two models are almost identical in the band covered by the data, with the largest differences occurring around 30 − 60 keV for Model 2. These resid-uals are possibly due to the fact that the reflection model used here was calculated using an e-folded power-law il-lumination spectrum with a high-energy cutoff fixed at 300 keV, rather than a proper Comptonization contin-uum. On the other hand, we also note that Model 2 allows for a softer continuum (Γ = 1.96) than Model 1.3 (Γ = 1.84), which can also affect the way the model fits the rollover at high energies.
Despite its statistical match, the relativistic reflection component (relxilllpD) requires extreme parameters, i.e., low coronal height (h =1.53+0.01−0.25RHor), and close
to maximum spin (a∗> 0.993), together with a large gas
density (log ne/cm−3> 18.2). This configuration results
in a soft and featureless spectrum, with a strong broad emission at low energies, which is required to fit the soft excess.
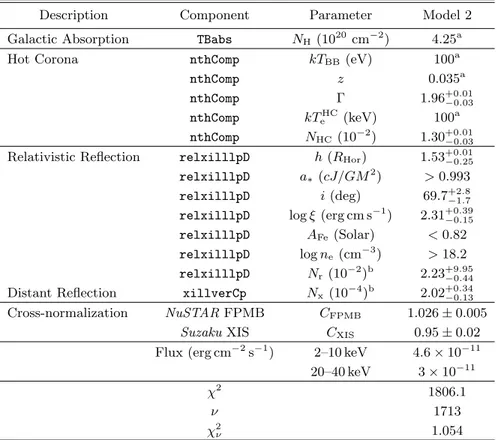
The Soft-Excess in Mrk 509: Warm Corona or Relativistic Reflection? Table 3. Best-fit parameters and fit statistic for the model featuring relativistic reflection.
Description Component Parameter Model 2
Galactic Absorption TBabs NH(1020 cm−2) 4.25a
Hot Corona nthComp kTBB(eV) 100a
nthComp z 0.035a
nthComp Γ 1.96+0.01−0.03
nthComp kTHC
e (keV) 100a
nthComp NHC(10−2) 1.30+0.01−0.03 Relativistic Reflection relxilllpD h (RHor) 1.53+0.01−0.25 relxilllpD a∗(cJ/GM2) > 0.993 relxilllpD i (deg) 69.7+2.8−1.7 relxilllpD log ξ (erg cm s−1) 2.31+0.39−0.15 relxilllpD AFe(Solar) < 0.82 relxilllpD log ne (cm−3) > 18.2 relxilllpD Nr (10−2)b 2.23+9.95−0.44 Distant Reflection xillverCp Nx(10−4)b 2.02+0.34−0.13 Cross-normalization NuSTAR FPMB CFPMB 1.026 ± 0.005
Suzaku XIS CXIS 0.95 ± 0.02
Flux (erg cm−2s−1) 2–10 keV 4.6 × 10⁻¹¹ 20–40 keV 3 × 10⁻¹¹
χ2 1806.1
ν 1713
χ2
ν 1.054
aParameter fixed to the quoted value. b Model normalizations in 1020photons cm−2
s−1.
Note—Model 2: TBabs*(nthComp+relxillD+xillverCp).
4. DISCUSSION
In the previous section we presented several model fits to the observational data of Mrk 509. These models are based on two different scenarios to explain the origin of the soft excess in the spectrum: the warm corona and the relativistic reflection picture. In either case, strong signatures of reflection are observed (i.e., Fe K emission and K edge, plus a Compton hump). This signal is consistent with low-ionization reflection from a structure located at a farther distance such that no relativistic effects are observed. Models for Compton-thick AGN (MYtorus and borus02; Models 1.1 and 1.2), and nearly-neutral reflection from a single plane-parallel slab (xillverCp; Model 1.3) all provide equally good fits to the data. This implies that the geometrical consid-erations for the distribution of gas in the line-of-sight are relatively unimportant. Moreover, we notice that no other components are required to fit the Fe K emis-sion, while Ponti et al. (2013) reported both a narrow
(σ = 0.027 keV), plus a resolved (σ = 0.22 keV) Gaus-sian feature for the Fe K line in their analysis of previous Chandra grating data. However, these two components were unresolved in their XMM-Newton and Suzaku data, and likewise are expected to be unresolved in our XMM-Newton and NuSTAR data. This is possibly the reason why Models 1.1–1.3 are able to reproduce the spectral features without any additional components. Weak ion-ized emission features were also reported byPonti et al. (2013), which could be attributed to Fe xxv-xxvi. We do not find evidence for these additional components, possibly due to the lower signal-to-noise of our data.
For the sake of comparison, we will now focus on the fits performed with Models 1.3 (warm corona) and Model 2 (relativistic reflection at high densities), and discuss the physical implications of each scenario.
4.1. Implications of the Warm Corona Model In the warm corona model, the soft emission observed in excess of the hard power-law continuum originates in
Comptonization of thermal disk photons into a warm (T ∼ 0.5 − 1 keV or ∼ 0.6 − 1.2 × 10⁷K) and
opti-cally thick (τT∼ 10 − 20) corona (Walter & Fink 1993;
Magdziarz et al. 1998; Done et al. 2012). This warm corona has been described as a slab sitting on top of a passive accretion disk covering roughly 10–20 Rg of
the inner region (e.g., Petrucci et al. 2013). One argu-ment that favors this scenario is the observed correla-tion between the optical-UV and the soft X-ray emis-sion (Mehdipour et al. 2011). As shown in our fits to Models 1.1-1.3, the warm corona model provides a sat-isfactory description of the data in combination with a distant reflection component, without the requirement of relativistic reflection.
In this case, the temperature of the hot corona (the one responsible for the hard power-law continuum) is found to be relatively low (kTe ∼ 25 − 35 keV
or ∼ 3 − 4 × 10⁸K). While low coronal
tempera-tures were not common in earlier studies of AGN (e.g., Marinucci et al. 2016), several recent NuSTAR measurements have reported relatively cold coronae, namely ∼ 50 keV (IC 4329A, Brenneman et al. 2014), ∼ 25 keV (MCG−05-23-016, Balokovi´c et al. 2015), ∼ 40 keV (NGC 5548, Ursini et al. 2015), ∼ 12 keV (GRS 1734−292, Tortosa et al. 2017), ∼ 35 keV (IRAS 05189−2524, Xu et al. 2017), and ∼ 15 keV (Ark 564, Kara et al. 2017). Moreover, Ricci et al. (2017) have also reported a handful of sources with low cutoff energies fitting e-folded power-law models to sources from the Swift/BAT sample, and found that those sources appear to be the ones with the highest Ed-dington ratios. Meanwhile, Tortosa et al. (2018) have reported more reliable coronal temperatures for a sam-ple of AGN by imsam-plementing thermal Comptonization models, in which most of the sources are found to have coronal temperatures below ∼ 60 keV.
While the warm-corona model has been successfully used in several other sources (see Petrucci et al. 2018, and references therein), its physical origin and implica-tions have yet to be fully explained. Czerny et al.(2003) argued that a warm Comptonizing skin on top the ac-cretion disk under radiation pressure instabilities could explain the observed X-ray spectra from quasars and narrow line Seyfert AGN.R´o˙za´nska et al.(2015) inves-tigated the properties of such a corona by solving the radiative transfer for a grey atmosphere. More recently, Petrucci et al.(2018) presented a theoretical discussion to explain the warm corona based on simple photon con-servation arguments, concluding that most of the energy dissipation takes place in the warm corona rather than in the accretion disk. Meanwhile,Kaufman et al.(2018) proposed that bulk Comptonization from turbulence due
to magneto-rotational instabilities can explain the warm corona. These authors argue, however, that this pic-ture is only applicable to systems with high accretion rate, possibly of the order or larger than the Eddington limit. Crucially, all these theoretical studies share the same fundamental limitation: they neglect the effects of atomic photoelectric absorption, which is likely to be a dominant process in optically-thick atmospheres.
It is interesting to describe the basic properties of the warm corona based on the average quantities obtained from fits to observational data (e.g., τT∼ 10 and kTe∼
0.5 keV,Petrucci et al. 2018). The vertical extension of this corona can be estimated as
z = τT/(σTne), (1)
where σT = 6.65 × 10⁻²⁵cm2 is the Thomson cross
section and ne is the electron density. Therefore z ∼
1.5 × 1024τ
Tn−1e cm, or in units of the gravitational
ra-dius Rg= GM/c2≈ 1.5 × 10¹³(M8/M ) cm,
z/Rg∼ 1011(M8/M )(τT/ne), (2)
where G is the gravitational constant, c is the speed of light, and M8 = 108M . In the case of Mrk 509,
M8/M ∼ 1 (Peterson et al. 2004), and thus the density
must be of the order of ne∼ 1012cm−3or higher for the
warm corona to have a reasonable (z ∼ Rg) geometrical
thickness. Moreover, for sources with M ∼ 105−106M ,
this estimate implies densities for the warm corona of the order of the typical values used for the accretion disk atmosphere in X-ray reflection calculations (e.g., ne∼ 1015cm−3;Ross & Fabian 2005;Garc´ıa & Kallman
2010).
One requirement for the warm corona scenario is to ensure that electron scattering is the dominant source of opacity. However, Krolik & Kallman (1984) showed that for an optically-thin gas under coronal ionization equilibrium (CIE), the photoelectric opacity dominates the soft band for T ∼ 106K, and even at T ∼ 107K it
is comparable to the Thomson opacity at ∼ 1 keV (see their Fig. 1). We have tested this argument by comput-ing simulations for an optically-thick plasma under CIE using the latest version of the xstar code (Kallman & Bautista 2001), with the appropriate parameters that describe a warm corona: ne = 1012cm−3, τT = 6.65
(corresponding to the maximum column allowed by the model, NH= 1025cm−2), Lx= 1046erg s−1 (which is in
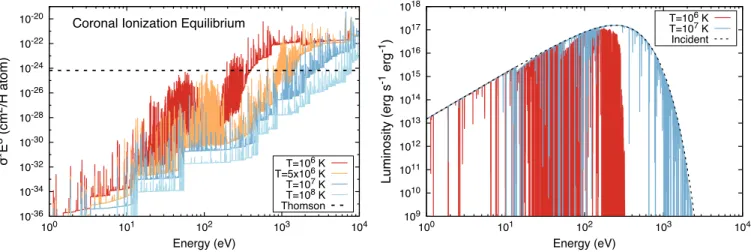
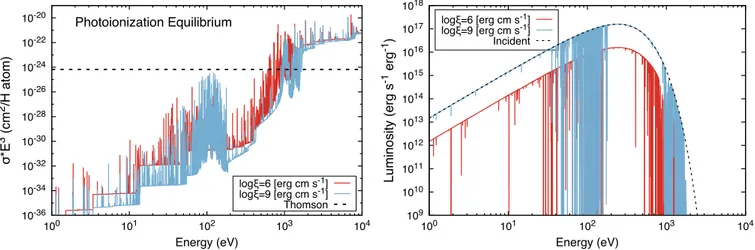
fact larger than the value typically measured for this source), and cosmic abundances. The incident spec-trum is assumed to be a blackbody at the given gas temperature. Figure 5 (left) shows the resulting pho-toelectric opacity as function of energy for different gas
The Soft-Excess in Mrk 509: Warm Corona or Relativistic Reflection? ����� ����� ����� ����� ����� ����� ����� ����� ����� ��� ��� ��� ��� ��� ������������������������������ ��� ����� ��� ������ ����������� ������� ��������� ������� ������� ������� ��� ���� ���� ���� ���� ���� ���� ���� ���� ���� ��� ��� ��� ��� ��� ���������� ����� �� ������ ��� ����������� ������� ������� ��������
Figure 5. Calculations for a gas under coronal ionization equilibrium for different temperatures (as indicated), and the parameters that describe a warm corona: ne = 1012cm−3, τT = 6.65, and L = 1046erg s−1. The left panel shows the photoelectric opacity as a function of energy, compared to the Thomson electron opacity. The right panel shows the resulting transmitted spectra. For clarity, only two cases are displayed, those for the lowest and highest temperatures derived from fitting the warm corona model to observational data. The incident blackbody spectrum for the T = 107K is also shown.
temperatures, in comparison with the Thomson opac-ity for electron scattering σT. This demonstrates that
even in the optically-thick case, photoelectric opacity dominates over a wide range of energies, particularly around or above 1 keV, for the range of temperatures required by the warm corona, i.e., kT ∼ 0.1 − 1 keV (T ∼ 106− 107K). The right panel in Figure 5 shows
the transmitted spectra for these two CEI calculations. At T = 106K the original disk blackbody emission is heavily absorbed and modified, with strong photo-absorption at almost all energies and with no emission above ∼ 300 eV. The situation is better at T = 107K,
although strong absorption is still present, particularly around 0.1 keV and 1 keV. We found in general that for electron scattering to be a dominant source of opacity, temperatures well above 107K are required.
Another possibility is to instead invoke a gas un-der photoionization equilibrium, since a radiation field strong enough can be responsible for stripping most of the ions and thus considerably reducing the total photo-electric opacity. This is in fact relevant since one expects the ionization of the warm corona to be fairly large, from simple arguments. We start by using the standard defi-nition of the ionization parameter ξ = L/(neR2), where
L is the luminosity and R is the distance from a generic source of radiation (e.g., the hot corona) to the warm corona. For a thin disk, z/R =constant∼ 0.1, and using Equation1 ξ = 10−1σTL τTR (3) or ξ [erg cm s−1] ∼ 107(L/LEdd)(R/Rg)−1, (4)
where LEdd = 1.26 × 1046(M8/M ) erg s−1 is the
Ed-dington luminosity. So for L/LEdd= 0.1 and R = 10Rg,
ξ ∼ 105erg cm s−1. A different estimate can be made if the ionization is assumed to be due to the thermal emis-sion from the accretion disk. Using the definition of the ionization parameter ξ = 4πF/ne, and the local flux
from the disk
Fd = 3π 8 GM ˙M R3 (5) and ˙M = L/(ηc2), we find ξ = 0.15π 2σ TG τTηc2 M L R2 , (6)
where η ≈ 0.1 is the accretion efficiency. This last equa-tion can be rewritten as
ξ [erg cm s−1] ∼ 109(L/LEdd)(R/Rg)−2, (7)
and thus for L/LEdd = 0.1 at R = 10Rg we get ξ ∼
106erg cm s−1. While this expression results in a larger ionization than the estimate in Equation4, it decreases quadratically (rather than linearly) with radius. It is also interesting that both expressions are independent of the black hole mass.
Although Equations 4 and 7 predict fairly large ion-ization for the warm corona, this is only true for the case of an optically-thin slab. For large optical depths (τT ' 1), the ionization will quickly decrease in the
deeper regions of the gas, and photoelectric absorption can be as important or more than the Thomson opac-ity. These results are generally in line with the seminal calculations presented byRoss et al.(1978), where they considered the photoionization of isothermal spheres at T = 106− 107K, with τ
����� ����� ����� ����� ����� ����� ����� ����� ����� ��� ��� ��� ��� ��� ��������������������������� ��� ����� ��� ������ ����������� ������������������� ������������������� ������� ��� ���� ���� ���� ���� ���� ���� ���� ���� ���� ��� ��� ��� ��� ��� ���������� ����� �� ������ ��� ����������� ������������������� ������������������� ��������
Figure 6. Calculations similar to those in Figure5, but for the case of a gas under photoionization equilibrium, at two different ionizations: ξ = 106and 109erg cm s−1. As before, left panel shows the photoelectric opacity as a function of energy together with the Thomson opacity, while the right panel shows the resulting transmitted spectra. Even at the highest ionization predicted by our estimates of the warm corona, the original blackbody spectrum (dashed line) is severely modified by photoelectric absorption. They found that despite the very high ionization at
the center of the cloud, in the outer parts ions such as Fe xxii were still dominant, producing distinct spectral features.
As before, we use the xstar code to test this scenario by producing the solution for a plasma under photoion-ization equilibrium (PIE) using the estimates shown above; i.e., ξ ∼ 106erg cm s−1, n
e = 1012cm−3, and
NH = 1025cm2. Using a blackbody with kT = 0.1 keV
as the input spectrum, the resulting gas temperature is T ∼ 106K. Despite the large ionization, the
photo-electric opacity near 1 keV is still dominant (or at least comparable) to the Thompson opacity (left panel in Fig-ure6). We repeated this calculation by raising the ion-ization to the largest value predicted by Equation7(i.e., ξ ∼ 109erg cm s−1), but the net effect is small in
reduc-ing the photoelectric opacity. Just as in the case of CIE, the transmitted spectra show strong absorption features in the observable bandpass (right panel in Figure6). De-spite the large ionizing flux, the input spectrum is too soft to fully ionize the metals in the gas.
None of the spectra resulting from either the CIE or PIE simulations are likely to resemble the apparently featureless broad component required to fit the soft ex-cess. In the case of PIE, a harder spectrum extending to high energies is likely to provide enough photons to fully ionize the medium, such as that provided by the hot corona. However, strong photoionization will raise the temperature and can only fully ionize the atmosphere if the optical depth is much smaller than that inferred from fitting the warm corona model. Moreover, strong illumination of an optically-thick medium is expected to produce strong reprocessing of the photons, which is a situation that closely resembles the relativistic reflection
model. This alternative scenario is discussed in the next Section.
4.2. Implications of the Relativistic Reflection Model The relativistic reflection model has also been pro-posed as a possible explanation for the soft excess in AGN. When strong radiation is produced in the central region close the black hole, the reprocessing of the hard X-rays in the optically thick and relatively cold accre-tion disk is an expected consequence. If the reflecaccre-tion occurs close enough to the horizon, the relativistic ef-fects will distort the spectrum, broadening and skewing all the spectral features. Below ∼ 1 keV, a rich forest of fluorescence emission lines produced by ions with nu-clear charge lower than iron is predicted (e.g., Ross & Fabian 2005;Garc´ıa & Kallman 2010). When the grav-itational blurring is extreme, these features will blend creating a single broad and smooth excess at soft en-ergies. When facing the difficulties in making physical sense out of a featureless and broad spectrum emitted from a warm corona, a relativistically blurred reflection spectrum provides an alternative and somewhat more consistent interpretation. However, some caveats must also be considered when adopting this model. Below we discuss this scenario to explain the soft excess in Mrk 509.
In their analysis of a sample of 25 “bare” AGN with Suzaku, Walton et al. (2013) fitted ∼ 90 ks XIS/PIN spectra of Mrk 509 using a model consisting of ion-ized and relativistic plus neutral and distant reflec-tion components. Both components were modeled with reflionx (Ross & Fabian 2005). A warm absorber com-ponent was also included and modeled with xstar. The relativistic blurring applied to the ionized reflection
em-The Soft-Excess in Mrk 509: Warm Corona or Relativistic Reflection? ployed relconv (Dauser et al. 2013). Two sets of fits
were performed: one with a fixed cross-normalization constant between the hard ray PIN and the soft X-ray XIS detectors, and another in which this cross-normalization CPIN/XIS was allowed to vary. The
un-certainty introduced by CPIN/XIS has critical impact on
the results for Mrk 509. In short, two vastly different pictures emerge from the fits, simply due to differences in the hard X-ray component. In the first instance of fixed CPIN/XIS= 1.17, the system demands a high spin
a = 0.86 ± 0.02 and face-on orientation (inclination of i < 18◦). However, when CPIN/XIS is freed, it becomes
loosely constrained (CPIN/XIS < 1.06), while spin and
inclination are drastically affected: a = 0.36 ± 0.3 and i = 50 ± 5◦. This is because the hard X-ray band is es-sential for disentangling the power-law continuum from the ionized reflection component, which motivated the NuSTAR observations presented here.
The fit described in Section 3.2 and shown in Fig-ure 4 demonstrates that the relativistic reflection sce-nario (Model 2) provides a good description of the present Suzaku and NuSTAR data for Mrk 509, with results that are broadly consistent with the high-spin fits presented by Walton et al. (2013). Moreover, our fits have been carried out with updated reflection mod-els, which include more complete atomic data, improved radiative transfer calculations, and the possibility for higher densities in the reflector. This latter improve-ment is important to better describe the soft excess ob-served below 1 keV.
It is worth noticing the relevance of the NuSTAR data in providing high signal-to-noise data at hard en-ergies, where most of the reflection signatures are ob-served. This is particularly important because not only our Suzaku exposure is shorter than that analyzed by Walton et al.(2013), but also because our data lack the high-energy coverage previously provided by the PIN instrument (not longer operational in the last Suzaku cycle). In the case of the relativistic reflection Model 2, fitting the Suzaku data alone yield poor constraints to important parameters such as spin (a∗ > 0.702),
coronal height (h = 2.01+0.29−2.74RHor), and inclination
(i = 51.4 ± 8◦). Unsurprisingly, the disk density is de-termined with a similar uncertainty (log ne/cm−3> 18),
as this parameter is mostly sensitive to the soft-energy data.
When applied to both the Suzaku and NuSTAR data, the goodness-of-fit for the relativistic reflection model (χ2
ν = 1.054) is very similar to that from the fits with
the warm corona picture (χ2ν = 1.049, Model 1.3). The similarity between the warm corona and the relativistic reflection model has also been previously discussed by
Boissay et al. (2014). In Figure 7 we show these two models overplotted with the observed data. It is clear that the two models are almost identical in the energy band considered for the fits (1–79 keV), which is shown with the shaded regions. We emphasize that data below 1 keV was excluded given concerns in the calibration of Suzaku’s instruments in this band towards the end the mission (see Section2.3). We note, however, that when these data are included (without refitting), they seem to favor the trend predicted by the relativistic reflection model. Nevertheless, the lack reliable data below 1 keV limits the analysis of the present study, as we cannot fully constrain the overall shape of the soft excess. Thus, future observations with sensitive coverage of both the soft and hard energy bands will become crucial to fur-ther understand the nature of the soft excess in Mrk 509, and several other AGN.
The small differences between the two models seen at high energies (∼ 30 − 50 keV, Figure7), are likely due to the fact that the reflection models used here were calculated with a cutoff energy fixed at 300 keV, while in the warm corona fit this parameter is allowed to vary freely. This suggests that a lower coronal temperature would be possible with the reflection model, but it is probably not very well constrained, as it does not seem to affect the fit statistics significantly.
The relativistic reflection model requires a large value for the black hole spin (consistent with its maximum value, a∗> 0.993), and low coronal height
(h =1.53+0.01−0.25RHor). While high spins and compact
coronae are commonly reported for AGN, a corona placed so close to the black hole implies a very extreme configuration in which most of the radiation is focused toward the disk due to the strong light bending (Dauser et al. 2016). This configuration predicts a reflection-dominated spectrum, different to the fit achieved with Model 2 (Figure 4, right). Nonetheless, modeling the primary source of X-rays as a point source in the rota-tional axis is a rather simple and idealized description, and thus the derived parameters need to be interpreted with care.
The iron abundance is found to be close to its So-lar value (AFe< 0.82). Fixing AFe = 1 worsens the
fit by ∆χ2 ∼ 12, having no obvious effect on the rest of the model parameters. While Solar abundances are the canonical expectation, much larger Fe abundances are commonly derived from reflection modeling (Garc´ıa et al. 2018). However, recent studies indicate that high-density reflection models (like the ones used here) lead to abundances closer to Solar (e.g.;Tomsick et al. 2018; Jiang et al. 2018), which is consistent with our findings. Moreover, visual inspection of the residuals reveals no
obvious signs of iron emission lines after the distant re-flection is accounted for (e.g., see Figure 3), suggesting that the reflection spectrum is primarily constrained by fitting the soft-excess.
The large density of the accretion disk derived from our fits (log ne/cm−3> 18.2) also places this source in a
somewhat extreme configuration. For instance, Svens-son & Zdziarski(1994) derived analytic expressions for a hot corona around a cold α-disk system. Using their expression for the disk density in the radiation-pressure-dominated case (i.e., their Equation 8)
ne= 1 σTRS 256√2 27 α −1r3/2m˙−2[1 − (3/r)]−1 (1 − f )−3. (8) where α ≈ 0.1 is the standard Shakura & Sunyaev (1973) dimensionless parameter connecting the viscos-ity with the gas pressure, r = 10 is the radius in units of RS = 2Rg, ˙m = 0.1, ne = 1019cm−3, and f is the
fraction of the total accretion power dissipated by the corona. We find f = 0.86, which means that most of the accretion power needs to be dissipated in the hot corona. We note that more conservative values can be found in the literature. For example,Vasudevan & Fabian(2007) reported f ∼ 0.11 − 0.45 for a sample of 54 AGN. Nev-ertheless, our estimate for Mrk 509, albeit extreme, is allowed within the applicability regime of the hot corona and cold disk model.
Meanwhile, high-density reflection models like the one used here have recently been used to successfully de-scribe the spectrum of the AGN IRAS 13224−3809 (Parker et al. 2017; Jiang et al. 2018), and Mrk 1044 (Mallick et al. 2018), as well as of the black hole bi-nary Cyg X-1 (Tomsick et al. 2018). In all these cases, fitting the observed soft excess results in a lower (and more physical) iron abundance in the reflector (see also discussion in Parker et al. 2018). However, in the case of Ark 120, Porquet et al. (2018) find that the warm corona model provides a better description of the data over the relativistic reflection picture, even when high-density models were tested. In a multi-epoch study of Mrk 335, Keek & Ballantyne (2016) showed that after fitting reflection above 3 keV, a constant soft excess ap-pears to remain that is constant to the flux of the source. However, they have only used standard relativistic re-flection, as the high-density reflection models like the ones used here were not available at the time.
One argument against the relativistic reflection sce-nario (and consequently in favor of the warm corona picture), on the other hand, is the apparent discrepancy in the correlation between the strengths of the reflection (Rf) and the soft excess (RSE) components predicted
by relativistic reflection models and that observed in
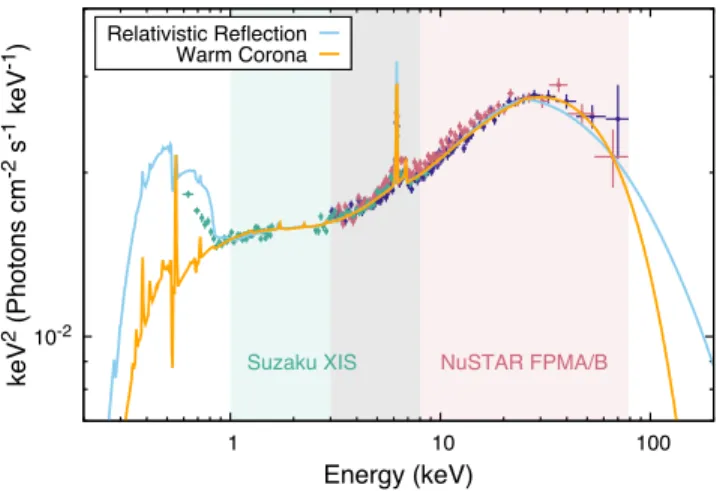
���� �� ��� ���� ���������� ������������� ��� ���������� ��� ���� ������ ��� ������������ ���������������������� �����������
Figure 7. Unfolded spectra of Mrk 509 as seen by Suzaku XIS and NuSTAR FPMA and FPMB (data points), together with the two different scenarios for the soft excess (solid lines), the relativistic reflection (Model 2), and the warm corona (Model 1.3). The shaded regions show the data from each instrument that was included in the fits.
Seyfert AGN. Boissay et al. (2016) showed that while simulations with reflection models predict a positive cor-relation between Rf and RSE (see alsoVasudevan et al.
2014), observations of a sample of 42 AGN show a nega-tive correlation. They argued that this discrepancy can be overcome if instead the soft excess is modeled with warm Comptonization models. However, their sample includes data that are not simultaneous, which is likely to bias their results for sources with strong variabil-ity. More importantly, their fits implement very sim-plistic models for reflection, which are fundamentally incorrect to properly describe the combination of dis-tant (non-relativistic) and local (relativistic) reflection. In many un-obscured AGN, the narrow (unblurred) re-flection component dominates the relativistic rere-flection signal (e.g.,Ricci et al. 2014). Thus, the reflection frac-tion measured by Boissay et al. (2016) is likely biased towards the strength of the distant reflector. In this case, the anti-correlation with the strength of the soft excess can be simply explained by geometrical effects. For sources that are more obscured, the emission from the inner-most regions will tend to be reduced, which re-duces the direct continuum (increasing Rf) as well as the
local relativistic reflection component (decreasing RSE).
5. CONCLUSIONS
We have presented an analysis of the X-ray spectrum (1–79 keV) of the bright Seyfert 1 AGN Mrk 509. These data, obtained during April–June 2015 with Suzaku and NuSTAR reveal signatures of X-ray reprocessing from an optically thick and relatively cold material, a power-law continuum, and a strong soft excess. By
perform-The Soft-Excess in Mrk 509: Warm Corona or Relativistic Reflection? ing fits of different modern models, we have shown that
these data can be described by a hot corona which pro-duces the power-law continuum (modeled with a stan-dard Comptonization model), and a distant reflection from a cold material (which can be described with a va-riety of reflection models). Meanwhile, the soft excess can be fitted with either a warm Comptonizing corona, or with a relativistically blurred high-density reflection model. These two prescriptions imply two very different interpretations of the observed spectrum, and they can-not be easily distinguished on statistical grounds alone. Although the Suzaku data below 1 keV seems to favor the relativistic reflection scenario, this energy range was excluded from the fit due to concerns regarding the qual-ity of the instrumental calibration.
Since no model can be preferred based on the fit statis-tics, we have discussed in detail the physical implications of these two models. In particular, we find that the quantities required to fit the soft excess with the warm corona model—i.e., low temperature (kT ∼ 0.5 − 1 keV) and large optical depth (τT ∼ 10 − 20)— are
incom-patible with the physical concept of a corona, in which electron scattering is expected to be the dominant source of opacity. Using simple estimates of density, flux, and ionization parameter, we have carried out calculations of plasmas in coronal and photoionization equilibrium. In both cases, we found that atomic opacities will dominate over Thomson opacities, predicting very strong absorp-tion features in the observed spectrum. Taking these simulations to the most extreme cases, we find that it is very unlikely that a warm corona can produce the soft featureless emission required to fit the data.
On the other hand, the relativistic reflection model appears more reasonable on physical grounds. Signa-tures of X-ray reflection have been shown to be almost ubiquitous in most Seyfert AGN spectra, and thus it is also expected to be present in Mrk 509. The rela-tivistic reflection model requires extreme values for the spin and coronal compactness, as well as a very large density for the reflector. Although large densities are somewhat unexpected in accretion disks around super-massive black holes, we cannot discard this possibility. Therefore, based on the analysis presented here, we favor the high-density relativistic reflection scenario to explain the soft excess in Mrk 509.
Nonetheless, the present discussion is not entirely con-clusive. The calculations described above do not in-clude photon redistribution due to Comptonization in the medium, nor any other source of turbulent mo-tions capable to broaden and smear the absorption lines present in the spectra. Evidently, these effects are only relevant for the simulations at the highest temperatures
(T ∼ 107K). For lower temperatures, the drastic
mod-ification of the spectrum due to the strong absorption prevents this model to reproduce the soft excess. De-tailed radiative transfer calculations covering larger op-tical depths, Comptonization, velocity components, and the effects of the response of current instruments are necessary to fully explore this problem. Such calcula-tions are well outside the scope of the present work, and thus will be featured in a future publication.
Finally, deeper observations of this source should be able to confirm or not the presence of relativis-tic reflection. To clearly distinguish between the nar-row and broad components, future missions flying mi-crocalorimeters such as XRISM (Tashiro et al. 2018), Athena (Nandra et al. 2013), and Lynx (Ozel 2018¨ ), will become crucial. However, in order to detect the shift of Compton hump between the relativistic and the non-relativistic reflection, focusing of hard photons with larger effective area than NuSTAR is necessary. The concept mission HEX-P (Madsen et al. 2018), will offer these capabilities. Likewise, observations with instru-ments with broad-band coverage and good sensitivity to both low and energies such as STROBE-X (Ray et al. 2018) will help to break model degeneracies further un-derstand the nature of the soft excess in Mrk 509 and many other AGN.
We thank P.O. Petrucci, J. Malzac, B. Czerny, A. R´o˙za´nska, C. Done, and the members of the FERO collaboration for insightful discussions that promoted many aspects of this paper. We also thank F. Ursini for comments to improve the manuscript.
J.A.G. acknowledges support from NASA grant NNX15AV31G and from the Alexander von Humboldt Foundation. R.M.T.C. has been supported by NASA grant 80NSSC177K0515. E.G. acknowledges support by the DFG cluster of excellence “Origin and Struc-ture of the Universe”. M.B. acknowledges support from the Black Hole Initiative at Harvard University, which is funded by a grant from the John Templeton Foun-dation. J.F.S. has been supported by NASA Einstein Fellowship grant PF5-160144. F.T. acknowledges sup-port by the Programma per Giovani Ricercatori - anno 2014 “Rita Levi Montalcini”. L.L. acknowledge sup-port from NASA through grant number NNX15AP24G C.R. acknowledges support from the CONICYT+PAI Convocatoria Nacional subvenci´on a instalaci´on en la academia convocatoria a˜no 2017 PAI77170080.
This work was partially supported under NASA con-tract No. NNG08FD60C and made use of data from the NuSTAR mission, a project led by the California Insti-tute of Technology, managed by the Jet Propulsion
Lab-oratory, and funded by the National Aeronautics and Space Administration. We thank the NuSTAR Opera-tions, Software, and Calibration teams for support with the execution and analysis of these observations. This research has made use of the NuSTAR Data Analysis Software (NuSTARDAS), jointly developed by the ASI
Science Data Center (ASDC, Italy) and the California Institute of Technology (USA).
Facilities:
NuSTAR, Suzaku (XIS)Software:
xspec (v12.9.0d;Arnaud 1996), MYtorus (Murphy&Yaqoob2009),Borus02(Balokovi´cetal.2018), xillver(Garc´ıa&Kallman2010;Garc´ıaetal.2013 ),relx-ill (v1.2.0;Garc´ıa et al. 2014;Dauser et al. 2014), xstar (v2.41;Kallman & Bautista 2001), nustradas (v1.6.0)REFERENCES Arnaud, K. A. 1996, in Astronomical Society of the Pacific
Conference Series, Vol. 101, Astronomical Data Analysis Software and Systems V, ed. G. H. Jacoby & J. Barnes, 17
Arnaud, K. A., Branduardi-Raymont, G., Culhane, J. L., et al. 1985, MNRAS, 217, 105,
doi:10.1093/mnras/217.1.105
Balokovi´c, M., Matt, G., Harrison, F. A., et al. 2015, ApJ, 800, 62, doi:10.1088/0004-637X/800/1/62
Balokovi´c, M., Brightman, M., Harrison, F. A., et al. 2018, ApJ, 854, 42, doi:10.3847/1538-4357/aaa7eb
Boissay, R., Ricci, C., & Paltani, S. 2016, A&A, 588, A70, doi:10.1051/0004-6361/201526982
Boissay, R., Paltani, S., Ponti, G., et al. 2014, A&A, 567, A44, doi:10.1051/0004-6361/201423494
Brenneman, L. W., Madejski, G., Fuerst, F., et al. 2014, ApJ, 788, 61, doi:10.1088/0004-637X/788/1/61 Brightman, M., & Nandra, K. 2011, MNRAS, 413, 1206,
doi:10.1111/j.1365-2966.2011.18207.x
Cappi, M., Tombesi, F., Bianchi, S., et al. 2009, A&A, 504, 401, doi:10.1051/0004-6361/200912137
Costantini, E., Kriss, G., Kaastra, J. S., et al. 2016, A&A, 595, A106, doi:10.1051/0004-6361/201527956
Crummy, J., Fabian, A. C., Gallo, L., & Ross, R. R. 2006, MNRAS, 365, 1067,
doi:10.1111/j.1365-2966.2005.09844.x Czerny, B., & Elvis, M. 1987, ApJ, 321, 305,
doi:10.1086/165630
Czerny, B., Niko lajuk, M., R´o˙za´nska, A., et al. 2003, A&A, 412, 317, doi:10.1051/0004-6361:20031441
Dauser, T., Garc´ıa, J., Parker, M., Fabian, A., & Wimls, J. 2014, Submitted to MNRAS, 430, 1694
Dauser, T., Garc´ıa, J., Walton, D. J., et al. 2016, A&A, 590, A76, doi:10.1051/0004-6361/201628135
Dauser, T., Garcia, J., Wilms, J., et al. 2013, MNRAS, 430, 1694, doi:10.1093/mnras/sts710
Done, C., Davis, S. W., Jin, C., Blaes, O., & Ward, M. 2012, MNRAS, 420, 1848,
doi:10.1111/j.1365-2966.2011.19779.x
Fabian, A. C., Ballantyne, D. R., Merloni, A., et al. 2002, MNRAS, 331, L35, doi:10.1046/j.1365-8711.2002.05419.x Fabian, A. C., Zoghbi, A., Ross, R. R., et al. 2009, Nature,
459, 540, doi:10.1038/nature08007
Fisher, K. B., Huchra, J. P., Strauss, M. A., et al. 1995, ApJS, 100, 69, doi:10.1086/192208
Garc´ıa, J., Dauser, T., Reynolds, C. S., et al. 2013, ApJ, 768, 146, doi:10.1088/0004-637X/768/2/146
Garc´ıa, J., & Kallman, T. R. 2010, ApJ, 718, 695, doi:10.1088/0004-637X/718/2/695
Garc´ıa, J., Dauser, T., Lohfink, A., et al. 2014, ApJ, 782, 76, doi:10.1088/0004-637X/782/2/76
Garc´ıa, J. A., Dauser, T., Steiner, J. F., et al. 2015, ApJL, 808, L37, doi:10.1088/2041-8205/808/2/L37
Garc´ıa, J. A., Fabian, A. C., Kallman, T. R., et al. 2016, MNRAS, 462, 751, doi:10.1093/mnras/stw1696
Garc´ıa, J. A., Kallman, T. R., Bautista, M., et al. 2018, in Astronomical Society of the Pacific Conference Series, Vol. 515, 282
George, I. M., & Fabian, A. C. 1991, MNRAS, 249, 352 Gierli´nski, M., & Done, C. 2004, MNRAS, 349, L7,
doi:10.1111/j.1365-2966.2004.07687.x
Haardt, F. 1993, ApJ, 413, 680, doi:10.1086/173036 Harrison, F. A., Craig, W. W., Christensen, F. E., et al.
2013, ApJ, 770, 103, doi:10.1088/0004-637X/770/2/103 Jiang, J., Parker, M. L., Fabian, A. C., et al. 2018,
MNRAS, 477, 3711, doi:10.1093/mnras/sty836
Jin, C., Done, C., Ward, M., Gierli´nski, M., & Mullaney, J. 2009, MNRAS, 398, L16,
doi:10.1111/j.1745-3933.2009.00697.x
Kaastra, J. S., Petrucci, P.-O., Cappi, M., et al. 2011, A&A, 534, A36, doi:10.1051/0004-6361/201116869 Kaastra, J. S., Ebrero, J., Arav, N., et al. 2014, A&A, 570,