2012 J. Phys.: Conf. Ser. 359 012018
(http://iopscience.iop.org/1742-6596/359/1/012018)
Download details: IP Address: 151.25.8.45
The article was downloaded on 12/05/2012 at 20:23
Please note that terms and conditions apply.
The THz Radiation Source at the SPARC Facility
E. Chiadroni, A. Bacci, M. Bellaveglia, M. Castellano, G. Di Pirro, M. Ferrario, G. Gatti, E. Pace, A. R. Rossi, C. VaccarezzaINFN/LNF, via E. Fermi 40, 00044 Frascati, Italy
P. Calvani, A. Nucara, D. Nicoletti, O. Limaj, S. Lupi
Phys. Dept. and INFN University of Rome “La Sapienza”, p.le A. Moro, 1 - Rome, Italy
B. Marchetti, A. Cianchi
Phys. Dept. and INFN University of Rome “Tor Vergata”, via della Ricerca Scientifica 1, 00133 Rome, Italy
A. Mostacci
SBAI Dept. University of Rome “La Sapienza”, Rome, Italy
C. Ronsivalle
ENEA C.R. Frascati, Italy
A. Perucchi
Elettra Synchrotron, SS 14, Basovizza, Trieste, Italy E-mail: [email protected]
Abstract. The interest for Terahertz (THz) radiation is rapidly growing, both as it is a
powerful tool for investigating the behavior of matter at low energy, and as it allows for a number of possible spectroscopic applications spanning from medical science to security. The linac-driven THz source at the SPARC facility can deliver broadband THz pulses with femtosecond shaping and can be used for electron beam diagnostics to fully reconstruct the longitudinal charge distribution. Beyond this application, the possibility to store much more energy in a single THz pulse than table-top sources renders the SPARC THz source very interesting for a spectroscopic use. In addition, taking advantage from electron beam manipulation techniques, high power, narrow-band THz radiation can be also generated. Those source characteristics provide a unique chance to realize THz-pump/THz-probe spectroscopy, a technique practically unexplored up to now.
1. Introduction
SPARC is an R&D photoinjector facility for the generation of high brightness electron beams, which was originally conceived to perform electron beam dynamics studies and Free Electron Laser (FEL) experiments, both under Self Amplified Spontaneous Emission (SASE) regime in the
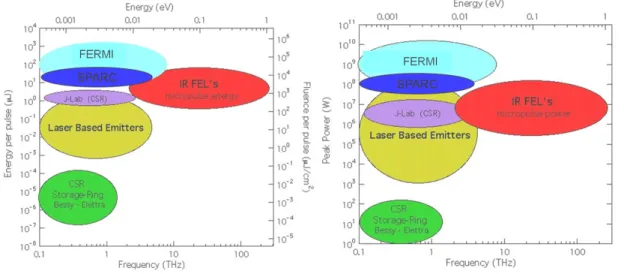
based source. Indeed, from simulations the expected peak power for the SPARC THz source is foreseen in the order of 108
Watts (Fig.1, right plot). Such a power performance would produce pulses delivering an energy in the order of few (up to ten) µJ (Fig.1, left plot), well above THz radiation from synchrotrons and most standard table top sources. Applications of high
Figure 1. Energy/fluence per pulse (left) and peak power (right) figures of merit of the THz CTR emission at SPARC are plotted in comparison to those of conventional THz sources. peak power pulses concern mainly time domain spectroscopy with THz pump/THz probe and frequency domain measurements on novel materials, e.g. superconductors.
From an accelerator point of view, coherent THz radiation is a valid tool for electron beam longitudinal diagnostics, enabling to reconstruct the longitudinal charge distribution of the bunch.
2. Theory
Radiation extending up to the THz range can be generated as coherent radiation from ultra-short (≈ sub-ps) electron bunches. Any radiation process which does not change the electron distribution during the emission, and in which no interaction between particle and radiation happens, can be used to retrieve the longitudinal electron beam charge distribution by studying the coherent spectrum of radiation emitted by the bunch. This is true, in particular, for transition and diffraction radiation, where the emission is a surface phenomenon and thus virtually instantaneous; however, if the electron distribution in the bunch can be considered frozen during the emission, also synchrotron radiation, spontaneous undulator radiation and Cherenkov radiation may be considered as suitable sources.
2.1. Coherent Radiation
The total radiation intensity emitted by a bunch of electrons, I(λ) = Isp[N + N (N − 1)F (λ)], can be interpreted as the sum of two terms [5]: one, proportional to the number of particles N , represents incoherent emission, whereas the one proportional to N2
implies a coherent process, which dominates the emission at wavelengths (λ) equal and longer than the bunch length. Isp is the single particle radiation intensity, which depends on the emission mechanism considered. The coherent intensity depends on the bunch longitudinal dimension through the longitudinal form factor, F (λ) [6], defined as the Fourier transform of the bunch longitudinal profile. It is then clear that, by measuring the coherent spectrum, the form factor is determined and the longitudinal profile can be retrieved.
2.2. Transition Radiation
Let us consider as emission phenomenon the radiation produced when a relativistic charged particle crosses the boundary between two media with different dielectric constants, e.g a vacuum-metal screen interface. The transition radiation (TR) originates from the time varying currents induced, on the target surface, by the field of the traveling charge, due to optical inhomogeneities in the space. Assuming a perfectly conducting, infinitely thin target, which extends indefinitely transversally, the spectral and angular energy distribution from a single electron is well described by the Ginzburg-Frank formula in far field approximation [7]
Isp= e2 4π3 ε0c β2 sin2 (θ) (1 − β2 cos2 (θ))2 (1)
with β = v/c and θ the emission angle. In such picture, the TR spectral distribution of radiation frequencies well below the target plasma frequency, ωp, does not depend on frequency itself; moreover the intensity is concentrated within a cone whose axis is coincident with the particle velocity and displays an angular aperture proportional to 1/γ (γ being the Lorentz factor). In a real experimental setup, the assumptions of infinite target size and far-field approximation are not usually fulfilled, causing the TR spectrum to become a complicate function of beam energy, target extension, frequency and angle of emission [8]. Since the natural extent of the particle transverse field Fourier components is of the order of γλ, when the electron energy is relatively high long wavelength components may exceed the dimension of the target, resulting in a strong suppression of low-frequencies. Indeed, as it is shown in Fig.2, for a 90 MeV particle energy and a screen radius of 20 mm, even at 1 THz the real spectral angular distribution is not well reproduced by the Ginzburg-Frank formula.
2.3. Beam Manipulation Techniques
Short electron bunches are mandatory for the generation of high peak power, broad band, extending up to high frequencies, THz radiation. In order to longitudinally compress the beam down to few hundreds of femtosecond, the velocity bunching (VB) [10] is used at SPARC [11]. The VB technique relies on the fact that the beam is injected in the first accelerating structure at the phase of zero crossing RF field. Since the beam is slightly slower than the phase velocity of the RF wave, it slips back to phases where the field is accelerating, and it is simultaneously chirped and compressed. Due to non-linearities in the beam longitudinal phase space, the longitudinal profile of the compressed beam has a sharp rising edge, which is responsible of emission at higher THz frequencies.
As an alternative to broadband THz radiation, coherent narrow-band, high peak power THz radiation can be produced by means of longitudinally modulated electron beams generated by tailoring the shape of the drive laser pulse. Several techniques can be considered, e.g the one presented in [12]; here we will describe the one in use at SPARC [13], [14].
0 0.01 0.02 0.03 0.04 0.05 0.06 0 2 ! (rad) Single Particle TR spectrum (
Figure 2. Modified Ginzburg-Frank formula [9] to take into account the effect of a finite size target (with radius a=20 mm) with respect to the natural size of the particle field (γλ, γ=176). The spectral angular distribution for different wavelengths is compared to the ideal Ginzburg-Frank formula.
If a train of n laser pulses, named as laser comb, with picosecond distance, illuminates the photocathode, assuming an instantaneous emission, each pulse will produce a disk of electrons with the same spacing as the laser pulses. Due to longitudinal space charge forces, the bunch lengthens and the longitudinal modulation is mixed up at the end of the drift downstream of the gun. Nevertheless, memory of the original structure is kept in the longitudinal phase space, manifesting in a saw-tooth like energy profile. Thus, in the VB process, due to a correlated time-velocity chirp in the electron bunch, causing electrons on the tail to be faster than those on the head, a rotation in the longitudinal phase space occurs in the first accelerating section and the longitudinal modulation is restored at the end of the linac.
If a comb train with THz repetition rate is transported to the TR target, narrow band emission occurs at the frequency corresponding to the pulse inter-distance. The longitudinal form factor of a comb-like electron beam distribution, as that shown in Fig.3, is a single peak at the comb repetition rate, whose intensity is the same as if all the electrons were confined in the single sub-pulse. In case of shorter electron pulses, higher and more intense harmonics show up in the comb form factor, as pointed out in Fig.4.
The emission frequency can be tuned by changing the distance between pulses in the train. Therefore combining the VB technique and a comb-like electron beam distribution, a tunable narrow band THz source can be produced.
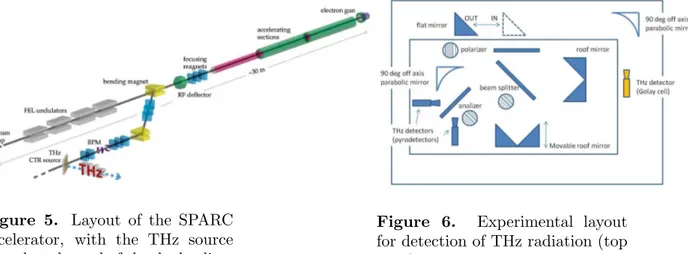
3. Experimental Layout
Coherent Transition Radiation (CTR) is generated at the interface of an Aluminum coated Silicon screen. The screen is placed at the end of the by-pass line (Fig.5) in the vacuum pipe at 45o with respect to the electron beam direction. CTR is then extracted at 90o through a z-cut quartz window. Radiation is then collected by a 90o off-axis parabolic mirror. Parallel radiation is then reflected down to a flat mirror at 45o which reflects radiation horizontally. Two schemes are foreseen (Fig.6): one for interferometer measurements and one for integrated CTR measurements with the possibility of selecting custom band pass filters in the THz range [15].
A Martin-Puplett interferometer [16] is used for frequency domain measurements. The main advantages of this device derive from the beam splitter properties: it splits polarizations and, being made of wires, reflectivity coefficients depend on wires diameter and spacing. Furthermore,
!20 !1 0 1 2 0.5 1 1.5 Time (ps) Normalized Intensity d = 1 ps "t = 100 fs
Figure 3. Calculated four-pulses comb profile with 1 ps pulse separation and 100 fs rms sub-pulse length. 0 1 2 3 4 5 0 0.2 0.4 0.6 0.8 1 Frequency (THz) Form Factor Rep. rate = 1 THz
Figure 4. Form factor corresponding to the four-pulses comb train: narrow band THz emission occurs at the comb repetition rate, i.e. 1 THz, and at higher harmonics.
Figure 5. Layout of the SPARC accelerator, with the THz source placed at the end of the dogleg line.
Figure 6. Experimental layout for detection of THz radiation (top view).
measuring the intensity of both polarizations, the difference interferogram can be normalized to the sum, thus canceling correlated fluctuations due to electron beam instabilities.
4. Results
High peak power (≈ MW), broad band THz radiation up to 5 THz has been measured at SPARC with a 500 pC, 500 fs electron beam. Details can be found in [17].
Narrow band THz radiation has been produced and characterized by studying the rotation of the longitudinal phase space of a four-pulses train under VB regime. At the maximum compression phase, the four pulses completely overlap in time (Fig.7); moving the compression phase toward the over compression regime, the bunches get better separated and modulated (Fig.8).
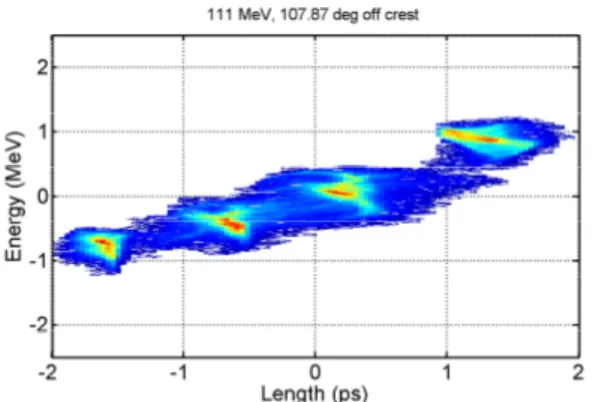
The relevant regime for THz applications, i.e. where the sub-bunches are well separated and their distance, thus the THz emission frequency, can be tuned with the RF compressor injection phase, is the the so-called “deep” over-compression regime (Fig.9).
Figure 7. Measured longitudinal phase space for a four-pulses comb beam at the maximum compression phase; the title reports the average energy and the compression phase (200 pC total charge).
Figure 8. Measured longitudinal phase space for a four-pulses comb beam in the over-compression regime; the title reports the average energy and the compression phase (200 pC total charge).
Figure 9. Measured longitudinal phase space for a four-pulses comb beam in the “deep” over-compression regime; the title reports the average energy and the over-compression phase (200 pC total charge).
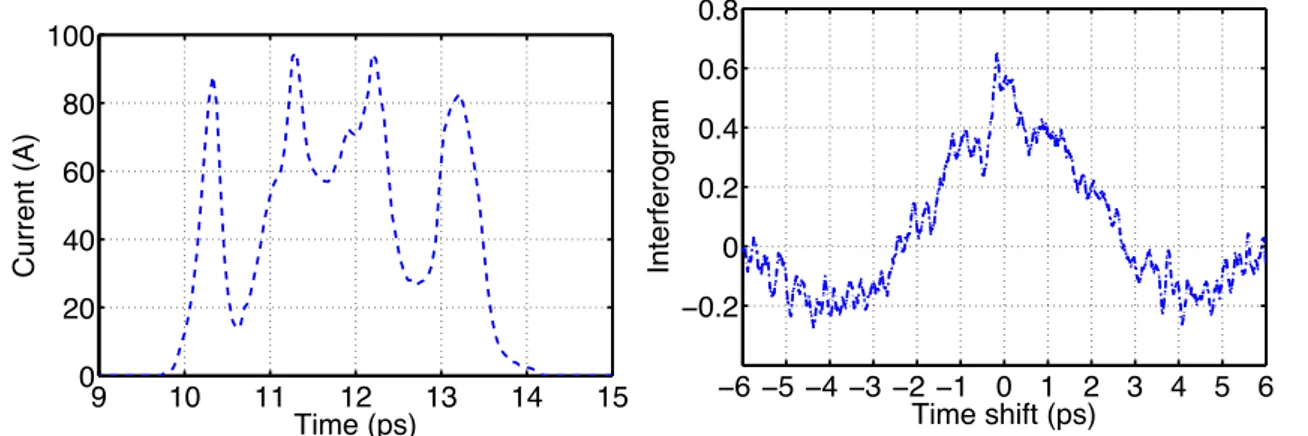
profile, shown in Fig.10, has been measured at the beginning of the dogleg, i.e. after the first bending magnet in Fig.5. The four-pulses comb train has been then transported along the dogleg line down to the TR screen. The measured autocorrelation function of the modulated current profile shows clearly five (Fig.11, blue curve) out of the seven peaks expected from a four-pulses comb train (Fig.11, red curve) [18]. A reason for the absence of the outer peaks in the measured interferogram might be the effect due to the transport of the comb beam. Indeed, the longitudinal distribution emerging from the dogleg is affected by both the beam overall energy chirp (e.g. the chirp between sub-pulses) and the sub-pulses chirp (e.g. the chirp within a single sub-pulse). If the dogleg R56 parameter is not zero, two sub-pulses might happen to merge into a single one so that the emission will then be driven by a three-pulses comb beam.
In Fig.12 the form factor retrieved from the measured interferogram (blue curve) is compared to the one (red curve) retrieved from the current profile shown in Fig.10. The discrepancy in the emission peaks of the two curves can also be explained by considering the effect of the beam transport through the dogleg: under some conditions, it may act as a decompressing section,
9 10 11 12 13 14 15 0 20 40 60 80 100 Time (ps) Current (A)
Figure 10. Current profile of a four-pulses comb beam as measured at the beginning of the dogleg.
!6 !5 !4 !3 !2 !1 0 1 2 3 4 5 6 !0.2 0 0.2 0.4 0.6 0.8 Time shift (ps) Interferogram
Figure 11. Measured interferogram (blue curve) and expected one from the modulated measured beam shown in Fig.10.
contributing to increase the pulse length and pulses separation, shifting the emission frequency in the sub-THz range.
0 0.5 1 1.5 2 0 0.2 0.4 0.6 0.8 1 Frequency (THz) Form Factor
Retrieved from current profile measured at the beginning of the dogleg Retrieved from interferogram measured at the end of the dogleg
Figure 12. Form factor retrieved from current profile measured at the beginning of the dogleg (red curve), in comparison with the one retrieved by measuring the autocorrelation function of the CTR produced by the four-pulses comb beam. 0 0.5 1 1.5 2 0 0.2 0.4 0.6 Frequency (THz) CTR energy ( µ J/THz)
Retrieved from current profile measured at the beginning of the dogleg Retrieved from interferogram measured at the end of the dogleg
Figure 13. CTR energy per pulse from the measured interferogram (blue curve) and as expected (red curve) from the four-pulses comb beam measured at the beginning of the dogleg. Both curves are obtained by taking into account the single particle TR spectrum in far field approximation and for a finite target size. The experimental system transfer function is also considered.
The measured CTR energy per pulse has then been retrieved (Fig.13, blue curve) taking into account the single particle TR spectrum and the transfer function of the experimental system. A well defined narrow band peak centered around 0.8 THz is visible, as expected from the interferogram peaks distance.
[1] L. Giannessi et al., Phys. Rev. Lett. 106, 144801 (2011).
[2] L. Giannessi et al., Phys. Rev. Special Topics - Accel. and Beams 14, 060712 (2011). [3] M. Labat et al., Proceedings of FEL Conference 2011, WEOB3, Shangai (2011). [4] D. Filippetto et al., Proceedings of FEL Conference 2011, WEOCI2, Shangai (2011). [5] J.S.Nodvick and D.S. Saxon, Phys.Rev. 96, 180 (1954).
[6] R. Lai and A.J. Sievers, Nucl. Instrum. and Meth. A 397, 221-231 (1997).
[7] J. D. Jackson, Classical Electrodynamics, Third Edition, J.Wiley & Sons, Inc. (1995). [8] M. Castellano et al., Nucl. Instrum. and Meth. A 435, 297-307 (1999).
[9] S. Casalbuoni et al., PRST - AB 12, 030705 (2009).
[10] L. Serafini and M. Ferrario, AIP Conf. Proceedings 581, 87 (2001). [11] M. Ferrario et al., Phys. Rev. Lett. 104, 054801 (2010).
[12] J. G. Neumann et al., J. Appl. Phys. 105, 053304 (2009).
[13] M. Boscolo et al., Nucl. Instrum. and Meth. A, 577, 409-416 (2007). [14] M. Ferrario et al., Nucl. Instrum. and Meth. A 637, S43-S46 (2011). [15] N. I. Landy, IEEE 1-4244-1449-0/07/$25.00 c, 1-2 (2007).
[16] D. H. Martin and E. Puplett, Infrared Physics, vol. 10, pp. 105-109 (1970). [17] E. Chiadroni et al., Proceedings of IPAC 2010, TUOARA03, Kyoto (2010). [18] E. Chiadroni et al., Proceedings of IPAC 2011, THPS101, San Sebastian (2011).
![Figure 2. Modified Ginzburg-Frank formula [9] to take into account the effect of a finite size target (with radius a=20 mm) with respect to the natural size of the particle field (γλ, γ=176).](https://thumb-eu.123doks.com/thumbv2/123dokorg/8037421.122642/5.892.273.616.174.405/figure-modified-ginzburg-formula-account-respect-natural-particle.webp)