Università degli Studi Roma TRE
e
Consorzio Nazionale Interuniversitario per le Scienze Fisiche
della Materia
Dottorato di Ricerca in Scienze Fisiche della Materia
XXVI ciclo
“Experimental Study of the Phase Behaviour
of Limited Valence Particles
in DNA Nano-Aggregate Systems”
Tesi di dottorato della dott.ssa Francesca Bomboi
Relatore
Coordinatore Dottorato
Prof. Francesco Sciortino
Prof. Settimio Mobilio
List of Figures 1
Introduction 7
I Limited-valence DNA nanoconstructs
13
1 Limited-valence colloids 15
1.1 Colloidal systems . . . 16
1.1.1 Colloids as superatoms . . . 16
1.1.2 Phase behaviour of spherically-interacting colloids . . . 17
1.1.3 Beyond spherical interactions: from superatoms to supermolecules 18 1.1.4 Colloidal gelation . . . 20
1.2 Reduced-Valence Colloids . . . 27
1.2.1 Phase Diagram . . . 27
1.2.2 Equilibrium Gels . . . 29
1.2.3 A first experimental evidence . . . 30
2 DNA nanoconstructs 33 2.1 Basic Principles of DNA self-assembly . . . 34
2.1.1 DNA structure . . . 34 2.1.2 Helix stability . . . 36 2.1.3 Melting temperature . . . 38 2.2 Structural DNA-nanotechnology . . . 40 2.2.1 Structure design . . . 40 2.2.2 Sticky-end cohesion . . . 42 2.2.3 DNA topology . . . 43 2.2.3.1 Linear DNA . . . 44 2.2.3.2 Branched DNA . . . 44 2.2.3.3 Networked DNA . . . 47
Contents
II Experimental Section
53
3 Methods 55
3.1 Dynamic Light Scattering . . . 56
3.1.1 Basic Theory of Light Scattering . . . 56
3.1.2 Dynamic Light Scattering . . . 63
3.1.3 Dynamic Investigation using Dynamic Light Scattering . . . 65
3.1.4 Ornstein-Zernike theory of the scattering amplitude . . . 68
3.1.5 Light scattering setup . . . 69
3.2 Ultraviolet absorption . . . 70
3.2.1 Basic Theory of UV Absorption . . . 71
3.2.2 Lambert-Beer law . . . 73
3.2.3 Spectroscopic Analysis of DNA . . . 73
3.2.4 Melting experiments . . . 76
3.2.5 UV absorption setup . . . 77
3.3 Atomic Force Microscopy . . . 78
3.3.1 Basic Theory of AFM . . . 78
3.3.2 AFM on nucleic acids . . . 80
3.3.3 AFM setup . . . 81
3.4 Gel electrophoresis . . . 82
3.4.1 Types of gels . . . 82
III Results and Discussion
85
4 Design and preliminary investigation of DNA nanostars 87 4.1 Structure design . . . 884.1.1 Temperature behaviour . . . 89
4.1.2 Estimate of 4G and Tm for nanostar overhangs . . . 90
4.2 Sample preparation . . . 91
4.3 Preliminary Investigation . . . 94
4.3.1 Gel electrophoresis . . . 94
4.3.2 UV melting profiles . . . 95
4.3.3 AFM Visualization . . . 102
5 DNA goes critical 111 5.1 Phase behaviour of DNA nanostars . . . 112
5.1.1 Meniscus visualization . . . 112
5.1.2 Phase Diagram . . . 114
5.2 Critical Behaviour . . . 115
5.2.1 T -dependence of the scattering intensity along the critical isochore116 5.3 Dynamic Behaviour . . . 118
5.3.2 Anomalous dynamic behaviour of nanostar solutions . . . 120
5.3.3 T -dependence of the other fitting parameters . . . 123
6 Salt effects on the nanostar dynamics 125 6.1 Behaviour of f = 3 nanostars in the dense region . . . 126
6.1.1 Static Behaviour . . . 127
6.1.2 Dynamic Behaviour . . . 129
6.2 Ionic strength dependence of the fitting parameters . . . 134
6.2.1 Decay times . . . 134
6.2.2 Stretching exponents . . . 136
6.2.3 Non ergodicity factor . . . 137
6.3 Comparative analysis as a function of the ionic strength . . . 139
6.3.1 Field correlation functions at the same temperature . . . 139
6.3.2 Field correlation functions having the same fq . . . 142
6.4 Experimental evidence of equilibrium gelation . . . 143
Conclusions 148
Bibliography 151
List of Figures
1.1 Schematic phase diagram for particles interacting with isotropic potentials. It can be seen that the glass line hits the gas-liquid spinodal at large densities. Figure from [25]. . . 18 1.2 Examples of recently synthesized anisotropic building blocks. Particles are
classi-fied in rows by anisotropy type and increase in size from left to right. Figure from [35]. . . 20
1.3 Scheme of the arrested phase separation scenario: a quench into the two-phase
region may lead to an arrest of the denser phase. Figure from [18]. . . 22 1.4 Scheme of the stabilization of of an equilibrium cluster phase and gel, through
the inhibition of the phase separation region by an enhanced bond lifetime, when additional long-range repulsions are considered. At low T , equilibrium clusters are formed due to the microphase separation. At low T and larger , gelation results as percolation of the long-lived clusters. Figure from [18]. . . 23 1.5 Scheme of the shift to lower packing fractions of the coexistence region with the
clear insurgence of an equilibrium gel phase, as well as of the ideal gel phase at T = 0. The question mark refers to the unknown details of the crossover from gel-to-glass dynamics. Figure from [18]. . . 24 1.6 q-dependence of Fq(t) for chemical gelation at two fixed values of : just below
percolation (left) and well within percolation (right). p= 0.23 for this model.
Data from [51]. Figure from [18]. . . 26 1.7 -dependence ofFq(t)at the nearest-neighbour peak (left) and of the non-ergodicity
parameter fq (right) for chemical gelation. Data from [51]. Figure from [18]. . . 26
1.8 Top: Experimental realization of patchy particles from bidisperse colloids in water droplets. Bottom: Schematic representation of the location of the square-well interaction sites (centers of the small spheres) on the surface of the hardcore particle. Adapted from [18]. . . 27 1.9 Schematic phase diagram for particles interacting with limited-valence potentials.
In this case, the shrinking of the gas-liquid coexistence region opens up a window in which an extensively bonded network can form. Figure from [25].. . . 28 1.10 Shift of phase coexistence region with the valence f of the particles. For spherical
attraction f = 12 from geometrical constraints; when f < 6 a systematic shift of both critical point and coexistence region can be observed. Adapted from [16]. . 29
1.11 Photographs of Laponite samples in the concentration range 0.1 < CW < 1.2 %
at very long waiting times (v 30000 h). Figure from [17]. . . 30
1.12 Evolution of the SAXS measured structure factor with waiting time for Cw =
0.8 % (located inside the phase separation region) and for Cw = 1.2% (located outside the phase separation region). The curve are measured at increasing waiting time: from the bottom to the top tw = 500, 900, 1600, 2700, 3400, 4700, 6000, 8700, 11000 h). Figure from [17]. . . 31 1.13 Phase diagram in the ⇢⇤ T⇤ plane, where ⇢⇤ is the number density scaled by the
close-packing density and T⇤ is the thermal energy scaled by the bond strength.
Figure from [17]. . . 32 2.1 Schematic representation of the B-form of the DNA double helix. The figure shows
the main forces which are responsible for the stability of the helix, i.e. base pairing and base pairing. Figure from [5]. . . 35
2.2 Schematic representation of the Watson-Crick pairing between nucleobases. . . . 36
2.3 Schematic representation of the NN approach to the calculation of free energy of hybridization of a DNA sequence. . . 38
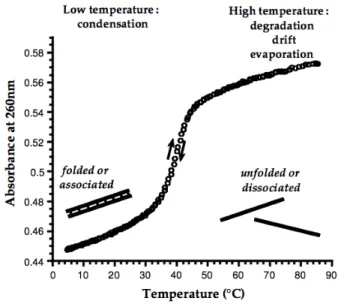
2.4 Thermal denaturation transition of a DNA helix: UV absorbance increases with
temperature in a sigmoidal shape, following the unstacking of the bases. . . 39
2.5 Scheme of sticky-end cohesion. (a) Two linear DNA duplexes with complementary
sticky-ends are shown. Sticky-ends can bring these duplexes together through specific hydrogen bonding. (b) The product of the association is the classic ds-DNA. Figure from [66].. . . 42 2.6 Star-shaped DNA nanostructure, resulting from the hybridization of four partially
complementary sequences (blue, purple, green and red). Figure from [66]. . . 44 2.7 Self-assembly of branched DNA molecules to form larger arrangements. Left panel
shows a four-arm branched junction made from four differently colored strands. Right panel shows how four junctions self-assemble through sticky-ended cohesion to form a quadrilateral. Figure from [66]. . . 45 2.8 Topological constructs built using DNA strands. (a) A 12-arm junction: it is not
possible to eliminate symmetry around the center of this junction, so identical nucleotide pairs are spaced at four-step intervals around the junction. Figure from [75]. (b) A cube-like molecule: such molecule is a hexacatenane; each edge corresponds to two double helical turns of DNA. Each backbone strand is drawn in a different color (each one corresponding to a given face of the cube). Figure from [76]. (c) A DNA-truncated octahedron: this molecule is a 14 catenane with each edge consisting of two turns of ds-DNA. Figure from [77]. . . 45 2.9 Schematic illustration of (A) Y-shaped DNA building block and (B) dendrimer-like
DNA formation. Figure adapted from [78].. . . 46 2.10 Schematic representation of double crossover, triple crossover and paranemic crossover
List of Figures 2.11 Schematic representations of several DNA tiles: rectangular, Y-shaped, X-shaped
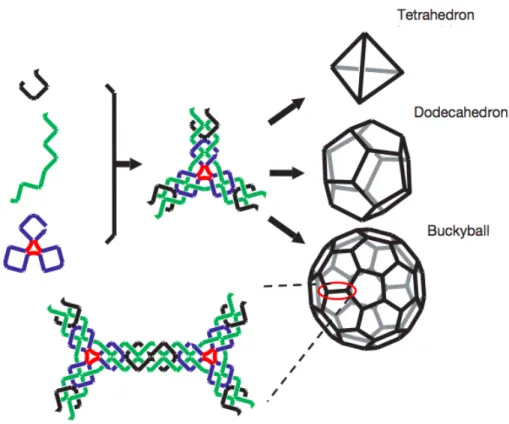
and star-shaped. The AFM images show the two-dimensional lattices achieved from the self-assembly of multiple copies of the same DNA tile. Figure from [69]. 48 2.12 A symmetric three-arm junction assembles into a three-dimensional tetrahedron,
octahedron or buckyball. Figure from [86]. . . 49 2.13 Top row: folding paths for realizing different shapes of DNA origami. Second row:
diagrams showing the bend of helices at crossovers and away from them. Bottom rows: AFM visualization of the structures. Figure from [88]. . . 50 2.14 On the left: Different branched structures giving rise to network of bonded
struc-tures. On the right: X-DNA hydrogel synthesized in a cylindrical mould. The inset shows the DNA gel stained with a specific dye (SYBR I). Figure adapted from [92]. . . 51 3.1 Schematic representation of a light scattering experiments, showing the scattering
vector q. . . 57 3.2 Coordinates for discrete scatterers. Relative to an arbitrary origin O, Rj(t)is the
position of the center of mass of particle j at time t and rj(t) is the position of
volume element dV j in particle j, relative to its center of mass. . . 60
3.3 Schematics of a DLS experiment, showing the speckle pattern. Figure from [98]. 63
3.4 Fluctuations of the scattering intensity (left panel) and intensity correlation func-tion (right panel). The time-dependent part of the correlafunc-tion funcfunc-tion decays with a time constant ⌧c which is equal to the characteristic time of the intensity
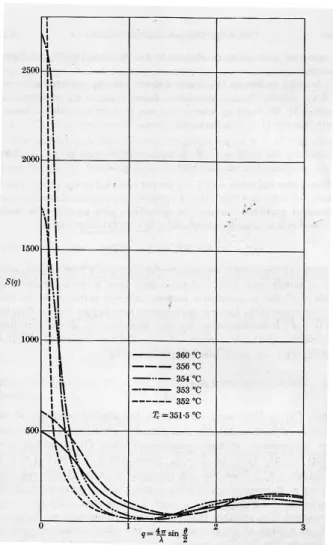
fluctuations. . . 64 3.5 q-dependence of the structure factor for several temperatures just above the critical
temperature of the system (Tc = 351.5 C). Figure from [99]. . . 70
3.6 Energetic levels: for each electronic state Ee exist vibrational states with energy
E⌫ which are associated to numerous rotational states Er.. . . 71
3.7 Energetic levels corresponding to molecular orbitals with the respective electronic transitions. . . 72
3.8 Absorbance bands for purines and pyrimidines: when considered together, their
spectra merge into a single band with lmax ⇠ 260 nm. . . 74
3.9 Typical example of hypochromicity observed in DNA solutions. . . 75
3.10 A thermal denaturation curve corresponding to a parallel bimolecular duplex at pH 6.5. Figure from [102]. . . 76 3.11 Schematic representation of the thermostated Peltier cell used in UV-VIS
spec-troscopy. . . 78
3.12 Schematic representation of the major components of an Atomic Force Microscope. 79
4.1 Schematic representation of the pairing of the DNA sequences in (a) f = 4 and
(b) f = 3 nanostars. . . 88
4.2 Right: Representation of f = 3 (top) and f = 4 (bottom) nanostars. Left:
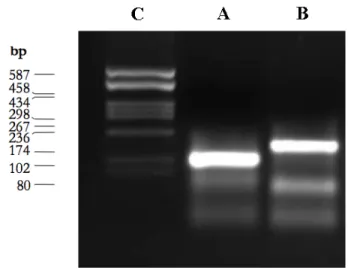
Schematic of the temperature behaviour of the systems. . . 90 4.3 Gel electrophoresis of f = 3 nanostars after running for 20 minutes in agarose gel. 94
4.4 Absorption spectrum at 90°C on a solution of f = 3 nanostars (50 mM NaCl). . 95
4.5 Comparison between spectra at 90°C and 5°C for f = 3 nanostars (50mM NaCl). 96
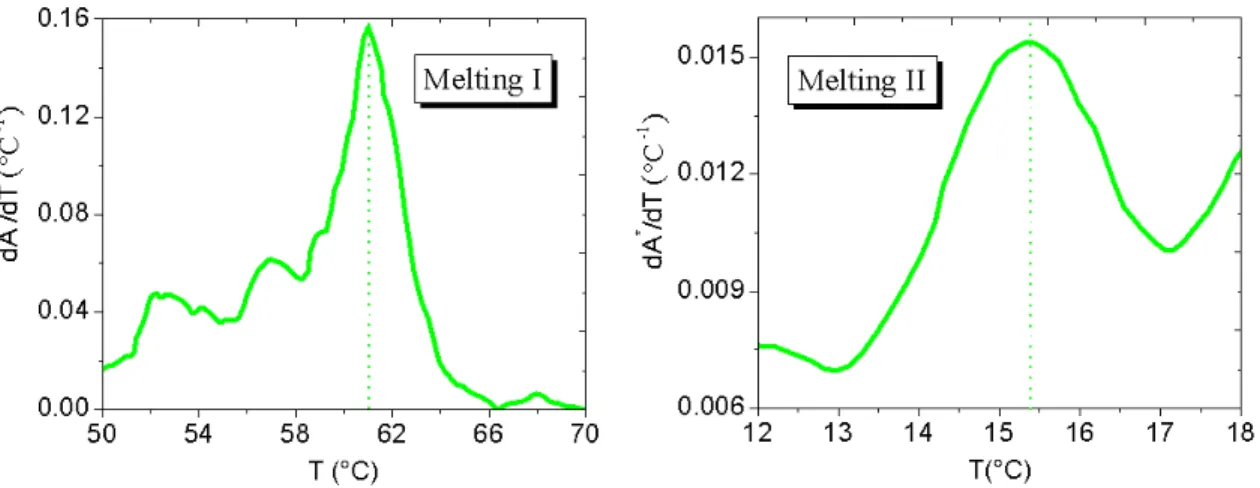
4.6 Cooling profile for a solution off = 3nanostars (NaCl 50 mM). The inset shows the T-interval in which the absorbance remains nearly constant. . . 97 4.7 First derivative of the absorbance signal for both the observed melting processes
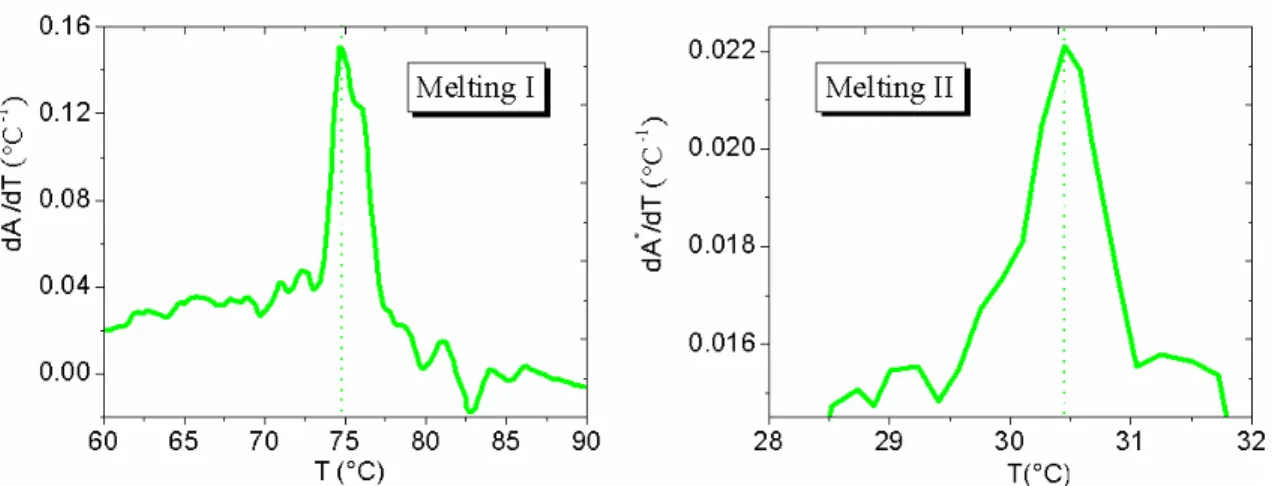
(50 mM NaCl). . . 98 4.8 Cooling profile for a solution of f = 3 nanostars (500 mM NaCl). The inset shows
the T -interval in which the absorbance remains nearly constant. . . 99 4.9 First derivative of the absorbance signal for both the observed melting processes
(500 mM NaCl). . . 99 4.10 Cooling profile for a solution of f = 3 nanostars at different salt concentrations. 100
4.11 Superimposable heating and cooling profiles for f=3 nanostars (150mM NaCl). . 101
4.12 AFM images of isolated DNA nanostars: topography channel (a) and phase
chan-nel (b). The area within the white frame is shown at greater magnification in panel (c). Panel (d) shows the height profile along the white line in the image of panel (c). . . 103 4.13 3D visualization of an isolatedf = 3nanostar. . . 103
4.14 AFM images of isolated DNA nanostars: topography channel (a). The area within
the white frame is shown at greater magnification in panel (b). Panel (c) shows the height profile along the white line in the image of panel (b). . . 104 4.15 3D visualization of an isolatedf = 3 nanostar. . . 104
4.16 AFM images of two bonded DNA nanostars: topography channel (a). The area
within the white frame is shown at greater magnification in panel (b). Panel (c) shows the height profile along the white line in the image of panel (b). . . 105
4.17 3D visualization of two bondedf = 3 nanostars. . . 105
4.18 AFM topographical scan of a sample off = 3nanostars (cDN A= 2.5 mg/ml). . 107
4.19 3D visualization of a sample off = 3 nanostars (cDN A= 2.5 mg/ml). . . 107
4.20 AFM topographical scan of a sample of f = 3 nanostars (cDN A= 9.0 mg/ml). . 108
4.21 Height Distribution associated to the topographical scan of Fig. 4.20. . . 109 4.22 3D visualization of a sample of f = 3 nanostars (cDN A= 9.0 mg/ml). . . 109
5.1 Schematic representation of the relevant thermodynamic and dynamic properties
of network-forming limited-valence systems. . . 112 5.2 Fluorescence microscope visualization of the meniscus (Mag 20x). On cooling, all
investigated samples were found to phase separate into coexisting small droplets, providing evidence of a phase separation process between two phases differing in particle concentration. . . 113 5.3 Experimentally determined consolution curve for nanostars with f = 3 (blue dots)
and f = 4 (red dots) in the temperature - nanostar concentration plane. The inset shows the same consolution curve as a function of the total DNA concentration (mg/ml) of the solutions.. . . 114
List of Figures 5.4 Intensity scattered by solutions of f = 3 nanostars at the critical density.
Measure-ments were performed at different scattering angles. Lines represent the lorentzian fit (Eq. 1). Figure from [114]. . . 116 5.5 Fluctuations of the intensity scattered at 90° by a solution of f = 3 nanostars at
the critical density. Close to the critical point, critical opalescence enhances the fluctuations. . . 117 5.6 Field correlation functions for f = 3 nanostars detected at 90° at the critical
concentration. Measurements were performed at various temperatures: T = 40.4, 30.9, 25.3, 19.8, 18.1, 16.6, 14.7, 13.7, 12.7 °C (symbols). Data are fitted to a single stretched exponential for T =40.4°C and to a sum of two stretched exponentials for the other Ts (lines).. . . 118
5.7 Example of two-step correlation function (dots) for f = 3 nanostars at at the
critical concentration. The black line indicates the double stretched exponential fit (Eq. 5.2) . . . 119 5.8 T-dependence of the decay times. At high T the system exhibits a single decay,
with a decay time indicating a hydrodynamic radius of 4.0 nm, consistent with expectations for independent nanostars. At lower T s a second, slower, decay arises (open symbols). . . 120 5.9 ln(⌧s) plotted as function of 1/T (full symbols) and fitted by an Arrhenius law
(dashed line). . . 121 5.10 T-dependence of the amplitude for the fast and for the slow relaxation process.. 123 5.11 T-dependence of the stretching exponents for the fast and for the slow relaxation
process.. . . 124
6.1 Experimental phase diagram for f = 3 and f = 4 DNA nanostars. The black
dashed line indicates the working DNA concentration (outside the phase boundary for f = 3). . . 126 6.2 T-dependence of the scattering intensities collected at 90° forf = 3 nanostars in
different ionic strength conditions. . . 127 6.3 T-dependence of the scattering intensities collected at 90° forf = 3 nanostars in
different ionic strength conditions. . . 129 6.4 Field correlation functions for f = 3 nanostars (cDN A = 9mgml; 50mM NaCl).
Data are fitted to a sum of two stretched exponentials (lines). . . 130 6.5 Field correlation functions for f = 3 nanostars (cDN A = 9mgml; 70mM NaCl).
Data are fitted to a sum of two stretched exponentials (lines). . . 131 6.6 Field correlation functions for f = 3 nanostars (cDN A = 9mgml; 100 mM NaCl).
Data are fitted to a sum of two stretched exponentials (lines). . . 131 6.7 Field correlation functions for f = 3 nanostars (cDN A = 9mgml; 150mM NaCl).
Data are fitted to a sum of two stretched exponentials (lines). . . 132 6.8 Field correlation functions for f = 3 nanostars, at various salt concentrations,
exhibiting a nearly logarithmic decay. . . 133 6.9 Experimental percolation threshold as a function of the ionic strength. . . 134
6.10 T-dependence of the decay times for the two relaxation processes at various salt concentrations (50, 70, 100, 150 mM NaCl). . . 135 6.11 T-dependence of the stretching exponents associated to the two relaxation
pro-cesses at various salt concentrations (50, 70, 100, 150 mM NaCl). . . 136 6.12 T-dependence of the experimental non-ergodicity factor at various salt
concentra-tions (50, 70, 100, 150 mM NaCl). . . 137
6.13 Field correlation functions for f = 3 nanostars at T ⇠ 30 C, in various salt
concentrations (50, 70, 100, 150 mM NaCl). . . 140
6.14 Field correlation functions for f = 3 nanostars at T ⇠ 20 C, in various salt
concentrations (50, 70, 100, 150 mM NaCl). . . 140
6.15 Field correlation functions for f = 3 nanostars at T ⇠ 13 C, in various salt
concentrations (50, 70, 100, 150 mM NaCl). . . 141
6.16 Field correlation functions for f = 3 nanostars at T ⇠ 10 C, in various salt
concentrations (50, 70, 100, 150 mM NaCl). . . 141 6.17 Field correlation functions for f = 3 nanostars havingfq ⇠ 0.55, at two different
salt concentrations (50, 70 mM NaCl). . . 142 6.18 Field correlation functions for f = 3 nanostars havingfq⇠ 0.65, at three different
salt concentrations (70, 100, 150 mM NaCl). . . 143 6.19 Equilibrium gelation in a sample of f = 3 nanostars (cDN A = 9mgml; 100 mM
NaCl): a) Field correlation functions detected at 90°. b) T -dependence of the scattering intensity detected at 90°. c) T -dependence of fq. . . 144
Introduction
“Begin at the beginning - the King said, very gravely, - and go on till you come to the end: then stop”
Lewis Carrol
"This structure has novel features which are of considerable biological interest". With these words, appeared in a scientific paper on the 25th of April 1953 [1], J.D. Watson and F.H.C. Crick announced to the world the discovery of the structure of DNA, the molecule of life.
Nine years later, in October 1962, they shared the Nobel Prize in Physiology or Medicine with M. Wilkins, for having solved one of the most crucial of all the biological puzzles. More than half a century later, relevant new implications of this outstanding scientific contribution are still emerging.
In particular, the DNA capability to hybridize in a specific and reversible fashion, due the complementarity of the nitrogen bases, well defined by the Watson and Crick pairing rules, has nowadays opened the way to an innovative field of science: structural DNA nanotechnology [2, 3].
The exploitation of DNA for material purposes constitutes a new chapter in the history of the molecule. Indeed, after the pioneering work of Nadrian Seeman in 1982 [4], there has been a progressive shift from the classical vision of DNA as a biological gene-encoding molecule to a much more innovative point of view, regarding DNA as a building block of considerable nanotechnological relevance. In fact, the specific binding between complementary DNA bases, which provides the biochemical groundwork for genetics, can be exploited as a potent molecular recognition system to guide and control the assembly of highly structured materials with precise nanoscale properties.
Moreover, the nanometric dimensions of DNA, with a diameter of around 2 nm, its short structural repeat, with a helical pitch of around 3.5 nm and its very high stiffness, with a persistence length of approximately 50 nm in its double-helical conformation, make it appealing for nanotechnological purposes also from structural standpoints.
For all these reasons, in the last years, there has been an unprecedented development in DNA-based nanotechnology: a rich variety of nanosized objects, such as geometric shapes, hollow capsules and nanomachines, as well as more complex mesoscopic and macroscopic structures with different forms and functionalities has been intelligently assembled via the rational design of specific DNA sequences [5, 6, 7, 8, 9, 10, 11, 12].
Besides the practical implications that these new materials might have, the achievement of such a high level of control on the programmed self-assembly of matter demonstrates the vast horizons opened by the possibility of building with DNA, which appear to be limited only by human imagination.
In this work, following the lines set by structural DNA nanotechnology, we introduce a new and challenging twist: DNA nano-constructs as man-designed particles to experi-mentally explore unconventional phase behaviours conceived so far only in charta and in silico [13, 14, 15].
In our view, DNA can be seen as a powerful tool to explore statistical physics be-cause it enables to produce, via self-assembly, bulk quantities of identical particles with controlled mutual interactions.
As a proof of concept, we focus here on the phase behaviour of limited-valence particles (i.e. colloidal particles with a small controlled number of possible bonding opportuni-ties), a topic which has received a considerable interest in the last few years [16], but which has so far been confined to theoretical and numerical investigations.
These investigations predict that a solution of such particles should exhibit phase coexis-tence, the colloidal analog of the gas-liquid coexistence in simple liquids, thus presenting a critical point, characterized by a critical temperature and a critical density.
The location of the unstable region in the temperature-concentration (T − c) plane is predicted to be significantly affected by the valence, i.e. by the number of bonds that each particle can form.
Specifically, reducing the valence should lower both the critical temperature and the critical concentration, thus shrinking the region in the T − c plane where the system is unstable with respect to concentration fluctuations.
An indirect support to these theoretical predictions comes from recent experiments [17], which have interpreted the irreversible aging dynamics of a synthetic clay, laponite, as an equilibrium gelation process [18] appealing to an effective (although unknown) limited valence of the clay particles.
However, despite such promising findings, the absence of a methodology for creating bulk quantities of particles with reversible interactions and with controlled valence has until now prevented the experimental investigation of the systematic dependence of the coexistence region on the valence.
For these reasons, we decided to exploit the selectivity of DNA binding to simultane-ously realize soft particles as well as to control the inter-particle interactions.
Specifically, we realized star-shaped DNA particles (nanostars) having three or four double-helical arms, each one ending with a sticky single-strand overhang designed on purpose to provide controllable and reversible interactions between individual particles. Therefore, in our view, such DNA nanostars can be considered as limited-valence par-ticles, whose valence f is determined by the number of the arms.
Being the binding between sticky overhangs stronger than the other particle inter-actions (excluded volume, van der Waals, electrostatic), these constructs represent an optimal model for highlighting the role of the valence and closely mimic the investigated theoretical model.
Introduction Besides offering the remarkable possibility of realizing bulk quantities of particles with limited valence, our approach provides a strong control over their mutual interactions, since the cohesion between the sticky terminals can be easily tuned at will by changing the temperature of the system.
The possibility of regulating the valence of the particles together with the chance of finely tuning their interactions in a reversible and controlled fashion by simply aging on the temperature provide the unprecedented opportunity of experimentally investigating novel scenarios, such as equilibrium gelation processes.
Indeed, according to numerical predictions [18], equilibrium gelation is achieved when colloidal systems are able to form stable particle networks through a series of equilibrium states without the interference of phase separation. This can be easily realized when, as in the case of our limited-valence particles, a mechanism for shifting the phase separation (and hence the critical point) to low temperatures and densities is at hand. In this situation, in fact, at low-intermediate densities, almost-ideal gel states may become experimentally accessible through a careful equilibration procedure down to very low temperatures.
Further to the remarkable prospect of exploring the eventual formation of equilibrium gels, an additional important advantage offered by our self-assembling DNA nanostars is given by their subtle sensitivity to the ionic strength. Indeed, it is known that the ionic strength of the medium affects the binding-unbinding equilibrium of the DNA strands, by modifying their bonding free energy.
Therefore, the ability to modulate the binding temperature of the overhangs with salt offers the outstanding chance of directly investigating the role of the lifetime of the sticky bonds on the dynamic behaviour of the systems.
In the specific case of limited-valence nanostars here addressed, such possibility, con-jointly with the ability of tuning the binding selectivity, the strength of interaction and the valence, set the basis to predict the thermal and kinetic stability of self-assembled DNA hydrogels.
From an applicative standpoint, a similar finding has numerous and remarkable impli-cations. For instance, being our self-assembling DNA nanostars non toxic and easily biodegradable, the gelation process could allow materials (such as drugs or proteins) to be encapsulated within the gel matrix, thus providing an innovative and effective route for drug-delivery.
Therefore, besides representing the ideal candidates to experimentally investigate open issues of statistical mechanics, our star-shaped DNA particles can be also exploited for applicative purposes, involving the design and realization of commercial complex fluids with specifically customized properties.
Thesis outline
The main aim of this work is the experimental determination of the phase diagram of solutions of DNA nanostars with limited valence, in order to test the aforementioned theoretical predictions on the phase behaviour of reduced valence systems.
Specifically, in the present thesis, we mainly focus on the behaviour of f = 3 nanostars. Indeed, since the project is carried out in collaboration with the research group of Prof. T. Bellini (Complex Fluids and Molecular Biophysics Lab, Department of Med-ical Biotechnology and Translational Medicine, University of Milan), who started the investigation of f = 4 systems, from the comparative analysis of the experimental re-sults obtained on both systems we can reasonably achieve a comprehensive panorama of the phase behaviour of particles with well-defined and controlled valence.
Moreover, once determined the phase diagram for solutions of f = 3 nanostars, and thus located the region of thermodynamics instability at low temperatures, we also aim at investigating the dynamics of equilibrium gels and its eventual dependence on the ionic strength of the solutions.
In the following we report a detailed scheme of the present dissertation, providing a brief overview on the main topics that we will address in each chapter.
This thesis is divided in three main parts:
• in the first one we depict the theoretical framework encompassing our study; • in the second one we describe the experimental techniques used to investigate the
system;
• in the third one we present the experimental data, providing a comprehensive discussion of the obtained results.
Here is a complete list of the chapters: 1. Limited-valence colloids.
The first chapter introduces colloidal particles, showing how they can be used to mimic the behaviour of atomic systems. Anyhow, the emphasis is on a specific class of colloids, i.e. those characterized by reduced valence, which are the protag-onists of the present study. Moreover, in this chapter, we address the important issue of colloidal gelation, introducing fundamental concepts such as equilibrium gels and empty liquids.
2. DNA nano-constructs.
In the second chapter we describe in details the physicochemical properties of DNA, particularly emphasizing the peculiarities which make it appealing for nan-otechnological purposes. Furthermore, we provide a brief overview on structural DNA nanotechnology, illustrating its basic principles and showing how DNA can be exploited to design and experimentally realize a large variety of all-DNA su-perstructures, ranging from crystals to hydrogels.
Introduction 3. Methods.
Due to the intrinsic complexity of biological soft matter, a systematic investigation of its structure and dynamics usually requires the concomitant use of a large variety of complementary experimental techniques. In the third chapter we thus present the basic principles of the different experimental methods that we used to investigate the system, with a particular emphasis on Dynamic Light Scattering measurements, which represent the large body of our experimental studies. 4. Design and preliminary investigation of DNA nanostars.
Chapter 4 focuses on the preparation and on the first characterization of our f = 3 DNA nanostars, which was done through the use of various experimental techniques, i.e. Gel Electrophoresis, UV absorption and Atomic Force Microscopy. 5. DNA goes critical.
In this chapter, we report the results of the experimental investigation performed to determine the phase diagram for the f = 3 nanostars. Moreover, we also discuss the critical dynamics of such system, which was deeply investigated through a series of Dynamic Light Scattering measurements performed upon cooling the system along the critical isochore.
6. Salt effects on the nanostar dynamics.
In the last chapter, we present a study of the ionic strength effect on the gelation process of f = 3 nanostars. Specifically, we address the issue of whether the ionic strength of the solutions may play an effective role on the rupture of the sticky bonds between different nanostars, thus allowing for the possibility of finely tuning their lifetime. To this aim, we present the results of a systematic light scattering investigation performed on high-density DNA samples.
Part I
Chapter 1
Limited-valence colloids
“No matter what anybody tells you, words and ideas can change the world”
Prof. Keating, Dead Poets Society
Colloidal dispersions are heterogeneous systems in which particles of solid or droplets of liquid with dimensions ranging from nanometers to micrometers are dispersed in a liquid medium.
An interesting class of colloids which has recently captured a lot of interest is the one represented by patchy colloids. From a theoretical standpoint, they can be seen as a general category of particles with strongly anisotropic, highly directional interactions given by short-range attractive spots, patches, located on their surface [19].
The discrete number of patches on the surface defines the valence f of the particles, i.e. the maximum number of nearest neighbours that each particle can bond. Reducing the valence, i.e. limiting the possibility of forming bonds with neighbouring particles, gives rise to unusual collective behaviours in patchy particle systems, which are illustrated in the present chapter.
As a starting point, in the first section we introduce colloidal particles, showing why they can be used as a model to reproduce the behaviour of atomic systems and to understand important mechanisms in soft matter such as phase transitions or dynamical arrest processes. Subsequently, we provide a brief overview on patchy colloids, aimed at introducing their peculiar properties and their potential relevance in the rational self-assembly of predictable and ordered structures.
Moreover, at the end of the first section, we illustrate colloidal gelation, introducing important issues such as equilibrium gels and empty liquids.
Eventually, in the second section, we focus on limited-valence particles addressing the key role played by the functionality of the particles on the phase behaviour of reduced-valence systems.
1.1 Colloidal systems
The term ’colloids’ derives from the Greek words kolla eides (meaning “glue-form” materials) and was introduced in the 19th century by T. Graham to describe a large class of materials consisting of two separate phases: a dispersed phase composed of mesoscopic particles, with characteristic sizes ranging from nanometers to micrometers, and a continuous phase, whose particles have typical atomic length scales.
Colloids are ubiquitous in everyday life since they are involved in many applications of soft materials, spanning from cosmetics to drug delivery systems. Familiar examples of colloidal dispersions include industrial and domestic materials such as inks or foams, food products such as ketchup or ice-cream and biological fluids such as bloodor milk. Due to their massive presence in daily life, their thermodynamic and dynamic properties are currently the focus of numerous investigations in a wide range of research areas, ranging from physics to biology and chemistry.
1.1.1 Colloids as superatoms
In physics, colloids can be used as model system for atoms since many of the forces that dictate the structure and behaviour of matter (e.g. van der Waals interactions, elec-trostatic forces, excluded volume interactions) dictate also the structure and behaviour of colloidal dispersions. Moreover, owing to their large length scales and slow time scales, their behaviour can be easily monitored via table-top experiments, which are able to provide deep insights into processes that are not handily investigable in atomic systems. For instance, the typical length scales of colloidal dispersions are comparable to the wavelength of the light: light-scattering is thus a powerful method for study-ing the structure as well as the dynamics of colloidal systems. Moreover, micron-scale colloids are large enough to be easily observed using optical techniques (e.g. confocal microscopy), thus offering the advantageous possibility of monitoring the individual motion of each particle in the system.
In this respect, colloids can be considered as model “superatoms” and, for such reason, spherically-interacting colloidal particles have been extensively investigated in the last years to enhance the understanding of important mechanisms in soft matter such as gelation, crystallization and glass transition [18, 20, 21].
In addition, the favorable possibility of tuning the interactions between particles makes colloidal systems extremely appealing for exploring unconventional phase behaviours. Indeed, unlike atomic and molecular system where the interactions are fixed by the electronic structure, colloidal interactions can be tuned at will by simply changing macroscopic parameters such as the ionic strength of the medium or the temperature. Consequently, thanks to the unprecedented flexibility in the control of the inter-particle potential, colloidal systems can show a variety of phase diagrams which have no coun-terparts in atomic or molecular systems (e.g. by decreasing the range of the attraction between colloidal particles it becomes possible to suppress the liquid phase, thus induc-ing solid-solid phase transitions [22]).
1.1. Colloidal systems Despite being very complex in nature and number of components, colloidal dispersions can be easily described by using rather simple potentials. Indeed, the solvent and other additive degrees of freedom are quicker than the slow ones of the colloidal par-ticles and they can thus be integrated out. Such eventuality provides the remarkable opportunity of describing the behaviour of colloidal dispersions through simple effec-tive one-component models that take into account solely the colloids (e.g. the DLVO potential [23] or the Asakura–Oosawa model [24]).
For all these reasons, colloidal dispersions may be considered as model systems with desired interactions whose behaviour can be experimentally tested and systematically compared with theory and simulations.
1.1.2 Phase behaviour of spherically-interacting colloids
As mentioned in the previous section, a diversity of interactions between colloidal par-ticles (e.g. van der Waals interactions, electrostatic double-layer forces, depletion in-teractions) may lead to colloids either attracting or repelling each other, giving rise to complex and interesting phase behaviours. Such phase behaviours can be viewed as the analogs of the phase behaviours of matter, with colloids playing the role of atoms. Usually, spherically-interacting particles, in the presence of attractive interactions, un-dergo a gas-liquid phase separation, exhibiting a critical point characterized by a critical temperature Tc and a critical density rc.
In colloidal dispersions, such critical point is metastable, being always located in the region of the temperature-density phase diagram where the thermodynamic stable phase is a crystal.
Below the critical temperature, colloidal solutions separate into two phases differing in particle concentration: one poor in colloidal particles (gas phase) and the other one rich in colloidal particles (liquid phase).
In the liquid phase, particles try to minimize their energy by maximizing the number of nearest neighbouring particles. Anyhow, as the interactions between colloidal particles are typically short-ranged (i.e. the range of the interactions is usually smaller than the particle size), this turns out to be equivalent to maximize the number of contacts. Hence, spherically-interacting particles in solution result encircled by approximately twelve neighbours (such number is dictated by geometrical constraints) and, therefore, the coexisting liquid is a quite dense state.
At sufficiently low temperatures (i.e. for temperature values such that kBT results lower
than the interaction energy strength, where kB indicates the Boltzmann constant) such
dense state shows the typical behaviour of a glass, since all the possible motions of the colloidal particles are significantly hindered by the crowding.
Fig. 1.1 displays a schematic phase diagram for particles interacting with spherical symmetric attractive potentials, showing the field of metastability for the liquid phase, the gas-liquid coexistence region and the glass line.
Figure 1.1: Schematic phase diagram for particles interacting with isotropic potentials. It can be seen that the glass line hits the gas-liquid spinodal at large densities. Figure from [25].
The field of metastability is the region of the temperature-density phase diagram where the equilibrium liquid phase exists for a time sufficiently long to allow for an exper-imental observation. Even when all the crystallization processes can be ignored (e.g. owing to the occurrence of a nucleation barrier longer than the time of the experimen-tal measurement), the field of metastability is still delimited by the glass-line (which prevents the equilibration of the system on the time scale of the measurement) and by the liquid-gas spinodal (which prevents the equilibration of the system in eventual homogeneous structures). As it can be seen, the glass line intersects the gas-liquid spinodal on the liquid side and the phase separation process covers a large region of the phase diagram.
1.1.3 Beyond spherical interactions: from superatoms to
supermolecules
In the previous sections we addressed the issue of how colloidal particles can be used as model systems for atoms, taking into account only spherically-interacting colloids. Anyhow, nowadays, a whole new generation of colloidal particles characterized by a large variety of anisotropic interactions is making its appearance. Indeed, an unprece-dented progress in colloidal synthesis methods is currently providing new strategies to obtain high yield quantities of nano and micro-particles with different shapes, compo-sitions and functionalities, thus offering a well-equipped arsenal for the fabrication of tomorrow ‘supermolecules’ [26, 30].
Innovative classes of colloidal particles with original shapes different from the spherical one (e.g. ellipsoidal, rod-like, cubic, polyhedral) are being conceived and synthesized in large quantities [31, 32].
1.1. Colloidal systems At the same time, new generations of colloids with physically or chemically patterned surfaces are making their appearance [33, 34, 35, 36, 37]. The strategy of patterning the surfaces of colloidal particles with synthetic polymers or biological macromolecules (e.g. complementary DNA strands or proteins) provides valence to colloids, thus giving rise to specific anisotropies in the inter-particle interactions. The selectivity and direction-ality of the built-in interactions are the key elements of these new colloidal particles, which are generally named patchy colloids [19, 30, 33]. The number of patches (i.e. of attractive spots on the particle surface) is always limited and rather low, thus providing a well-defined coordination number of aggregation.
Beside the technological implications, understanding that anisotropic shapes and in-teractions via patchiness represent novel strategies for directing the self-assembly of targeted structures has greatly stimulated the research field, thanks to the outstanding possibility to go beyond spherical interactions and to shift from the colloidal atom to the colloidal molecule analog, by simply providing valence to colloids.
Such opportunity has rapidly catalyzed the research of new physical, chemical and biosynthetic methods for the synthesis of novel anisotropic building blocks. Specifi-cally, as summarized in [35], the developed physical methods include electrified jetting, microcontact printing, emulsion drying, selective deposition, surface templating and lithography. Chemical methods include selective crystallization and deposition. Bio-logically inspired ones include instead the use of plant extracts, fungi and viruses to synthesize nanoparticles of various shapes.
These innovative synthesis strategies have led to the experimental realization of a broad collection of particles with specific anisotropy (Fig. 1.2), which in turn gives rise to a large variety of particles properties due to their anisotropic shapes or patchiness. Each particle class in Fig. 1.2 represents an eventual building block for innovative self-assembled materials which could be reasonably inserted into hierarchical structures and could thus be used in a wide range of applications.
Thanks to the specificity of the built-in interactions, such innovative supermolecules with rationally designed shapes and attractive spots can be used not only to mimic the behaviour of molecular systems on larger scales, but, mostly, to investigate novel and unconventional phase diagrams. In fact, as in the case of spherical colloids where the richness offered by the possibility of modulating the interaction potential has allowed to go beyond the simple reconstruction of the atomic counterparts, the new generation of patchy colloids with different shapes and functionalities incredibly enlarges the range of possibilities. Indeed gelation [18, 21, 38, 39], gas-liquid phase separation [16, 40] and crystallization [41, 42] are greatly influenced by patchiness.
For instance, recent investigations on the phase diagrams of patchy particles have sug-gested that lowering the valence (i.e. the number of patches on the particle surface) has the singular effect of shifting the gas-liquid phase separation to lower temperatures and, more importantly, to lower densities [16].
Figure 1.2: Examples of recently synthesized anisotropic building blocks. Particles are clas-sified in rows by anisotropy type and increase in size from left to right. Figure from [35].
1.1.4 Colloidal gelation
Colloidal gels are arrested states of matter at low density or packing fraction (defined as = ⇡⇢ 3/6, where is the diameter of the particles), i.e. arrested states in which
a negligible fraction of the total volume is occupied by colloidal particles.
Similar to glasses, gels are metastable states out of equilibrium, that may interfere with the underlying stable phases. Since all the thermodynamic functions appear to be continuous upon crossing the arrest boundary, gelation cannot be considered a thermo-dynamic transition. It is rather a kinetic phenomenon as the system gradually slows down, not relaxing to equilibrium any longer.
Time scales are thus fundamental for determining whether a system is arrested or not. Specifically, in colloidal dispersions, one can operatively consider the relaxation time of the system, which can easily measured by Dynamic Light Scattering: if it is of the order of around 100 s it is possible to state that the system has arrested.
Like glasses, gels are disordered solids: indeed, they do not flow, their structural proper-ties do not exhibit a long-range order and their large time scales are typically associated to the absence of long-time diffusion (even though in gels some motions are still allowed on short length scales).
1.1. Colloidal systems Anyhow, unlike glasses, gels are dilute and always driven by attractive interactions. Indeed, because of their peculiar low density, the only possible mechanism to sustain stresses is for these systems to form stable networks of bonded particles: percolation is thus strictly necessary to obtain gels. Anyhow, percolation cannot be considered a sufficient condition since it has to be merged with dynamic information: the network of particles must persist on the time scale of the measurement.
For this reason, a fundamental concept in gelation is represented by the lifetime of the bonds between particles. According to it, it is possible to distinguish between two mechanisms of gelation: i.e. chemical or physical, the former caused by the formation of irreversible bonds between particles (i.e. bonds of infinite lifetime) whereas the latter depending on bonds originating from physical interactions of the order of kBT (i.e. that
reversibly break and form several times during the course of an experiment).
Hence, for chemical gelation, percolation corresponds to gelation, since as the network of bonds forms, it is, by definition, permanent. Therefore, in this case, where bond formation and bond duration are coupled, the percolation concept is strictly connected to the dynamics of the system and percolation theory represents the correct theoretical framework for fully describing the gel transition. In contrast, for physical gels, which are the ones usually formed by colloidal particles, the situation is much more complicated. Indeed, in this case, bondings are transient and clusters of bonded particles dissolve and form continuously. Therefore, percolation theory is only useful to depict the static connectivity properties of colloidal gels.
In the following, we will address the subtle interplay between physical gelation and phase separation as well as equilibrium routes to gelation following Zaccarelli’s work on colloidal gels [18], to which we refer for further insights.
Physical gelation and phase separation
As mentioned above, percolation in physical gels does not coincide with gelation owing to the finite lifetime of the bonds among particles. In general, bonds having long lifetime require large attraction strengths. Anyhow, in all the systems characterized by an hard-core interaction integrated with a spherically symmetric attraction, large attraction strengths, further to increase the bond lifetime, lead to the onset of a gas-liquid like (colloid rich–colloid poor in colloidal systems) phase separation.
Using the Hill’s work on liquid condensation, it is possible to rationalize the propensity of a system to phase separate [43]. Indeed, according to it, the free energy FN of a cluster
of N particles can be written as a sum of a bulk and a surface term, proportional to N and to N2/3 respectively. Thus, it can be seen that F
N/N = fbulk + N 1/3, where
gis proportional to the surface tension and fbulk is the free energy per particle in bulk
conditions. Hence, we can distinguish two cases:
• If g > 0, then FN/N is minimized for N → 1 and hence a condensed liquid phase
is expected.
Figure 1.3: Scheme of the arrested phase separation scenario: a quench into the two-phase region may lead to an arrest of the denser phase. Figure from [18].
Interestingly, at sufficiently low temperatures, where entropic terms can be neglected, the surface tension is proportional to the energy gain of surface particles over bulk particles g / (esurf ace−ebulk), where e represents the energy of a particle in a cluster.
On the basis of these considerations, it is possible to make a fundamental distinction between two different kind of arrest by distinguishing whether the system undergoes gelation with or without the occurrence of phase separation.
If the phase separation boundary is crossed before that the arrest process occurs, the system undergoes liquid condensation. Specifically, the coarsening process promotes the formation of dense areas, which might arrest due to the crossing of the glass bound-ary. Such scenario is known as arrested phase separation [44] and it represents a non-equilibrium route to gelation, since it happens through an irreversible mechanism, i.e. spinodal decomposition. As it can be seen (Fig. 1.3), by performing a quench inside the spinodal in the temperature range Tsp
g < T < TC (where Tgsp represents the
inter-section between the spinodal and the extrapolated glass line) the system undergoes a gas-liquid like phase separation; if the quench is deeper (T < Tsp
g ), the system starts
to undergo liquid condensation. However, with the progress of the coarsening process, locally dense areas could meet the nearby glass transition boundary, thus arresting. Equilibrium approaches to gelation
If phase separation does not intervene (i.e. when the condition < 0 in Hill’s formalism is fulfilled), the system is able to form a stable particle network through a reversible series of equilibrium states. This particular route to gelation is an equilibrium one, since, in this case, the gel state may be approached continuously from a single ergodic phase, by simply allowing an equilibration time for the system to readjust its structure. As previously mentioned, it is possible to adopt an operative definition of gelation
1.1. Colloidal systems
Figure 1.4: Scheme of the stabilization of of an equilibrium cluster phase and gel, through the inhibition of the phase separation region by an enhanced bond lifetime, when additional long-range repulsions are considered. At low T , equilibrium clusters are formed due to the microphase separation. At low T and larger , gelation results as percolation of the long-lived clusters. Figure from [18].
transition by considering the relaxation time of the system. According to it, a gel can only be achieved when the lifetime of the percolating network is larger than 100 s (i.e. the non ergodic behaviour persists for an observation time of 100 s). Rigorously, a true ideal gel transition should only take place when the lifetime of the network becomes infinite. Nevertheless, in the following, we will refer to equilibrium gel states as those reached continuously from the ergodic phase and exhibiting a very long, although not infinite, lifetime, maintaining the ideal gel concept only to those extrapolated states where the lifetime of the network becomes infinite.
In general, for equilibrium gelation, it is possible to discriminate between two diverse topological phase diagrams.
In the first case, the phase separation is moved towards higher attraction strengths [45] and it can be substituted by micro-phase separation. Such a scenario can be realized by effectively increasing the lifetime of the bonds, e.g. by inserting specific stabilizing barriers in the potential with [46] or without [47] a clear microscopic interpretation. Such a modification of the potential opens a window of stability for the equilibrium gel by pushing the phase separation at larger attraction strengths. Specifically, in the low density micro-phase separating region, equilibrium clusters can be found which merge into a percolating network at larger densities. A schematization of such scenario is shown in Fig. 1.4, where the t = 102 s-line indicates the slow dynamics, connecting the
gel and the attractive glass line at higher densities.
In the second case, instead, equilibrium gelation is achieved when a mechanism for moving the phase separation not only to lower temperatures, but most interestingly to lower density values, is available. This can be easily realized by inducing directional
Figure 1.5: Scheme of the shift to lower packing fractions of the coexistence region with the clear insurgence of an equilibrium gel phase, as well as of the ideal gel phase at T = 0. The question mark refers to the unknown details of the crossover from gel-to-glass dynamics. Figure from [18].
interactions between colloidal particles, preferably of low coordination. Indeed, low-ering the average coordination number (i.e. the valence of the particles) is a crucial condition to shift the critical point to lower packing fractions. In this case, ! 0 in the Hill’s formalism since at low temperatures the energy of a particle is the same in the interior and on the surface of each cluster and the driving force for compact aggregation decreases (promoting saturated network structures). Hence, a different topology of the phase diagram is found (Fig. 1.5). As it can be seen, indeed, a wide region of stability of an equilibrium network, to become a gel at sufficiently low temperatures, opens up at low/intermediate densities. Through a careful equilibration procedure down to very low temperature, almost-ideal gel states may become accessible.
Bond lifetime as a tunable parameter
Starting from the existing literature on chemical gelation, several models were gradually developed to describe physical gelation.
The first work in which the idea of finite bond lifetimes was addressed is due to Liu and Pandey [48], who investigated, on a simple cubic lattice, the dynamics of aggregation of functionalized sites in two well-different conditions: irreversible and reversible ag-gregation (reversibility was taken into account by a finite bond breaking probability). Their results indicated a shift of the gel transition as a function of the bond breaking probability, associated with different scaling features and exponents.
Later on, a lattice model was introduced by Del Gado et al. [49, 50] with the specific aim of finding a relation between chemical and colloidal gelation as a function of a tunable bond lifetime. Specifically, they used tetrafunctional monomers with a fraction of randomly quenched bonds to reproduce the irradiation process of a polymer solution
1.1. Colloidal systems that induces chemical bonds. In their model, bonds form with a specific probability and are permanent in the case of chemical gelation, while they can be broken with a finite probability in physical gelation. By defining tB as the lifetime of the bonds, it results
that bonds break with a frequency 1/tB so that a fixed number of bonds must always be
present, thus allowing for the systematic comparison between the dynamics in the case of permanent and transient bonds. Interestingly, they found a power-law decay of the density correlation functions close to percolation for irreversible bonds (in agreement with experiments on chemical gels). On the contrary, by considering instead a finite bond lifetime, they discovered a crossover to a standard glassy dynamics, exhibiting a typical two-step decay.
A revisitation of such study, in terms of an off-lattice model, was later presented by Saika-Voivod et al [51]. Specifically, this last approach simply consisted of a variation of a square-well model with the addition of an infinitesimally thin barrier of arbitrary height uh. To reproduce irreversible bond formation, this model was firstly analyzed in
the case of infinitely high barrier [52, 53].
Advantageously, since the infinitesimally barrier has a zero measure in phase space, the thermodynamic and static properties of the system are effectively the same, either in the presence or in the absence of the barrier. Nevertheless, the dynamics of the system is highly affected by the height of the barrier.
This was demonstrated by studying the wavevector dependence of the density correla-tion funccorrela-tions Fq(t) via Molecular Dynamics (MD) simulations. Indeed, the results of
such investigation suggested that, in the case of infinite barrier height, the percolation transition implies a breaking of ergodicity for the system only at q ! 0, thus confirm-ing that gelation in attractive systems corresponds to the development of a network of infinite connectivity. Beyond the percolation threshold, as the cluster size increases as (p−pc)b, the non-ergodic behaviour is extended even to larger q, until all the particles of
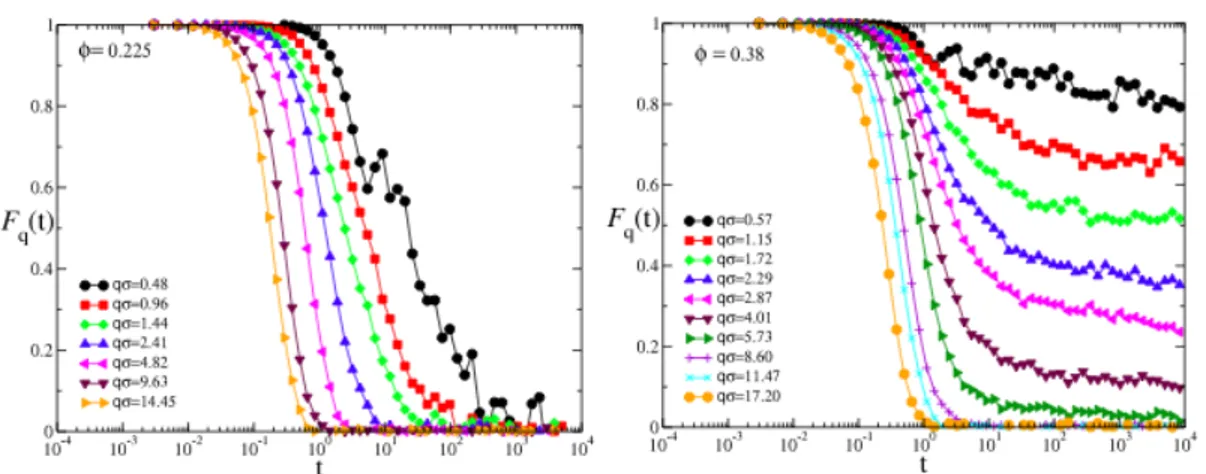
the system become part of the same infinite cluster and the system becomes definitely non-ergodic. Fig. 1.6 shows the behaviour of non-ergodic properties as the packing fraction of the system increases in the case of infinite barrier height. For packing frac-tion lower than the percolating one, all the density correlafrac-tion funcfrac-tions at various wavevectors decay to zero, while for higher packing fraction the insurgence of a plateau can be clearly observed. The height of this plateau, i.e. the non-ergodicity factor fq,
results, at fixed packing fraction, strongly dependent on q. Moreover, by varying the packing fraction above the percolation threshold, one finds that large q-values result ergodic while small ones are not. Starting from the smallest q-value, which becomes ergodic slightly above the percolation threshold, the system further becomes non-ergodic at progressively larger q-values as increases. Left panel of Fig. 1.7 shows the -dependence ofFq(t)at a fixed wavevector. As it can be seen, a non-ergodic behaviour
is evident only well beyond the percolation threshold( p= 0.23). Even the trend of fq
(right panel) with increasing signals the crossover from a low-q signal, revealing the non-ergodic behaviour of the network, to a non-ergodic behaviour at all investigated q. Interestingly, the a-relaxation time (i.e. the final relaxation to zero of the correlation function) at infinite barrier height diverges for each wavevector at a different packing
Figure 1.6: q-dependence of Fq(t)for chemical gelation at two fixed values of : just below
percolation (left) and well within percolation (right). p= 0.23 for this model. Data from [51].
Figure from [18].
fraction, coinciding with the percolation one only at the lowest studied q-values. Upon increasing q, the divergence occurs when first the Fq(t) shows a finite plateau.
There-fore, non-ergodicity is completely dictated by percolation in the case of irreversible bonds. As the bond lifetime is reduced, the system initially follows the percolation regime, as long as tB is longer than a-relaxation time, and subsequently it crosses over
to a glassy dynamics consistently with the model of Del Gado et al [49].
An important result of this work is that, rescaling the time by considering the differ-ent lifetimes of the bonds, all the observed curves superimpose onto a master curve. Such behaviour clearly suggests that tB affects only the microscopic timescale:
there-fore, if enough time is waited to allow bond-breaking processes to occur, the long-time behaviour becomes independent of the microscopic dynamics.
Figure 1.7: -dependence of Fq(t) at the nearest-neighbour peak (left) and of the
1.2. Reduced-Valence Colloids
1.2 Reduced-Valence Colloids
As anticipated in the previous section, an innovative category of patchy particles is that of colloids which, owing to the selectivity of the built-in interaction, have a well-defined and fixed valence [30, 33, 54], well-defined as the maximum number of bonded nearest neighbours. The study of simple models of reduced-valence colloids has recently been the subject of numerous investigations [16, 55, 56, 57], focalizing on both the thermodynamic and dynamic collective behaviour of such systems, as well as their out-of-equilibrium dynamics. In this context, innovative scenarios like the so-called empty liquids and the already mentioned equilibrium gels (which represent the analogy between colloidal gels and network forming liquids) have been suggested and developed. An experimental realization of limited-valence particles is reported in Fig. 1.8.
Figure 1.8: Top: Experimental realization of patchy particles from bidisperse colloids in water droplets. Bottom: Schematic representation of the location of the square-well interaction sites (centers of the small spheres) on the surface of the hardcore particle. Adapted from [18].
1.2.1 Phase Diagram
In Sec. 1.1.2 we have described the phase behaviour of colloidal particles in the pres-ence of isotropic attraction, i.e. when each particle in solution can form bonds with any neighbouring particle within the attractive well, independently of the relative orienta-tions. Specifically, we have showed that, upon lowering the temperature, the system tends to become as dense as possible, thus minimizing its potential energy and creating two separate phases having different densities.
In what follows, instead, we address the situation in which there is a directional attrac-tion between colloidal particles, which can be realized by decorating only small porattrac-tions of the particle surface with attractive patches (i.e. we now focus on the phase behaviour of limited-valence particles).
Indeed, in the last few years, there has been the outstanding scientific finding [16] that if the number of bonds that each particle can form is limited, then the propensity of the colloidal particles to phase separate is strongly suppressed. In particular, it has been
Figure 1.9: Schematic phase diagram for particles interacting with limited-valence potentials. In this case, the shrinking of the gas-liquid coexistence region opens up a window in which an extensively bonded network can form. Figure from [25].
shown that the reduction of the valence f provides an effective mechanism to shrink the gas-liquid coexistence region, thus opening a large window of intermediate densities in which there is no driving force for phase separation, as schematically shown in Fig. 1.9
Such scenario has been demonstrated theoretically (via application of the Wertheim thermodynamic perturbation theory [58, 59]) and via numerical simulations on simple patchy models. Specifically, it has been showed that the width of the liquid-gas coexis-tence region progressively reduces on decreasing the valence[16], gradually disappearing as the average functionality of the particles approaches two (Fig. 1.10). For small va-lence, Wertheim theory is helpful in offering a precise parameter-free depiction of the system in a broad window of densities and temperatures. This observed shrinking of the gas-liquid coexistence region plays a fundamental role on the phase behaviour of such systems since it provides the unprecedented opportunity to reach low temperatures without encountering phase separation (at densities in which packing is not an effective arrest mechanism). Such region of low temperatures (i.e. of long-lived bonds) and of low densities (i.e. where packing is not relevant) cannot be reached in spherical symmetric attractive potentials (Sec. 1.1.2) being usually pre-empted by phase-separation. On the contrary, in the reduced-valence case, even at low-intermediate packing fractions, most of the particles are fully bonded at low temperatures and there is no energetic gain in further increasing the density. Hence, on progressively decreasing the valence, also the critical density decreases. At coexistence, in the liquid side, the number of bonded neighbours is comparable to the valence and thus minor than in the isotropic case [60]. Therefore, the density of the liquid is lower than the one found for the case of spherically-interacting particles.
1.2. Reduced-Valence Colloids
Figure 1.10: Shift of phase coexistence region with the valence f of the particles. For spherical attraction f = 12 from geometrical constraints; when f < 6 a systematic shift of both critical point and coexistence region can be observed. Adapted from [16].
As shown in Fig. 1.10, the shrinking of the region of instability hinges on the average valence per particle. In the limit of average valence approaching two (e.g. for a binary mixture of patchy particles having two and three attractive patches, in the limit of van-ishing concentration of particles with valence three) the coexistence region approaches zero. Therefore, in this limit, a stable homogeneous empty-liquid phase of vanishing density can be reached, in which the system is structurally constituted by long chains of bi-functional particles cross-linked by three-functional ones [25].
1.2.2 Equilibrium Gels
The thermodynamic features that we have discussed in the previous section have sin-gular consequences on dynamics of limited-valence systems. Indeed, as described, the empty liquid region provides the possibility of quenching the system to very low tem-peratures without encountering phase separation. Under these conditions, it becomes possible to approach the equilibrium gel states discussed in Sec. 1.1.4.
Indeed, empty liquids at low temperatures are composed by stable networks of particles which attempt to satisfy all the possible bonds. As a consequence, at a temperature which is rather low but finite, the system is very close to its energetic ground state (i.e. the state in which the maximum number of bonds that each particle can form is fulfilled) and, thus, upon further decreasing the temperature, the structure of system does not change anymore [55]. In this situation, the lifetime of the network is extremely long and regulated by an Arrhenius dependence on temperature, i.e. e(EA/kBT ), where
EArepresents an activation energy. The finite energy of the interaction guarantees that
can instead restructure itself, on a time scale fixed by the bond lifetime, which can be tuned at will externally.
Therefore, from this discussion clearly emerges that reduced valence is an indispens-able condition for creating arrested states at low temperatures which are not driven by packing, as in the case of glassy systems, but by the development of a percolating network of bonded particles which occupies only a small fraction of the sample vol-ume. Indeed, given the low density of the system, crowding cannot be responsible any longer for the slowing down of the dynamics upon cooling: therefore, dynamic arrest in reduced-valence systems is not due to packing but by the formation of an extensive network of particles which provides elasticity to the system.
1.2.3 A first experimental evidence
Despite this extensive theoretical and simulative work, the absence of a methodology for realizing bulk quantities of particles with reversible interactions and with controlled valence has till now prevented the experimental investigation of the systematic depen-dence of the coexistence region on the valence.
Anyhow, a first indirect support to the theoretical predictions about the phase diagram topology of limited-valence particles has recently been provided by a synthetic colloidal clay: laponite.
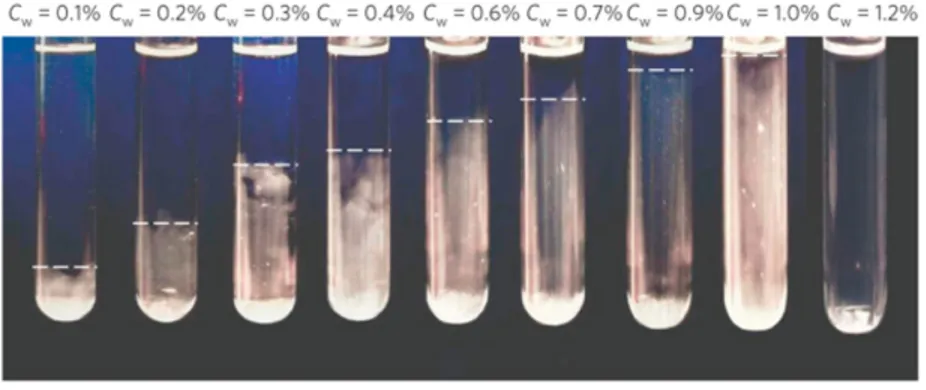
Laponite consists of a suspension of disks with an heterogeneous charge distribution, which behaves effectively as a system with a limited (although unknown) valence. On this system, Ruzcicka et al. [17] have experimentally discovered a low-density phase separation, terminating at a finite but rather low clay concentration (significantly below close-packing). Such phase separation can be clearly observed in Fig. 1.11, which shows several photographs of Laponite samples in the concentration range 0.1 < CW < 1.2 %
for very long waiting times (v30000 h).
Figure 1.11: Photographs of Laponite samples in the concentration range 0.1 < CW < 1.2 %
1.2. Reduced-Valence Colloids
Figure 1.12: Evolution of the SAXS measured structure factor with waiting time for Cw = 0.8 % (located inside the phase separation region) and for Cw = 1.2% (located outside the phase separation region). The curve are measured at increasing waiting time: from the bottom to the top tw = 500, 900, 1600, 2700, 3400, 4700, 6000, 8700, 11000 h). Figure from [17].
As it can be seen, all samples with Cw < 1.0 % display two coexisting phases, separated by an interface whose height progressively increases with the clay concentration. Above this phase transition, they found a stable gel: SAXS measurements of its struc-ture confirmed that the system was in a stationary state consistent with equilibrium gels (Fig. 1.12).
Specifically, they investigated the behaviour of the static structure factor after a quench (used to reproduce the irreversible aging process occurring in laponite dispersions) both outside and inside the phase boundary, finding a totally different behaviour for the two samples at sufficiently long waiting times. Indeed, while the intensity scattered at small scattering angles increases continuously inside the phase separation region, it saturates to a constant value in the empty liquid one.
Such behaviour clearly suggests that the lifetimes of the bonds between particles in the system are so large that the empty liquid is arrested, thus forming an equilibrium gel. Indeed, as expected by the predictions, once the system has reached its final equilibrium configuration, where all possible bonds are fulfilled, its structure (and, hence, in turn the scattering intensity) does not change anymore.
To strengthen such results, they also performed computer simulations for a simply model of patchy disks with low valence, finding agreement with the experiments. The phase diagram numerically obtained is reported in Fig. 1.13.
As it can be seen, it clearly indicates the phase coexistence region, the empty liquid and the equilibrium gel regions. The topology of this phase diagram is thus consistent with the one predicted for limited-valence colloids, thus providing the first experimental confirmation of the empty liquid scenario.
Anyhow, in spite of this important result, a conclusive evidence, proving the dependence of the critical parameters on the particle valence is still lacking.
Figure 1.13: Phase diagram in the ⇢⇤ T⇤ plane, where ⇢⇤ is the number density scaled by
the close-packing density and T⇤ is the thermal energy scaled by the bond strength. Figure