SCUOLA DOTTORALE IN SCIENZE MATEMATICHE E FISICHE DOTTORATO DI RICERCA IN FISICA
XXIV CICLO
The cosmic ray spectrum measured
by the ARGO–YBJ experiment in the
1–1000 TeV energy range.
Paolo Montini
Coordinatore:
Prof. Guido Altarelli Prof. Orlando Ragnisco
Docente Guida: Prof. Stefano Maria Mari
Contents
Introduction 1
1 Spectrum and composition of cosmic rays 5
1.1 Energy Spectrum . . . 6
1.2 Composition . . . 7
1.3 Production and acceleration . . . 9
1.4 Recent observations . . . 11
1.5 Open questions . . . 11
1.5.1 Proton and helium spectra . . . 11
1.5.2 The origin of the knee . . . 13
1.6 The role of the ARGO–YBJ experiment . . . 14
2 The ARGO-YBJ experiment 17 2.1 Overview . . . 17
2.2 The ARGO-YBJ detector layout . . . 18
2.2.1 Resistive Plate Chambers . . . 19
2.3 Trigger Logic . . . 21
2.4 Observation techniques . . . 22
2.4.1 Shower mode . . . 22
2.4.2 Scaler mode . . . 23
2.5 Detector monitoring and data quality . . . 25
2.6 Event reconstruction . . . 27 I
3 ARGO-YBJ detector performance 29
3.1 Digital readout system . . . 30
3.2 Analog readout system . . . 31
3.3 Detector calibration . . . 33
3.3.1 Software timing calibration . . . 33
3.3.2 Charge readout calibration . . . 36
3.4 Performance of the data taking . . . 38
4 Energy spectrum deconvolution methods 41 4.1 Bayesian inference and bayesian unfolding . . . 42
4.1.1 Unfolding a sample of data . . . 44
4.2 Unfolding of the cosmic ray spectrum . . . 46
4.2.1 Unfolding of the cosmic ray spectrum by using the bayesian method . . . 47
4.2.2 Application of the bayesian unfolding method to the ARGO–YBJ data . . . 48
5 The cosmic ray spectrum 51 5.1 The Monte Carlo data sample . . . 51
5.2 The light component spectrum of cosmic rays in the multi-TeV region. . . 52
5.2.1 Data selection . . . 52
5.2.2 The unfolding procedure . . . 55
5.2.3 Evaluation of systematical uncertainties . . . 57
5.2.4 The light component spectrum in the energy range 5− 250 TeV. . . 58
5.3 The cosmic ray spectrum at higher energies . . . 60
5.3.1 Study of the chemical composition . . . 61
5.3.2 Effective particle density distribution . . . 61
5.3.3 Composition sensitive parameters . . . 63
5.3.4 Light/heavy component discrimination . . . 65
5.4 The all–particle spectrum in the energy range 200− 800 TeV . 65 5.4.1 Data analysis . . . 66
5.4.2 Evaluation of the uncertainties . . . 66
5.4.3 The all–particle spectrum . . . 67
5.5 Discussion . . . 68
Conclusions 71
Bibliography 75
Introduction
The cosmic rays spectrum spans a huge energy interval up to 1020eV or
more. Since the discovery of the cosmic radiation in 1912, many experimen-tal efforts have been devoted to the study of cosmic ray properties. The study of the energy spectrum and mass composition in the energy range 1− 10000 TeV has been an active field for many years, with various methods and techniques applied. The study of the properties of Cosmic Rays offers an unique opportunity to investigate several non–thermal phenomena, ob-taining information about the early evolution of the Universe. Due to the extreme variability of the flux intensity two broad classes of experimental techniques have been developed: direct and indirect measurements. Direct measurements can access only the low energy region because of the restricted dimension and the limited exposure of the detector. Otherwise they can di-rectly measure the energy and the composition of the cosmic radiation. The indirect technique based on the measurement of the extensive air showers with surface arrays allows the detection of events produced by primaries with energy up to 1020eV. This technique relies on Monte Carlo simulations
in order to unfold the relevant information about the primary particle from the collected data sample. Unfortunately, despite a great experimental ef-fort and a huge amount of data collected, several questions concerning the acceleration and propagation mechanisms, the origin of the knee and the composition at the knee are still under discussion and investigation. In the energy region (1÷100) TeV, in particular, direct measurements of the cosmic ray flux made with emulsion chamber experiments (RUNJOB and JACEE)
2 Introduction show large discrepancies and uncertainties. Recent measurements made by new generation balloon–borne experiment (CREAM) show that the proton and helium spectra in the range (2÷ 250) TeV are harder than in the low energy region. The CREAM data, however, present large uncertainties at the highest energies. Since proton and helium nuclei are the bulk of cosmic ray particles at energies below the knee (∼ 3. × 1015eV) the study of the
spectrum at these energies is of primary importance. A better understand-ing of these topics can be obtained by extendunderstand-ing the indirect measurements in the low energy region covered by balloons or satellite. The study of the composition around the knee plays an important role in the understanding of the origin of the knee itself. Since the direct measurements cannot be performed at energies E > 100 TeV the composition at the knee must be studied by extensive air shower experiments. Showers produced by different primaries present several differences that are covered by large variations of the primary energy, uncertainties in the hadronic interaction models and by shower fluctuations. A detailed measurement of the lateral particle density distribution can be used in order to discriminate showers induced by different primaries.
The ARGO–YBJ experiment is a full–coverage extensive air shower array operating at the Yangbajing international cosmic ray observatory in Tibet (P.R. China) at about 4300 m. The detector is a full–coverage array of RPC chambers covering an area of about 104m2 and providing a high resolution
image of the shower front. Due to its characteristics (full–coverage, high al-titude, high segmentation) the ARGO–YBJ experiment can detect extensive air showers with a low energy threshold. The detector was designed and built in order to explore the cosmic ray spectrum in the energy range (1÷104) TeV
and is able to overlap the direct measurements in a wide energy range below 100 TeV, an energy region not accessible by other EAS experiments. The ARGO–YBJ observable is the multiplicity of the shower, namely the space time distribution of the charged particles in the shower front. Due to shower fluctuations the energy distribution of the primary cosmic rays cannot be related to the observed multiplicity distribution and must be evaluated by means of an unfolding procedure. This is a classical unfolding problem that can be dealt with the bayesian technique.
In this work the measurement of the cosmic ray spectrum in the energy range (1÷ 103) TeV is presented by using a bayesian approach. In the first chapter
Introduction 3
are summarized and the open questions are discussed. In chapter 2 and 3 the characteristics and performances of the ARGO–YBJ detector are de-scribed. In chapter 4 the bayesian unfolding method, used in this analysis, is described. Chapter 5 is devoted to the data analysis and the results.
CHAPTER
1
Spectrum and composition of cosmic rays
The primary cosmic radiation is made of particles reaching the Earth’s at-mosphere from outside the Solar System. They are essentially composed by protons, helium nuclei, a small fraction of heavier nuclei, electrons and pho-tons. Although already discovered in 1912, cosmic rays sources and propaga-tion mechanisms are still subject of intense research. Understanding cosmic rays origin and propagation through the interstellar medium is a fundamen-tal problem which has several implications on models of the structure of the universe. During the last decades several progresses have been made and the picture of cosmic rays observations is now evolving. One of the difficulties related to the study of the cosmic rays properties is that cosmic rays are essentially composed by charged particles that are being scattered by the galactic magnetic field. During the propagation in the interstellar medium cosmic rays lose their original direction and the flux at Earth is essentially isotropic. The only observable quantities which can give us some informa-tions are the energy distribution and the elemental composition of primary cosmic rays. At highest energies, above 1018eV there is a chance of locating
emission sources by searching for anisotropies. The observation techniques can be grouped into two broad classes: direct and indirect measurements. At energies below 1014eV the flux of cosmic rays is sufficiently large that the
in-dividual nuclei can be studied with flying detectors like balloon or satellites. Direct measurements with satellite or balloon–borne detectors can determine
6 Spectrum and composition of cosmic rays
the energy and the mass of the primary particle only in the low energy region (up to a few hundreds of TeVs) due to the strong decrease of the cosmic ray flux. From this kind of experiments we know that the majority of particles are nuclei of elements from hydrogen to iron. Magnetic spectrometers can provide information about the cosmic ray flux and composition at very low energies. Ground based experiments are characterized by a long exposure time and a large collecting area. These features are needed to investigate the rapidly decreasing cosmic ray flux with increasing energy. These kind of experiments, however, cannot identify the mass of the primary particle that produced the shower. In the high energy region we rely only on observations extensive air showers (EAS) providing indirect information about the energy and the mass of cosmic rays particles. The information needed is inferred from the particle cascades initiated by the interaction of cosmic rays in the Earth’s atmosphere. This technique requires a very good knowledge of the EAS development in the atmosphere and of the interaction mechanisms of high energy particles with air. Monte Carlo simulations are used as reference patterns. Despite the large amount of data collected by air shower exper-iments the determination of the spectrum and of the composition presents several open questions.
1.1
Energy Spectrum
The all–particle spectrum is the energy spectrum of all primary cosmic rays and does not take into account the charge or the mass, so it comprises all the species of elements and all of isotopes. This spectrum spans a very wide energy range from less than 1 GeV up to 1011GeV. Apart from particles
pro-duced during solar flares the primary cosmic rays come from outside the solar system. At very low energies the flux of galactic cosmic rays is modulated by the solar activity. There’s a significant anticorrelation between solar activity (T ∼ 11 yr) and the intensity of the flux at energies below 10 GeV. The flux of low energy particles decreases during periods of high solar activity and reaches the maximum during the low activity phase. The flux at very low energies is also influenced by the Earth’s magnetic field and the intensity of the cosmic radiation in the GeV range depends on the time and the loca-tion. Above the energies of 10 GeV, where the flux is no longer influenced by Earth’s magnetic field modulated by solar activity, the cosmic ray spec-trum is well described by a power law dN/dE ∝ E−γ. As can be inferred
Composition 7
from figure 1.1 there is a prominent change of the spectral index at ener-gies around 1015eV, generally referred as the knee [1]. At energies around
1018eV another change of the spectral index occurs, known as the ankle,
and the spectrum becomes harder again. Values of the spectral index are γ ≈ 2.7 below E ≈ 4 · 1015eV, above this energy the spectral index changes
to γ ≈ 3.1. Many experiments have performed and published measurements of the cosmic ray spectrum in the knee region and up to the highest energies, as reported in figure 1.1. The individual measurements are in agreement and shows a change of the spectral index at E ≈ 4 · 1015eV. The origin
of the knee is still an unresolved question in cosmic rays research. Nearly the totally of the cosmic rays particles is thought to be of galactic origin. The ankle can be interpreted as a transition between the galactic and extra– galactic component. At the far end of the spectrum, above∼ 5 · 1019eV, the
cosmic ray flux is expected to be strongly suppressed due to the interaction with the cosmic microwave background (CMB). This feature is known as Greisen–Zatsepin–Kuzmin (GZK) cutoff [2, 3]. Since heavier nuclei are de-stroyed by photo–disintegration the flux at the highest energies is expected to be dominated by protons. Protons lose energy while propagating through the CMB field: the most important energy loss mechanism is the pion photo production with an energy threshold of about 6· 1019eV. The suppression
of the flux above this energy was observed by the HiRes [4] and Auger [5] experiments. Above the GZK cutoff energy cosmic rays cannot travel more than∼ 20 Mpc and the observation of a possible extension of the cosmic ray spectrum would indicated a local origin for these particles.
1.2
Composition
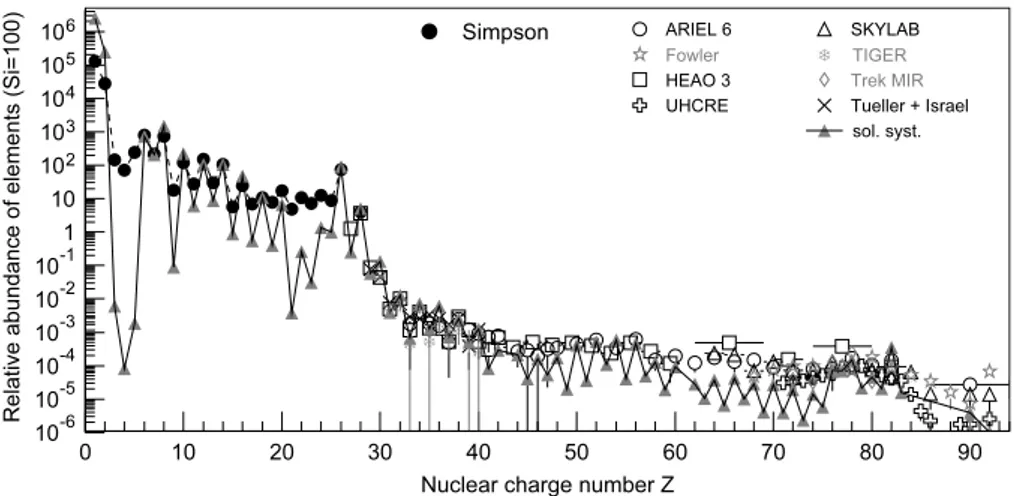
All the elements of the periodic table have been found in cosmic rays. For ele-ments lighter than nickel the individual energy spectrum has been measured. The relative abundance is shown in figure 1.2, compared with the abundance of elements in the solar system. The two distributions look very similar, however there are some differences that reveal information about the accel-eration and the propagation of cosmic rays. Lighter elements like lithium, beryllium and boron are more abundant in cosmic rays rather than in the solar system. Since these nuclei are not present in the final products of stel-lar nucleosynthesis, they are assumed to be produced in spallation processes of the more abundant carbon, nitrogen, oxygen and iron nuclei during their
8 Spectrum and composition of cosmic rays
308 J. Blümer et al. / Progress in Particle and Nuclear Physics 63 (2009) 293–338
Fig. 7. All-particle cosmic-ray energy spectrum as obtained by direct measurements above the atmosphere by the ATIC [219,220], PROTON [221], and RUNJOB [222] as well as results from air shower experiments. Shown are Tibet AS⌃ results obtained with SIBYLL 2.1 [223], KASCADE data (interpreted
with two hadronic interaction models) [224], preliminary KASCADE-Grande results [225], and Akeno data [226,33]. The measurements at high energy are represented by HiRes-MIA [227,228], HiRes I and II [229], and Auger [169].
Fig. 8. All-particle energy spectra in the knee region. Results from direct measurements by Grigorov et al. [221], JACEE [230], RUNJOB [222], and SOKOL [231] as well as from the air shower experiments Akeno 1 km2[226], BASJE-MAS [232], BLANCA [173], CASA-MIA [163], DICE [182], EAS-TOP [233], GAMMA
[234], GRAPES-3 [235], HEGRA [174], KASCADE electrons and muons interpreted with two hadronic interaction models [224], hadrons [236], and a neural network analysis combining different shower components [237], KASCADE-Grande (prelinimary) [238], MSU [239], Mt. Norikura [240], Tibet AS⌃[241]
and AS⌃-III [223], as well as Tunka-25 [176].
3.1. Galactic cosmic rays
Many groups have published results on the all–particle energy spectrum from indirect measurements in the knee region ( 1015 eV). The spectra obtained are compiled inFig. 8. The ordinate has been multiplied by E2.5
0 . The individual measurements agree within a factor of two in the flux values and a similar shape can be recognized for all experiments with a knee at energies of about 4 PeV. Also shown are results for the all-particle flux as obtained by direct observations
Figure 1.1: All-particle spectrum of cosmic rays measured with direct detectors
and air shower experiments For a better visualization of the knee the flux was
multiplied by E2.5. See [6] for references.
journey through the Galaxy. The cosmic rays accelerated in their sources propagate towards the Earth through the interstellar medium. Heavier nu-clei can interact with the ISM and fragment into lighter elements. For this reason they are usually called secondary cosmic rays. The cosmic rays as they are observed near Earth consist therefore in a mixture of a primary and a secondary component. Since the spallation cross section is known at GeV energies from the accelerator data, the ratio between secondary and primary cosmic rays can be used as an estimator of the propagation path length and of the residence time of cosmic rays in the Galaxy. Also the measurements of the isotopic composition can provide information about the cosmic ray transport in the galaxy. As an example the measure of the boron to carbon ratio as a function of energy can be used to estimate the propagation path length. Recent measurements of the B/C ratio have been performed by the TRACER experiment [7]. The PAMELA collaboration has also presented
Production and acceleration 9
the measurements of the fluxes of boron and carbon [8]. Usually lighter el-ements (p, He) are referred as the light component, while the heavier ones (CNO, NeMgSi, Fe) are referred as the heavy component.
296 J. Blümer et al. / Progress in Particle and Nuclear Physics 63 (2009) 293–338
Fig. 1. All-particle energy spectrum of cosmic rays as measured directly with detectors above the atmosphere and with air shower detectors. At low
energies, the flux of primary protons is shown.
Fig. 2. Abundance of elements in cosmic rays as a function of their nuclear charge number Z at energies around 1 GeV/n, normalized to Si=100 [40]. Abundance for nuclei with Z≤28 according to [41]. Heavy nuclei as measured by ARIEL 6 [42,43], HEAO 3 [44], SKYLAB [45], TIGER [46], TREK/MIR [47,
48], as well as UHCRE [49]. In addition, the abundance of elements in the solar system is shown according to [50].
decreases as a function of energy, which is frequently explained in Leaky Box models by a rigidity-dependent2decrease of
the path length of cosmic rays in the GalaxyΛ(R)=Λ0(R/R0)−δ. Typical values areΛ0≈10–15 g/cm2,δ≈0.5−0.6, and
R0≈4 GV as reference rigidity.
Cosmic-ray particles are assumed to propagate in a diffusive process through the Galaxy, being deflected many times
by the randomly oriented magnetic fields (B∼ 3µG). The nuclei are not confined to the galactic disc, they propagate in
the galactic halo as well. The scale height of the halo has been estimated with measurements of the10Be/9Be-ratio by the
ISOMAX detector [52] to be a few kpc. The abundance of radioactive nuclei in cosmic rays measured with the CRIS instrument
yields a residence time in the Galaxy of about 15×106years for particles with GeV energies [53].
2 Rigidity is defined as particle momentum divided by its charge R[V] =p/z.
Figure 1.2: Relative abundance of elements found in cosmic rays as a function
of the nuclear charge Z (referred to Silicon). The abundance of elements in the solar system is also shown.
1.3
Production and acceleration
After almost 100 years from the first observation of the cosmic radiation, the origin of cosmic rays is not yet fully known. Since the abundance of elements in cosmic rays is very similar to the abundance of elements in the solar system it indicates that cosmic rays are regular matter accelerated to very high energies. The bulk of cosmic rays is assumed to be accelerated in the shock waves of supernova remnants. This feature was discovered by Baade and Zwicky [9] in 1934. Supernova remnants were proposed as cosmic rays sources due to energy balance considerations [10]. The power necessary to produce the galactic cosmic rays can be estimated as
LCR =
vDρE
τr ' 5 · 10
40erg/s (1.1)
where vD is the volume of the galactic disk, τr is the residence time in the
disk and ρE is the energy density of cosmic rays (about 1 eV/cm3).
10 Spectrum and composition of cosmic rays
explosion it results evident that the shock waves of supernova remnants can be one of the possible acceleration site for galactic cosmic rays. The accel-eration mechanism has remained unclear until Fermi proposed a model of acceleration which involves the interaction of particles in galactic magnetic field [11]. This lead to the so–called first order Fermi mechanism in which the responsible for the acceleration of cosmic ray is the shock front produced in a supernova explosion. At present it is believed that cosmic rays are acceler-ated in a process called diffusive shock acceleration (DSA) [12, 13]. The basic idea is that a charged particle can gain an amount of energy ∆E∝ E every time the particle passes from the upstream unshocked region to the down-stream shocked region and back. At each passage between the updown-stream and downstream region there is a probability that the particle can escape the shock and propagate through the Galaxy. This process leads naturally to a power law spectrum like N (E) ∝ E−γ. The highest energy particles are
those that have remained longer in the shock region. After a time T the maximum energy can be written as
Emax ∼ Zeβs· B · T Vs (1.2)
in which βs = Vs/c is the velocity of the shock. This leads to an upper limit
assuming that the minimum diffusion length is equal to the Larmor radius of a particle of charge Ze in a magnetic field B. Using typical values for supernovae Emax ≈ Z × 1014eV [14]. More recent estimates give a value
for the maximum energy up to one order of magnitude larger [15]. Highest energies can be reached by introducing the reaction of accelerated particles onto the accelerator. Cosmic rays generate the magnetic structure in which they are scattered, therefore the acceleration time can be reduced and the maximum energy can reach larger values. Evidences of particle acceleration in supernova remnants come from the observations of non–thermal radio, X–ray and gamma–ray radiation. The observation of non–thermal X–rays in young SNRs indicates the presence of electrons in the 10÷ 100 TeV energy range that emit synchrotron radiation [16]. From the data of the H.E.S.S. experiment it is established that there are high energy cosmic ray particles in the shell of a supernova remnant. The measured γ–ray energies imply the efficient acceleration of particles up to energies greater than 100 TeV, moreover the spectral index of the observed radiation is compatible with the predictions of shock acceleration in SNRs [17]. The flux of cosmic rays is nearly isotropic up to the highest energies. The isotropy is due to the
Recent observations 11
interaction with the cosmic rays with the galactic magnetic field. Since the Larmor radius of a 1 PeV proton in the galactic magnetic field (B ≈ 3µG) is about 0.4 pc there’s no possibility to find any point sources of galactic cosmic rays. The current paradigm for the cosmic ray acceleration is based on a continuous distribution of sources that leads to a simple power–law spectrum for all the elements. A variation from the simple power law spectrum could indicate a non–uniform distribution of sources. For energy above the knee there are no obvious candidates, although several objects like Gamma Ray Bursts or active galactic nuclei can be listed as possible sources.
1.4
Recent observations
Many experimental efforts have been devoted to the study of the cosmic ray properties. The indirect measurements in the region of the hundreds of TeVs show an overall agreement within a factor of two [18], while the direct measurements have to cope with the systematic uncertainties due to analysis of data taken during different flights. Direct measurements have provided a measurement of the flux at energies up to∼ 1011eV/nucleon. In figure 1.3 the
measurement of the proton and helium spectra performed by several balloon– borne experiments is reported. At higher energies the measurements made by the balloon–borne emulsion chambers RUNJOB [19, 20] and JACEE [21] show large discrepancies and uncertainties. A New generation balloon–borne active experiments can perform longer flight and increase higher statistics at the highest energies. Recent more precise measurements of the cosmic ray flux have been carried out by the balloon-borne CREAM experiment [22, 23] during a long duration flight. These measurements show that the proton and helium spectra in the range (2.5÷250) TeV are both flatter than in the lower energy measurements.
1.5
Open questions
1.5.1
Proton and helium spectra
Despite the large amount of data collected by several experiments there are several open questions concerning the energy spectrum and the composition of cosmic rays. The evolution of the proton and helium spectra can be an
12 Spectrum and composition of cosmic rays
The Astrophysical Journal, 728:122 (8pp), 2011 February 20 Yoon et al.
)
-1
Energy (GeV nucleon
10 102 103 104 105 106 1.75 ) -1 ( G eV n uc le on -1 s s r) 2 (m 2.75 E× Flux 2 10 3 10 4 10 5 10 p He
Figure 3. CREAM proton and helium differential F lux·E2.75in GeV nucleon−1
at the top of the atmosphere. The CREAM proton and helium spectra (filled circles) are shown together with previous measurements: BESS (squares), CAPRICE98 (downward triangles), AMS (open circles), ATIC-2 (diamonds), JACEE (stars), and RUNJOB (crosses). The lines represent power-law fits with spectral indices of −2.66 ± 0.02 for protons and −2.58 ± 0.02 for helium nuclei, respectively.
The proton to helium ratio as a function of energy provides
insight into whether the proton and helium spectra have the
same spectral index. This has long been a tantalizing question,
mainly because of the limited energy range individual
experi-ments could cover. The ratio from the first CREAM flight
pro-vides a much needed higher energy, low-statistical uncertainty,
measurement. The ratio is compared with previous
measure-ments in Figure
4
: ATIC-2, CAPRICE94 (Boezio et al.
1999
),
CAPRICE98, JACEE (Asakimori et al.
1993b
), LEAP (Seo et al.
1991
), and RUNJOB. The CREAM ratios are consistent with
JACEE where its measurement energy range overlaps. The
mea-sured CREAM ratio at the top of the atmosphere is on average
9.1 ± 0.5 for the range from 2.5 TeV nucleon
−1to 63 TeV
nucleon
−1, which is significantly lower than the ratio of ∼20
obtained from the lower-energy measurements.
5. DISCUSSION AND CONCLUSION
The energy spectra of primary cosmic rays are known with
good precision up to energies around 10
11eV, where magnetic
spectrometers have been able to carry out such measurements.
Above this energy the composition and energy spectra are not
accurately known, although there have been some pioneering
measurements (M¨uller et al.
1991
; Asakimori et al.
1998
;
Apanasenko et al.
2001
). The collecting power of CREAM
is about a factor of two larger than that of ATIC for protons
and helium nuclei and, considering the much larger geometry
factor of the TRD, about a factor of 10 larger for heavier nuclei.
TRACER has a larger geometry factor than CREAM, but a
smaller dynamic charge range (Z = 8–26) was reported for its
10 day Antarctic flight. Although its dynamic charge range was
improved to Z = 3–26 for its ∼4 day flight from Sweden to
Canada in 2006, it is still insensitive to protons and helium
nuclei.
The CREAM payload maintained a high altitude,
correspond-ing to an atmospheric overburden of 3.9 g cm
−2for vertically
incident particles. That implies about 6.8 g cm
−2at the
maxi-mum acceptance angle for this analysis, which is the smallest
)
-1
Energy (GeV nucleon
1 10 102 103 104 105 106 p/He Ratio 0 5 10 15 20 25 30 35 40
Figure 4. Ratio of protons to helium nuclei as a function of energy in
GeV nucleon−1. The CREAM (filled circles) ratio of proton to helium is
compared with previous measurements: ATIC-2 (diamonds), CAPRICE94 (upward triangles), CAPRICE98 (downward triangles), LEAP (open circles), JACEE (stars), and RUNJOB (crosses).
among comparable experiments. For example, the average
ver-tical depth for RUNJOB was more than twice that of CREAM,
due to its low flight altitude. Considering the RUNJOB
accep-tance of particles at large zenith angles, its effective atmospheric
depth was as large as 50 g cm
−2. For that depth, large corrections
are required to account for the fact that 41% of protons would
have interacted before reaching the detector.
The CREAM calorimeter is much deeper than either that of
JACEE or RUNJOB, so it provides better energy measurements.
CREAM also has excellent charge resolution, sufficient to
clearly identify individual nuclei, whereas JACEE and RUNJOB
reported elemental groups. Our observation did not confirm a
softer spectrum of protons above 2 TeV reported by Grigorov
et al. (
1970
) or a bend around 40 TeV (Asakimori et al.
1993a
). An increase in the flux of helium relative to protons
could be interpreted as evidence for two different types of
sources for protons and helium nuclei as proposed by Biermann
(
1993
). The observed harder spectra compared to prior
low-energy measurements may require a significant modification
of conventional acceleration and propagation models, with
significant impact for the interpretation of other experimental
observations.
The CREAM experiment was planned for Ultra Long
Du-ration Balloon (ULDB) flights lasting about 100 days with
super-pressure balloons. While waiting for development of
these exceptionally long flights, the CREAM instrument has
flown five times on LDB flights in Antarctica. It should be
noted that a 7 million cubic foot (∼0.2 million cubic meters)
super-pressure balloon was flown successfully for 54 days
dur-ing the 2008–2009 austral summer season. As ULDB flights
become available for large science payloads, long-duration
ex-posures can be achieved faster and more efficiently with reduced
payload refurbishment and launch efforts. Whatever the flight
duration, data from each flight reduces the statistical
uncertain-ties and extends the reach of measurements to energies higher
than previously possible.
This work was supported in the U.S. by NASA grants
NNX07AN54H,
NNX08AC11G,
NNX08AC15G,
NNX08AC16G, and their predecessor grants, in Italy by INFN,
and in Korea by the Creative Research Initiatives of MEST/
NRF. The authors wish to acknowledge NASA/WFF for
7
Figure 1.3: Measurements of the proton and helium spectra at the top of the
atmosphere from data of several baloon-borne experiment. Results from CREAM [23] (filled circles) , BESS (squares), CAPRICE98 [24] (downward triangles), ATIC–2 [25] (diamonds), AMS [26] (open circles), RUNJOB (crosses) and JACEE (stars) are reported.
indication of different population of cosmic ray sources or acceleration sites. According to the DSA theory the spectral index does not depend on the mass of the elements. A possible explanation the difference between proton and helium spectra is that protons and helium nuclei are coming from different sources or acceleration sites. Since a single class of sources cannot provide different spectral indexes for different masses, at least two kind of sources are needed [27]. Each class of sources can produce a power law spectrum with its specific spectral index and maximum energy, therefore the galactic cosmic rays are essentially a mixture of particles accelerated by different sources. In many models [28, 29] the responsible for the acceleration of cosmic rays up to the knee are the explosions of normal supernovae directly into the interstellar medium and the explosion of massive stars into their former stellar wind, like
Open questions 13
Wolf–Rayet stars. If elements heavier than hydrogen are accelerated in the latter sources their spectra would be harder than the spectrum of protons. The explosion of normal supernovae into a homogeneous stellar medium leads to the acceleration of protons up to ∼ 105GeV. The spectral hardening
can be connected also to the anisotropy of cosmic rays at energies around 10 TeV observed by the Milagro experiment, which observed two regions of excess with high significance [30]. These two regions are inconsistent with pure gamma–ray emission. Moreover the energy spectrum of one of these two regions is different from the spectrum of the isotropic cosmic rays and can be described as a harder proton spectrum with a cutoff. The same regions have been observed also by the ARGO–YBJ experiment [31]. Another possible explanation is that most massive stars are born in association and they explode as supernovae near their parent molecular clouds. The effect of supernova explosions in a small region of the Galaxy is the formation of large bubbles (superbubbles) of very hot material. Superbubbles are one of the greatest injector of energy in the Galaxy. Most massive stars are in dense clusters called OB associations, each containing several hundreds of stars. OB associations have been proposed as a candidate source of galactic cosmic rays due to energy balance considerations [32]. This hypothesis is also supported by the observation of the isotopic abundance of heavy nuclei [33]. These sources can produce different power–law spectrum for protons and helium nuclei because in the stellar wind and in supernova explosion the hydrogen has a lower density and a higher velocity rather than helium, therefore the fraction of helium nuclei in the center of the superbubble is higher than in the outer region [34]. The energy spectrum at the source can also be harder than previous hypothesis based on the low–energy data. The hardening can be related to the predicted concavity of the spectrum before the knee region [35]. In diffusive shock acceleration the accelerated particles can amplify the magnetic field close to the shock surface. As a consequence higher energy particles can gain energy faster. This feature could lead to a hardening of the spectrum as the energy increases and deviations from a single power law [36].
1.5.2
The origin of the knee
Despite the great experimental and phenomenological effort made to investi-gate the knee region, the origin of the knee is still an unresolved question in
14 Spectrum and composition of cosmic rays
cosmic ray physics. Several hypotheses about the origin of the knee have been formulated [37]. Some hypotheses are related to the acceleration mechanisms and the knee is due to the fact that the spectrum at the sources exhibits a break. A special case is the single source model in which the structures in the knee region are due to a single SNR from a near recent explosion [38]. An-other possible explanation is that the knee is due to propagation effects. As the energy increases the probability that a cosmic ray particle could escape the galactic region increases. The Larmor radius of a proton in the galactic magnetic field
rL= 1.08pc
E/ PeV Z· B/µG
can become greater than the size of the galactic disk as the energy increases. Above a certain energy the cosmic rays are not more confined into the Galaxy. Other models state that the origin of the knee can be related to the interac-tion of high energy protons with massive neutrinos or the photodisintegrainterac-tion in dense photon field. Experimental observations rule out these models with a high confidence level. The origin of the knee can also be related to new physics in the elementary particle interactions in the atmosphere. A certain amount of the total energy may be transferred into non observed channels. Actually the measurements indicate that the knee is probably due to a de-crease of the flux of light elements. If the knee is due to a break in the source spectrum or to the leakage of high energy particles from the Galaxy, the energy spectra of elements of charge Z should exhibit a cutoff at energy EZ
c = Z· Ecp, where Ecp is the cutoff energy for protons. The knee in the all–
particle spectrum is due to the cutoff of protons and the spectrum at highest energies becomes steeper due to the cutoff of elements with increasing atomic number. In order to solve the knee “puzzle”a detailed measurement of the energy spectrum of the single component or of the light and heavy group is needed.
1.6
The role of the ARGO–YBJ experiment
In order to understand the behavior of the spectrum at TeV energies an to investigate the composition at the knee an EAS experiment able to cover a wide energy range is needed. The ARGO–YBJ experiment, described in chapter 2, is a full–coverage array which is in full and stable data taking at the Yangbajing International Cosmic Ray Observatory. The full–coverage
The role of the ARGO–YBJ experiment 15
technique and the high space granularity allow the measurement the distribu-tion of the charged particles in the shower front with unprecedented detail, leading to the possibility of a detailed study of the characteristics of the showers. The ARGO–YBJ data can be used to investigate the shower space time structure in order to obtain information about the processes that reg-ulate the development of the shower in the atmosphere. Exotic phenomena like multicore events can also be investigated. The detector is characterized by a low energy threshold and high duty cycle. The high altitude allows the detection of very small size showers before they are completely absorbed in the atmosphere. Due to these characteristics a very wide energy range below 100 TeV can be explored, overlapping the direct measurements. Moreover the detector can provide a high space–time resolution image of the front of showers produced by cosmic rays with energies up to 104TeV, allowing the
measurements of the energy spectrum and composition up to the knee region. The position of the maximum of a shower produced by a primary with en-ergy in the knee region occurs at the atmospheric depth of the ARGO–YBJ experimental site, therefore it’s possible to investigate the characteristics of showers in the knee region with very high detail.
CHAPTER
2
The ARGO-YBJ experiment
The ARGO-YBJ experiment (Astrophysical Radiation with Ground-based Observatory at YangBaJing) is a full coverage air shower detector designed and optimized for the detection of cosmic rays with an energy threshold of a few hundreds GeV. The detector consists of a single layer of resistive plate chambers (RPCs) covering an area of about 104m2 and providing a high
resolution image of atmospheric showers initiated by primaries of energies up to 103TeV. The shower array is able to monitor the northern emisphere in
the declination range−10◦ < δ < 70◦ with high duty cycle. The experiment
has been designed to cover a wide range of issues in γ-ray astronomy and in cosmic rays physics.
2.1
Overview
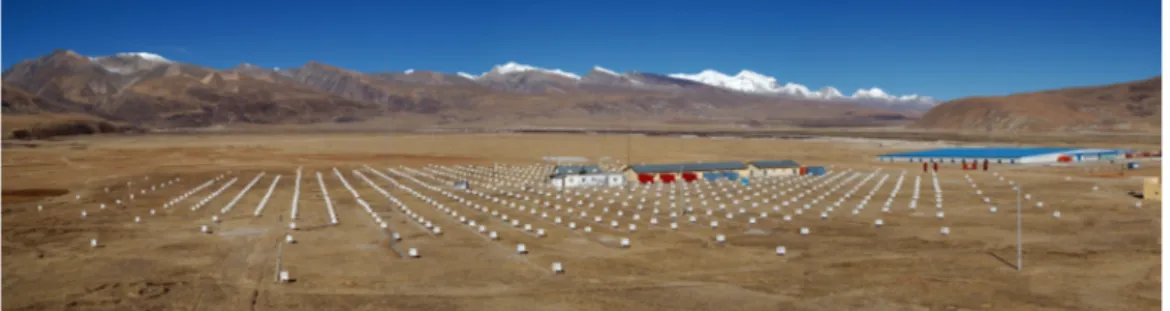
The Argo-YBJ experiment [39, 40, 41] was designed and developed for the detection of extensive air showers produced by cosmic rays interacting with Earth’s atmosphere. The detector is located in the Yangbajing International Cosmic Ray Observatory in the Tibet region (P. R. China) at an altitude of about 4300 m a.s.l. (see figure 2.2). The site chosen for the experiment is located in the village of Yangbajing (latitude [30◦6003800N ], longitude
[90◦3105000E]), about 90 km far from Lhasa.
18 The ARGO-YBJ experiment
Figure 2.1: Landscape of the Tibet plateau and of the Yangbajing International
Cosmic Ray Observatory.
The experiment has been designed to cover a wide range of physical issues both in γ-ray astronomy and in cosmic ray physics, among which are: - γ -ray astronomy at a threshold of a few hundreds GeV
- Primary cosmic ray spectrum and composition in the (1÷ 10000) TeV en-ergy range
- γ-ray burst at energies above 100 GeV
- Proton and anti-proton ratio at TeV energies - Solar and heliosphere physics
- Extensive air shower properties.
The experiment was designed to operate in two independent acquisition modes characterized by different energy threshold. This feature was de-signed in order to extend the range of physical phenomena accessible by the detector.
2.2
The ARGO-YBJ detector layout
The ARGO-YBJ detector consist on a single layer of 1836 resistive plate chambers [40] (RPCs) covering an area of about 6700 m2. The RPCs are
arranged in a central full coverage carpet of about 5700 m2 surrounded by an
external ring (∼ 1000 m2) partially instrumented with additional 276 RPCs
The ARGO-YBJ detector layout 19
Figure 2.2: Satellite view of the ARGO-YBJ experiment and the Yangbajing
village.
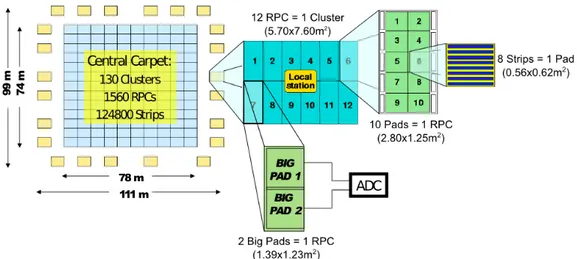
external ring also improves the angular resolution of the whole detector. The detector layout is shown in figure 2.3. The detector has a modular structure, the basic module is a cluster (5.72 × 7.64 m2) consisting in 12
RPCs (2.850× 1.254 m2) each. Each RPC is read–out by 80 copper strips
(61.8×6.75 cm2) logically arranged in 10 pads (55.6×61.8 cm2). Each RPC is
also equipped with two large size electrodes called big pads (1.23× 1.39 m2).
The whole carpet is made of 153 clusters, 130 on the central full coverage carpet and 23 on the guard ring. The full coverage carpet has an active area of about 93%. All the environmental and detector parameters like atmospheric pressure, external air temperature, humidity, high voltage and current drawn by each RPC are continuously monitored.
2.2.1
Resistive Plate Chambers
Resistive Plate Phambers (RPCs) are gas detectors able to detect the passage of a charged particle by ionization and multiplication processes that occur in the gas mixture inside the chambers. The RPCs are frequently used in high energy physics experiments thanks to a high detection efficiency (∼ 98%) and relatively low production cost. The use of RPCs in a surface set-up allows many practical advantages like easy mounting without mechanical support, robust assembling and easy access to any part of the detector. The RPCs are low noise detector usually operated for triggering and tracking purposes,
20 The ARGO-YBJ experiment
2.3 L’apparato sperimentale 27
Figura 2.2: Schema del rivelatore ARGO e delle unit`a in cui `e suddiviso. Il rivelatore
`e costituito da 130 cluster nella parte centrale e 23 nell’anello esterno per un totale di 1836 camere RPC. Ogni cluster `e formato da 12 camere RPC, a loro volta suddivise in 10 pad da 8 strip ciascuna.
2.3.1
Le camere RPC
Le camere RPC sono largamente utilizzate negli esperimenti di fisica delle alte energie poich´e sono rivelatori in grado di garantire prestazioni molto elevate, con un’efficienza di rivelazione pari a circa il 98% e una risoluzione temporale dell’or-dine di 1 ns, ad un costo di produzione relativamente modesto. Gli RPC sono dei rivelatori a gas in grado di rivelare il passaggio di particelle cariche mediante processi di ionizzazione e moltiplicazione a cascata nella miscela di gas contenuta al loro interno.
Il principio di funzionamento alla base di questo tipo di rivelatori `e il processo di ionizzazione. Quando una particella carica attraversa la miscela di gas, interagi-sce con le molecole del mezzo attraverso un certo numero di processi di natura
Figure 2.3: Layout of the ARGO-YBJ detector.
however the layout of the chambers built for the ARGO-YBJ experiment has been optimized for the detection of EAS secondaries. Each chamber consists on two Bakelite foils, a polymer with a resistivity ρ∼ 5 · 1011Ω cm,
assembled to form a gas gap 2 mm wide. A grid of plastic cylindrical spacers (10 cm pitch) is used in order to maintain the gas volume plane and flat. A schematic layout of a RPC is reported in figure 2.4. In order to have a homogeneous distribution of the high voltage to the Bakelite electrodes, a layer of conductive material (graphite) is laid on the electrode surface. The choice of a high-resistivity material for the electrodes is related to the need of decreasing the dead time of the detector. In this way the signal formation on the electrodes is a localized phenomena and the regions of the chamber which are not interested in the ionization process remain sensitive.
The RPCs used in the ARGO-YBJ experiment are operated in streamer mode at a voltage of about 7400 V with a gas mixture of Tetrafluoroethane R134A, Isobutane and Argon in the proportion 75:10:15%. Argon is the active component of the gas mixture while the other two components are needed to quench the discharge by absorbing the ultraviolet photons and secondary electrons emitted in recombination processes. The signal is picked up inductively by using a strip panel consisting on a copper foil 17 µm thick cut into 80 strips (6.75× 61.80 cm2 each) glued on a 0.2 mm thick film of
plastic material (PET). The time resolution of the order of ∼ 1ns and the high space–time granularity allow the sampling of the shower front with
Trigger Logic 21 Rigid panel Strip panel Gas volume PET foil 3mm foam Big pad Rigid panel
Figure 2.4: Schematic cross–section of a resistive plate chamber used in the
ARGO-YBJ experiment
unprecedented detail. In order to extend the measurable energy range each RPC is equipped with two large size electrodes (1.23×1.39 m2) which provide
a signal whose amplitude is expected to be proportional to the number of charged particles detected. The characteristics of the two readout system will be described in the next chapter.
2.3
Trigger Logic
The ARGO-YBJ experiment was designed to study a wide range of phe-nomena both in γ–ray astronomy and in cosmic ray physics. The observ-able quantity of the apparatus is the space–time distribution of the charged particles in the shower front. Each shower is therefore characterized by a particular space–time distribution of fired strips on the detector. In order to discriminate events different both by nature and energy a trigger system has to be implemented. The trigger system must distinguish between showers produced by primaries of a few GeV, which are expected to produce only a few hits on the detector surface, and showers with thousands of hits on the detector. The trigger system of the ARGO-YBJ detector is based on three subsystems: Low Multiplicity Trigger (LMT), High Multiplicity Trig-ger (HMT) and Fast TrigTrig-ger (FT) [42]. All these trigTrig-ger algorithms select an event on the basis of the time distribution of the fired pads and their mul-tiplicity on the carpet. The low mulmul-tiplicity trigger is based on a four level
22 The ARGO-YBJ experiment
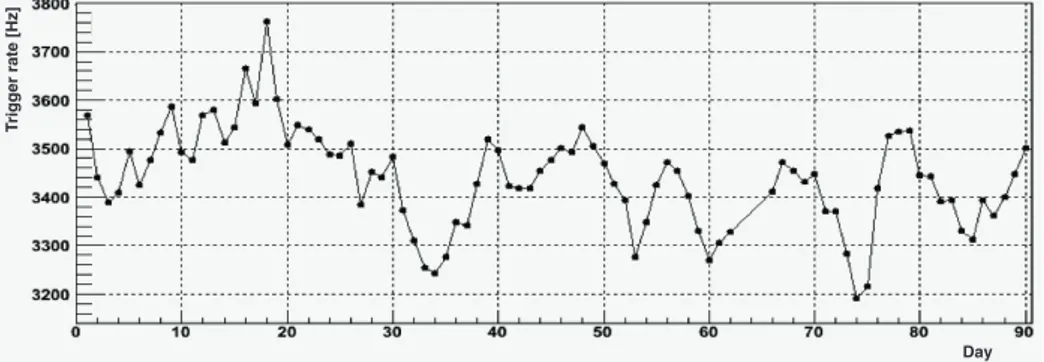
hierarchic architecture. The first level, called Level–0, analyzes the multiplic-ity in groups of four contiguous clusters in a time window of about 150 ns. The second level (Level–1) processes the signals coming from Level–0 and search for a coincidence in groups of 12 clusters in a time window of 200 ns. The third level (Level–2) and the fourth level (Level–3) search for a coinci-dence in 65 clusters in 360 ns and in 130 clusters in 400 ns respectively. The threshold for the LM trigger is set to 20 pads, corresponding to a maximum event rate of about 3.5 kHz (see figure 2.5) with a dead time less than 4%.
Day
Trigger rate [Hz]
Figure 2.5: Values of the trigger rate for each day of the period January–March
2011.
2.4
Observation techniques
The ARGO–YBJ detector was designed to operate in two independent oper-ation modes: the shower mode and the scaler mode.
2.4.1
Shower mode
The shower mode is based on the requirements that a minimum number of pads must be fired in the central carpet with a defined space–time pattern. For these events the position and time of any fired pads is recorded in order to reconstruct the shower parameters like the core position, the shower size and the arrival direction. For each fired pad the time and the mask of the fired strips within the pad are recorded. Data recorded in shower mode will be used in γ–ray astronomy and in cosmic ray physics. Moreover due to the low energy threshold, the high angular resolution and the high detector
Observation techniques 23
stability the ARGO–YBJ experiment can measure the antiproton/proton flux ratio via the observation of the Moon shadowing effect [43]. The results of the analysis based on the data collected during the period between July 2006 and December 2009 are reported in figure 2.6. Data taken since november 2007
AUTHOR
et al.
PAPER SHORT TITLE2. the MC Moon shadow has been split into a “matter”
part plus an “antiproton” part, again so that the total
amount of triggered events remains unchanged:
Φ
M C(mat)
−→ Φ
M C(r; mat + ¯
p) =
= (1
− r)Φ
M C(mat) + Φ
M C(¯
p)
3. for each antiproton to matter ratio, the expected
Moon shadow R.A. projection Φ
M C(r; mat + ¯
p) is
compared with the experimental one via the
calcula-tion of the likelihood funccalcula-tion:
log
L(r) =
B
!
i=1
N
iln[E
i(r)]
− E
i(r)
− ln(N
i!)
where N
iis the number of experimental events
in-cluded within the i-th bin, while E
i(r) is the
num-ber of events expected within the same bin, which
is calculated by adding the contribution expected
from MC (Φ
M C(r; mat + ¯
p)) to the measured
back-ground.
Both methods described above give results consistent
within 10%. The r parameter which best fits the
expec-tations to the data turns out to be always negative, i.e. it
assumes non-physical values throughout the whole energy
range investigated. With a direct comparison of the R.A.
projections, the r-values which maximize the likelihood
are: -0.076
±0.040 and -0.144±0.085 for 40≤N<100 and
N
≥100, respectively. The corresponding upper limits with
90% confidence level (c.l.), according to the unified
Feld-man & Cousins approach [15], are 0.034 and 0.041,
respec-tively. Since the anti-shadow was assumed to be the mirror
image of the proton shadow, we assume for the
antipro-tons the same median energy. The ¯
p/p ratio is Φ(¯
p)/Φ(p)
= 1/f
p· Φ(¯p)/Φ(matter), therefore, being the assumed
proton fraction f
p=73% for 40
≤N<100 and f
p=71% for
N
≥100 [12], we obtain the following upper limits at 90%
c.l.: 0.05 for 40
≤N<100 and 0.06 for N≥100. Notice that
the two values are similar, in spite of the different
multi-plicity interval. It is a consequence of the combination of
the two opposing effects of the angular resolution and of
the geomagnetic deviation.
In Fig. 4 the ARGO-YBJ results are shown with all the
available measurements. The solid curves refer to a
theoret-ical predictions for a pure secondary production of
antipro-tons during the CR propagation in the Galaxy by Donato
et al. [7]. The curves was obtained using the appropriate
solar modulation parameter for the PAMELA data taking
period [5]. The long-dashed lines refer to a model of
pri-mary ¯
p production by antistars [8]. The rigidity-dependent
confinement of CRs in the Galaxy is assumed
∝ R
−δ, and
the two curves represent the cases of δ = 0.6, 0.7. The
dot-dashed line refers to the contribution of ¯
p from the
annihi-lation of a heavy dark matter particle [6]. The short-dashed
line shows the calculation by Blasi and Serpico [16] for
secondary antiprotons including an additional ¯
p component
produced and accelerated at CR sources.
energy (GeV) -1 10 1 10 102 103 104 105 /p ratio p -6 10 -5 10 -4 10 -3 10 -2 10 -1 10 Golden 79 BSP 81 Golden 84 Stephens 85 Bogomolov 87-90 LEAP 90 PBAR 90 MASS 91 IMAX 95 BESS 95-97 Caprice 97 CAPRICE 98 HEAT 01 L3+ 03 MACRO 05 Tibet-ASγ 07 PAMELA 10 ARGO-YBJ 10 - 90% c.l.
Figure 4: The ¯
p/p flux ratio obtained with the ARGO-YBJ
experiment compared with all the available measurements
and some theoretical predictions (see text).
6
Conclusions
The ARGO-YBJ experiment is observing the Moon
shadow with high statistical significance at an energy
threshold of a few hundred GeV. Using all data collected
until November 2009, we set two upper limits on the ¯
p/p
flux ratio: 5% at an energy of 1.4 TeV and 6% at 5 TeV
with a confidence level of 90%. In the few-TeV range the
ARGO-YBJ results are the lowest available, useful to
con-strain models for antiproton production in antimatter
do-mains.
References
[1] F.W. Stecker,
in ”Matter-Antimatter
Asymme-try” ed. L. Iconomidou-Fayard & J. Tran Thanh
Van (Hanoi:The Gioi) pp. 5-14 (2003) (preprint
arXiv:hep-ph/0207323v1)
[2] F.W. Stecker and Wolfendale A.W., Nature 309
(1984) 37.
[3] M.Yu. Khlopov et al., Phys. Rev. D62 (2000) 083505.
[4] A.W. Strong et al., Annu. Rev. Nucl. Part. Sci. 57
(2007) 285.
[5] O. Adriani et al., Phys. Rev. Lett. 105 (2010) 121101.
[6] M. Cirelli et al., Nucl. Phys. B813 (2009) 1.
[7] F. Donato et al., Phys. Rev. Lett. 102 (2009) 071301.
[8] S.A. Stephen and R.L. Golden, Space Sci. Rev. 46
(1987) 31.
[9] G. Aielli et al., NIM A562 (2006) 92.
[10] G. Di Sciascio and R. Iuppa, NIM A630, 301 (2011).
[11] D. Heck et al., Report FZKA 6019 (1998).
[12] J.R. Horandel, Astrop. Phys 19 193, 2003.
[13] Y.Q. Guo et al.,Chinese Phys. C34 (2010) 555.
[14] G. Aielli et al., ApJ, 714 L208, 2010.
[15] G. Feldman and R. Cousins, Phys. Rev. D57 (1998)
3873.
[16] P. Blasi and P.D. Serpico Phys. Rev. Lett. 103 (2009)
081103.
Figure 2.6: The ¯p/p flux measured by the ARGO–YBJ experiment compared
with the results of other experiments.
have been analyzed in order to look for a few–degree anisotropies in the arrival directions of primary cosmic rays. Several regions with significant eccess of events have been found, with a maximum energy of about 10 TeV [31]. In figure 2.7 the ARGO–YBJ sky map is reported, showing the significance of the observations.
2.4.2
Scaler mode
The lower energy limit of the detector (≈ 1 GeV) is reached by using the scaler mode technique, in which the total counting rates of each cluster are recorded at fixed time (500 ms) with no information on the arrival direction and spatial distribution [44]. The counts from different pads of the same cluster are put in coincidence in narrow time window of 150 ns. Four low multiplicity channels are implemented for event multiplicities from > 1 to > 4 with a mean measured counting rates of about ≈ 40 kHz, ≈ 2 kHz,
24 The ARGO-YBJ experiment
Figure 2.7: ARGO–YBJ sky map in celestial coordinates showing the significance
of the observations.
≈ 300 Hz and ≈ 120 Hz respectively. The main component of the DAQ system is composed of a series of scaler boards. Each board can manage signals coming from 19 clusters and is connected to a master GPS clock in order to receive a 10 MHz reference frequency. The counting rate of each cluster and multiplicity channel is recorded in a fixed an programmable time interval (i.e. 500 ms). Since The cosmic ray spectrum decreases very steeply as the energy increases, most of the events detected with this operation mode are related to particles coming from small air showers produced by primaries in the 1− 100 GeV energy range. The number of particles is too small to reconstruct the shower parameters and is not possible to evaluate the energy or the direction of the primaries. However it is possible to monitor the counting rate of each cluster as a function of time in search of any possible variation that can be related to cosmic phenomena like Gamma Ray Bursts. The search for a GRB signal has been carried out in coincidence of the prompt emission detected by satellites. In the period between December 2004 and April 2011 131 GRBs occurred in the ARGO–YBJ field of view. For 110 of these the search of a high energy emission was performed, showing no statistically significant signal [45]. In figure 2.8 the fluence upper limits in the 1− 100 GeV energy range as a function of the zenith angle are reported. The data taken in scaler mode can also be used to monitor the overall detector stability.
Detector monitoring and data quality 25
32NDINTERNATIONALCOSMICRAYCONFERENCE, BEIJING2011
Zenith angle (deg)
0 10 20 30 40 50
)
2
Fluence uppper limit (erg/cm
-6 10 -5 10 -4 10 -3 10 -2 10
Figure 2: Fluence upper limits as a function of the zenith angle in the 1-100 GeV range, obtained extrapolating the measured keV-MeV spectra. Triangles represent GRBs with measured redshift, circles GRBs assumed at z=1.
law spectrum and by considering the maximum number of counts at 99% confidence level (c.l.), following equation (6) in [9]. For this calculation, two different assumptions are used for the power law spectrum: a) extrapolation of the keV-MeV spectrum measured by the satellite experi-ments, when available; b) a differential spectral index α = -2.5. Since the mean value of spectral indexes measured by EGRET in the GeV energy region is α = -2.0 [10], we ex-pect that the true upper limits lie between these two values. For GRBs with measured redshift, an exponential cutoff in the spectrum is considered to take into account the effect of extragalactic absorption, which is calculated using the values given in [11]. When the redshift is not measured, a value z = 1 is adopted. For the subset of 82 GRBs with spectral index α measured by satellites, the fluence upper limits have been calculated according to assumption a) and they are shown in figure 2 as a function of the zenith angle. For the subset of 18 GRBs with measured redshift, the flu-ence upper limits for the two assumed spectra are shown in figure 3. Since the measured low energy differential spectral indexes for these GRBs are always greater than -2.5, the higher upper limits refer to this extrapolation. For 3 GRBs the measured low energy spectrum is a cutoff power law, thus only the value obtained assuming α=-2.5 is shown. For the other GRBs the rectangles indicate the upper limit range corresponding to differential spectral in-dexes between the fixed value α=-2.5 and the low energy measurement. For GRB090902B the resulting upper limit range can be compared with observations by the LAT in-strument on the Fermi satellite (circle in figure 3).
When using as the GRB spectrum the extrapolation of the index measured by satellite experiments, an upper limit to
GRB Redshift (z)
0 2 4 6
)
2
Fluence uppper limit (erg/cm
-5 10 -4 10 -3 10 -2 10
Figure 3: Fluence upper limits of GRBs as a function of redshift. The rectangles represent the values obtained with differential spectral indexes ranging from α=-2.5 to the satellite measurement. The 3 arrows give the upper lim-its for the former case only (for GRBs with cutoff power law spectrum). The circle shows the integral fluence in the 1-100 GeV range for GRB090902B as observed by LAT.
the cutoff energy can be determined at least for some GRBs exploiting the ARGO−YBJ scaler mode data, with the fol-lowing procedure. The extrapolated fluence is plotted to-gether with the fluence upper limit as a function of the cut-off energy Ecut. If the two curves cross in the 2-100 GeV
energy range, the intersection gives the upper limit to the cutoff energy. For these GRBs we can state, with a 99% c.l., that their spectra do not extend beyond this value of Ecut, if the slope remains constant. Figure 4 shows the
re-sulting cutoff energy upper limits as a function of the spec-tral index for the 19 GRBs with critical intersection in the quoted energy range. For 4 of these (triangles in figure 4) the measurement of the redshift allows the estimation of the extragalactic absorption. When the GRB redshift is not available, the value z=1 is adopted.
3.2 Stacked analysis
The search for cumulative effects by stacking all the GRBs either in fixed time durations or in phases of ∆t90could
en-hance a possible signal, making it statistically significant, even if the emission of each GRB is below the sensitiv-ity of the ARGO−YBJ detector. In this case, less infor-mation could be given compared to the single GRB coin-cident detection, however we must consider that with the stacked analysis we increase the sensitivity by increasing the number of GRBs, while with the single GRB search we decrease the sensitivity because of the increasing number
Figure 2.8: Fluence upper limits in the 1− 100 GeV energy range as a function
of the zenith angle obtained by extrapolating the measured keV− MeV spectra.
Triangles represents GRBs with measured redshift, circles GRBs assumed at z = 1.
2.5
Detector monitoring and data quality
The ARGO–YBJ experiment produces a large amount of data. One of the major problem is to have fast and efficient tools to check the quality of the data and to select them for analysis purposes. The ARGO–YBJ experiment collects about 200 TB of data each year. A series of detector monitoring and data quality check tools has been implemented by the collaboration. The first step consists in the online monitoring of the detector operation. The detector control system (DCS) has been designed to monitor the following quantities:
- gap currents for each RPC, voltage of the RPC front–end electronics and receiver board, the local temperature and the barometric pressure in the experimental hall
- the applied voltage and the absorption current in each high–voltage channel - the gas pressure.
In figure 2.9a and 2.9b the daily trends for pressure and temperature are re-ported. These data are crucial for many detector check and allow the
correla-26 The ARGO-YBJ experiment
tion of the RPC gap current with the environmental conditions. The second
260 261 262 263 264 265 607 606 605 604 603 602 601 600 599 598 Day Pr essur e [ mbar ] (a)Pressure 260 261 262 263 264 265 Day 25 20 15 10 5 0 Temper atur e [ C ] (b)Temperature
Figure 2.9: Monitoring of the environmental condition of the ARGO–YBJ
de-tector site. Values of pressure are reported in figure (a). Values for temperature outside the building (black), inside (yellow), on the ground (purple) and on the RPC carpet (red) are shown. Also the temperature of the gas at the beginning (blue) and at the end (cyan) of the gas line are reported. Data were taken in September 2011.
step consists on an online monitoring of the whole data taking process and of the overall detector performance. These two steps are performed at Yangba-jing laboratory. The data check manager (DCM) performs an offline analysis of the detector operation and data consistency before the offline reconstruc-tion of measured quantities. The monitoring of quantities like trigger rate or azimuth and zenith distributions are a powerful method to check the quality of the data taking. All the offline analysis are performed on dedicated com-puter farms. Since a selection procedure of good data taking periods based on the data quality and on the detector performance is needed for any kind of analysis, a set of easy tools has been implemented [46]. These tools pro-vide a list of good runs based on the parameters recorded by both the DCS and the DCM and on the reconstructed parameters. Due to its geographical position and the high altitude the working condition of the YBJ laboratory are quite distinctive. The experimental site is characterized by a very low average atmospheric pressure (about 600 mb) and the temperature in winter can reach very low values. In order to study the detector performance in these extreme condition a multi–layer RPC telescope has been installed near the ARGO-YBJ detector. This telescope continuously monitors the detector