LIDAR DETECTION OF CARBON
DIOXIDE AS A PRECURSOR TO
VOLCANIC ERUPTIONS: FIRST RESULTS
OF THE CAMPAIGN AT MOUNT ETNA
S. PARRACINO ENEA guest, Department of Industrial Engineering
University of Rome “Tor Vergata”, Rome, Italy S. SANTORO ENEA guest, Department of Earth and Sea Sciences
University of Palermo, Palermo, Italy E. DI FERDINANDO E. DI FERDINANDO Nuclear Fusion and Safety Technologies Department
ENEA, Frascati, Italy G. MAIO ENEA guest, ARES Consortium, Rome, Italy present affiliation: Vitrociset SpA, Rome, Italy
M. NUVOLI
Nuclear Fusion and Safety Technologies Department ENEA, Frascati, Italy
A. AIUPPA
Department of Earth and Sea Sciences University of Palermo, Palermo, Italy L. FIORANI
L. FIORANI
Nuclear Fusion and Safety Technologies Department ENEA, Frascati, Italy
RT/2016/41/ENEA
ITALIAN NATIONAL AGENCY FOR NEW TECHNOLOGIES, ENERGY AND SUSTAINABLE ECONOMIC DEVELOPMENT
S. PARRACINO ENEA guest, Department of Industrial Engineering University of Rome “Tor Vergata”, Rome, Italy S. SANTORO ENEA guest, Department of Earth and Sea Sciences University of Palermo, Palermo, Italy E. DI FERDINANDO Nuclear Fusion and Safety Technologies Department ENEA, Frascati, Italy G. MAIO ENEA guest, ARES Consortium, Rome, Italy present affiliation: Vitrociset SpA, Rome, Italy
LIDAR DETECTION OF CARBON
DIOXIDE AS A PRECURSOR TO
VOLCANIC ERUPTIONS: FIRST RESULTS
OF THE CAMPAIGN AT MOUNT ETNA
M. NUVOLI
Nuclear Fusion and Safety Technologies Department ENEA, Frascati, Italy
A. AIUPPA
Department of Earth and Sea Sciences University of Palermo, Palermo, Italy L. FIORANI
Nuclear Fusion and Safety Technologies Department ENEA, Frascati, Italy
RT/2016/41/ENEA
ITALIAN NATIONAL AGENCY FOR NEW TECHNOLOGIES, ENERGY AND SUSTAINABLE ECONOMIC DEVELOPMENT
I rapporti tecnici sono scaricabili in formato pdf dal sito web ENEA alla pagina http://www.enea.it/it/produzione-scientifica/rapporti-tecnici
I contenuti tecnico-scientifici dei rapporti tecnici dell’ENEA rispecchiano l’opinione degli autori e non necessariamente quella dell’Agenzia
The technical and scientific contents of these reports express the opinion of the authors but not necessarily the opinion of ENEA.
LIDAR DETECTION OF CARBON DIOXIDE AS A PRECURSOR TO VOLCANIC ERUPTIONS: FIRST RESULTS OF THE CAMPAIGN AT MOUNT ETNA
S. Parracino, S. Santoro, E. Di Ferdinando, G. Maio, M. Nuvoli, A. Aiuppa, L. Fiorani Abstract
Thanks to the innovative, laser-based, remote sensing system, named BILLI – Bridge Volcanic LIDAR, developed at ENEA (RC of Frascati) by FSN-TECFIS-DIM research group, it has been possible to carry out an experimental campaign at the Mount Etna volcano (CT), from the 28thof July to the 1stof
Au-gust, 2016. The main goal was to detect the exceedance of in-plume CO2 concentration, for early warning of volcanic eruptions.
The research is funded by the ERC project BRIDGE – Bridging the gap between gas emissions and geophysical observations at active volcanoes.
Keywords: Volcanic hazard, Gas detection, Laser remote sensing, Differential absorption lidar Riassunto
Grazie al nuovo sistema di telerilevamento ambientale BILLI – Bridge Volcanic LIDAR, messo a punto dal gruppo di ricerca FSN-TECFIS-DIM dell’ENEA (CR Frascati), è stato possibile condurre una cam-pagna sperimentale presso l’Etna (CT) – dal 28 Luglio al 1 Agosto 2016, allo scopo di rilevare la con-centrazione di CO2 presente in eccesso all’interno del plume vulcanico, per fornire un’allerta precoce in caso di eruzione.
Tale ricerca rientra nel progetto BRIDGE - Bridging the gap between gas emissions and geophysical observations at active volcanoes (progetto patrocinato dall’European Research Council).
Parole chiave: Rischio vulcanico, Rivelazione di gas, Telerilevamento laser, Lidar ad assorbimento differenziale
1. Introduction
2. Materials and methods 2.1 The BILLI system
2.2 The BRIDGE DIAL technique 3. Overview of the experimental campaign
3.1 Experimental setup
3.2 Meteorological parameters 4. Results and discussion
5. Conclusions Acknowledgements References 7 8 8 9 12 12 13 14 22 22 22
INDEX
1. Introduction
Millions of people currently live in the proximity of active or quiescent volcanoes and, therefore, are potentially exposed to the deleterious effects of their eruptions. In fact, volcanic eruptions can determine an increasing of air pollution levels; they are able to influence climate changes [1] and, in some circumstances, to kill large number of humans, destroying the adjacent environment and causing serious damages to national/international economies.
Mitigation of these effects requires careful assessment of volcano behavior and activity state, which can be accomplished via instrument-based volcano monitoring. Accurate knowledge of gas composition in volcanic plumes gives information on the geophysical processes, taking place inside volcanoes, and provides alert on possible eruptions [2].
Until recently, coupled gas-geophysical studies were sparse, due to the difference in their sampling frequency (low for gas data). This explains the interest of earth scientists in new techniques of gas detection, in particular for CO2, the second most abundant gas in volcanic fluids and the most directly linked to
“pre-eruptive” degassing processes [2].
In the last 30 years, several ground based optical sensing systems have been developed [3] for sounding volcanic particulate in the troposphere [4], in the stratosphere [5], for monitoring fluxes of aerosol [6], SO2
[7,8] and H2O [9] in volcanic plumes. However, the scarcity of volcanic CO2 flux data in the geological
literature (see Burton et al. 2013 [10] for a recent review) is a direct consequence of the technical challenges in resolving the volcanic CO2 signal from the large atmospheric background (≈ 400 ppmv) [11].
In order to fill this gap, a new Differential Absorption Lidar (DIAL), designed to measure the volcanic CO2
flux, was developed as part of the ERC Starting Grant Project “BRIDGE”. The BrIdge voLcanic Lidar (BILLI), recently assembled at ENEA Research Center of Frascati, successfully retrieved three-dimensional tomographies of volcanic CO2 in the plumes, at Italian volcanoes Pozzuoli Solfatara (Naples, Italy)
[12,13,14], and Stromboli volcano (Sicily, Italy) [11,15,16]. To our knowledge, this was the first time that a lidar system retrieved range-resolved measures of both CO2 concentration and flux in a volcanic plume.
BILLI has opened unprecedented possibilities in measuring volcanic CO2: an excess of a few tens of ppm
could be clearly resolved beyond 3 Km of distance, with spatial resolution of 5 m and temporal resolution of 10 s [15].
Quantifying the CO2 output from Pozzuoli Solfatara and Stromboli was vital to interpreting – and possibly
predicting – the future evolution of the volcanic system, with huge benefit of the population living nearby. These examples show the huge social values of lidar systems in monitoring gas emissions. Observations at densely populated volcanic regions will have a high societal impact throughout Europe.
The final experimental campaign, to test our system performance, has been carried out between the July and the August of 2016 at the Mount Etna (CT), the largest and most important volcano in Italy and one of the most active volcanoes in the world [17]. In this regard, both the setup of the system and the data processing routine have been maintained. Furthermore, thanks to a better wavelength setting, due to the implementation of a photo-acoustic cell, and an appropriate laser-telescope alignment, the measurement error has been
8
reduced. As it will be showed in the following, these facts have slightly improved the accuracy of our measurements.
Similarly to the previous campaigns, the main goal of this latter one was to measure the exceedance of in-plume CO2 concentration, so as to provide useful information to volcanology research, for a precocious alert
to population in case of eruptions.
For these reasons, this report has to be considered as an extension of the previous works [15,16]. In fact, here the attention will be primarily focused on successful results, concerning CO2 plume retrieved beyond 4 Km,
the longest optical path ever reached by our system.
A brief description of BILLI system and the newly designed BRIDGE DIAL data processing technique will be shown, respectively, in Section 2.1 and 2.2. Moreover, an overview about the experimental setup of the system and the meteorological conditions, during the measurement sessions, will be reported in Section 3. Finally, a fully comprehensive analysis of the field operations and, in particular, of CO2 profiles and
dispersion maps, achieved by Matlab routines, will be discussed in Section 4.
2. Materials and methods
2.1 The BILLI system
BILLI [15] is a complex DIAL system for environmental remote sensing that provides ground based and range resolved remote measurements.
It is mounted in a truck, usually positioned far from the volcanic plume and probes it with its laser beam. Thanks to two large elliptical mirrors the instrument field of view – FOV can be aimed to any direction. With such configuration, and scanning the plume in both horizontal and vertical planes, the CO2
concentration outside and inside the volcanic plume is measured. These measurements, once carried out over a significant part of the plume, and upon scaling to the transport rate (as derived from the wind speed at the plume altitude), allow one to retrieve the carbon dioxide flux. More details about this procedure are reported in Ref. 11, 14 and 15.
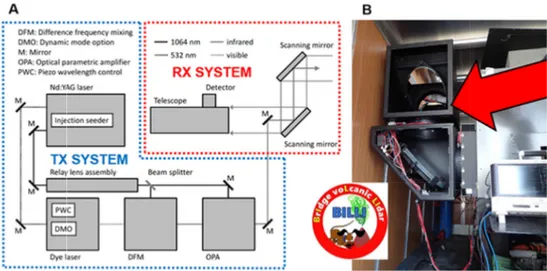
The system is composed of a transmitter and receiver equipment (visible in Fig. 1a). Instead, a particular of the telescope mirrors are visible in Fig. 1b.
Fig. 1 Technic turning mount The transmi Nd:YAG la Difference F Ho:YLF an prevent to c but our exp near degass Instead, the (ADC). Mo [11-16]. Th Tra Rec Scan Dete Ana Table 1 Main cal scheme of B t (opened) (B). ission sub-sy aser (powerf Frequency M nd fiber laser choose the b erience show ing craters [ e receiver su ore details co e specificatio nsmitter eiver nning elliptic ector module alog-to-digita specifications o BILLI system (A The box behind
ystem is base ful, tunable a Mixing) and rs have been best absorptio ws that they t 15]. ub-system is oncerning the ons of the wh cal mirrors e l converter (A of the BILLI D
A). The red arro d the arrow con
ed on: a doub and narrow-an Optical P discarded m on line. OPO tend to be qu based on: a e mode of op hole system Pulse e Pulse d Repetit Wavele Laser l Beam d Mirror Clear a Focal l Mirror Clear a Photod Diamet Respon Gain Noise e Bandw ADC) Dynam Sampli IAL system du ow indicates th ntains lasers and
ble grating d linewidth), a Parametric A mainly for the O (optical pa uite delicate a telescope, a peration of t are reported energy duration tion rate engths linewidth divergence coating aperture length coating aperture diode ter nsivity equivalent pow width mic range ing rate uring the Mount
e two large elli d telescope. dye-laser opti a device for Amplifier ope eir limited tu arametric am
and not easy
a detector an the BILLI sy in Table 1 [ 25 mJ 8 ns 10 Hz ON: 200 0.04 cm 0.5 mrad Al 300 mm 900 mm Al 320 mm InGaAs 1 mm 1.2 A∙W 5.1 9 10 wer 10 pW H 0–10 M 14 bit 100 MS t Etna volcano f ptical mirror in ically pumpe r the frequen erating in NI unability (few plifier) could y to deploy i nd an analog ystem are rep
15]. 09.537 nm, OF m-1 d m m m x 451 mm PIN W-1 04 V∙A-1 Hz-1/2 Hz ∙s-1 field campaign.
nside their preci
ed by an inje ncy duplicati IR band (OP w tenths of n d also be a g in the harsh gical to digit ported in pre FF: 2008.484 . ision motorized ction seeded ion (DFM – ANIR). Tm, nm) that can good choice, environment tal converter evious works nm d d – , n , t r s
10
It is well known that CO2 absorbs in the 15, 4.2, 2.1 and 1.6 μm bands (in order of decreasing strength) [13].
Unfortunately, in the first two bands viable lasers are not available and atmospheric backscattering is rather low, so the 2.1 band has been chosen for its detection [15]. Nevertheless, the DIAL measurement of CO2
remains a difficult task because the absorption lines are narrow and weak [13]. Furthermore, with respect to Pozzuoli Solfatara field campaign [12,13,14], the operative wavelengths have been slightly changed (see Table 1). In order to reduce the differential absorption cross section of carbon dioxide (Δσ), thus allowing the laser beam to reach longer ranges.
Summarizing, the main characteristics of the BILLI DIAL system are the following:
the system is able to explore the atmosphere in both vertical and horizontal directions;
each lidar profile is obtained averaging 50 shots ON and OFF (interlaced between them with tshift =
0.1 s);
the temporal resolution between laser shots (Δt) is equal to 10 ns, corresponding to ΔR of 1.5 m; a concentration profile is obtained (≈ 40 s) by a couple of lidar signals (ON and OFF) using the
newly designed mathematical technique explicitly developed for this application;
starting from lidar signals of the same scan it is possible to retrieve the dispersion map of in-plume CO2 concentration [ppm] in the investigated area;
knowing the (estimated) plume speed it is possible to obtain the CO2 flux [Kg/s];
starting from lidar profiles acquired successively, it is possible to track, as rapidly as possible, the motion of discrete atmospheric particles emitted by the volcanic crater. This allows one to estimate also the wind speed [18].
2.2 The BRIDGE DIAL technique
From the literature [18,19,20], the optical power returned to the lidar receiver at any time t is produced by back-scattering of the laser beam by an atmospheric layer at distance R (range) from the source, where R = ct/2 and c is the speed of light. As such, the lidar offers range-resolved information on atmospheric structure and properties (aerosols, particles and gas molecules) along the laser beam, in the form of intensity vs. range plot.
Generally, raw data are normalized to the laser energy, and the flat baseline of each return, which is proportional to the intensity of background noise, is subtracted. Background noise here is defined as an average of data points sampled at the far end of the signal trace (see Fig. 2a).
Upon its atmospheric propagation, the beam intensity decreases approximately: exponentially, due to atmospheric extinction, according to Lambert-Beer law and as 1/R2, because the solid angle subtended by the
receiver is A/R2, where A is the telescope effective area. For these reasons, it is a common practice to use the Range Corrected Signal – RCS for lidar data processing (see Fig. 2b). To improve the signal-to-noise ratio (SNR), 100 laser shots were averaged for each lidar returnand a Savitzky-Golay filter [21] algorithm with 13 points was employed (Fig. 2c).
Since the sy absorbed by behavior, ex between the to retrieve th Fig. 2 Exampl 230°. Data pro the OFF chann
In order to slightly mo volcanic plu ystem works y CO2 – and xcept from e co-emitted he range-res le of a lidar pro ofile cleaned by nel (C). obtain the re dified with r ume and the
s in DIAL m d λOFF – not CO2 absorpt λON and λOF olved CO2 c ofile acquired at y the noise and
esults report respect to Po lower conce mode, each in absorbed by tion, is pract FF signals, an oncentration t 13:03 (local ti a magnification ed in this w ozzuoli Solfa ntration of c ntensity profi y CO2. The tically ident nd using the n profile in th ime) of the 31st n of laser beam work, transmi atara campai carbon dioxid ile is acquire two wavele ical. Thanks BRIDGE DI he volcanic p t of July 2016, a m reflection off tted wavelen ign [12,13,14 de. ed at two dist engths are so s to the mea IAL techniqu plume. at an elevation Etna rockfaces ngths and da 4], due to th stinct wavele o close that asured intens ue [11-16], i angle of 7.25° s (A), RCS (B) ata processin he greater dis engths, λON – atmospheric sity contrast, it is possible and azimuth of and filtering of ng have been stance of the – c , e f f n e
12
The transmitted wavelengths have been changed (ON: 2009.537 nm, OFF: 2008.484 nm) in order to reduce Δσ, the differential absorption cross section of carbon dioxide, thus allowing the laser beam to reach longer ranges.
Then, we have processed each acquired atmospheric profile using a Matlab analysis routine, with the aim of calculating the CO2 concentrations in the atmospheric background, and in the volcanic plume. The data
processing routine consists of the following steps, all based on the Lambert-Beer law relation: a) Initially, the CO2 concentration in the natural background atmosphere, C0, is calculated as:
1 1 1 , 0, 0 , 0, ln P OFF OFF 2 P P ON ON I I C R I I (1)
where: IP1,ON (IP1,OFF) stands for intensity of the ON (OFF) lidar signal caused by reflection of the laser
beam off the surface of the first wall-rock of the Mount Etna (1600 m<RP1<1700 m, see Fig. 2a); I0,ON
(I0,OFF) is the intensity of the ON (OFF) lidar peak, caused by laboratory scattering of the laser pulse (see
Fig. 2a) and Δσ is the CO2 differential absorption cross section;
b) Secondly, ΔC, the average excess CO2 concentration in the volcanic plume cross-section between the
first and second rockface of the Etna, is derived from:
2 1 2 1 2 1 , , 0 , , ln P OFF P OFF 2 P P P ON P ON I I C C R R I I (2)where: IP2,ON (IP2,OFF) is the peak intensity of the ON (OFF) lidar signal caused by reflection of the laser
beam off the surface of the second rock wall of the Etna (2050 m<RP2<2450 m see Fig. 2a);
c) Thirdly, CCO2,i, the excess of CO2 concentration, corresponding to each i-th ADC channel of the lidar
profile, is calculated from:
i i k S C (3) where: −
P2 P1
i i C R R k R S
is the multiplication factor;− 2 ,
ln( )
i i OFF i
S I R is the Range Corrected Signal;
− ΔR is the range interval corresponding to an ADC channel;
− Ii,OFF is the OFF signal of the i-th ADC channel (the OFF signal has been chosen because of its
signal-to-noise ratio is higher);
d) the zero level of Ci has been calculated outside the volcanic plume.
e) Finally, the two main error sources, that affected our measurements, have been evaluated:
i. systematic error of the CO2 concentration measurement – Taking into account of the experience
[11,14] the systematic error of our system is dominated by imprecision in wavelength setting [12], leading to inaccuracy in differential absorption cross section and thus in gas concentration. To minimize this error, we implemented a photo-acoustic cell filled with pure CO2 at
atmospheric pressure and temperature, close to the laser exit, in order to control the transmitted wavelength before each atmospheric measurement. This procedure allows to set the ON/OFF wavelengths with better accuracy than the laser linewidth [15]. Assuming that the error in the wavelength setting is ±0.02 cm-1 (half laser linewidth), in the wavelength region used in this
study, the systematic error of the CO2 concentration measurement is 5.5% [11].
ii. statistical error of the CO2 concentration measurement - The statistical error has been calculated
by standard error propagation techniques [22] from the standard deviation of the lidar signal at each ADC channel. In the distance range between the first and the second rockface, representing a mean measurement range, and at typical atmospheric and plume conditions encountered during this study, the statistical error of the CO2 concentration measurement was about 0.61%.
Assuming that each error source is statistically independent, we can quadratic sum all the errors and obtain a cumulative error of ~ 6.1% (dominated by the systematic error), a lower value than the previous campaign. In fact, at Stromboli the quadratic sum of same error contributions was about 8% [11].
As already stressed, the repetition rate was 10 Hz and each CO2 profile was obtained averaging only 100
lidar returns (50 at ON and 50 at OFF), corresponding to an integration time of about 40 s. Plume scans were acquired only along the vertical path and retrieved combining more than 30 profiles, in less than 18 minutes. Typically, 50 scans (or more) at different elevations were repeated, for each measurement day, obtaining three-dimensional tomographies of the volcanic plume.
3. Overview of the experimental campaign
3.1 Experimental setup
The area chosen for our experiments was the summit crater of the Mount Etna volcano (3329 m above the sea level – ASL), that is placed between the province of Messina and Catania, in Sicily (Fig. 3a). This hostile and inhabited region hosts one of the most active volcano in the world. It is characterized by extremes of temperature, high humidity and rates of rainfall, the presence of acid vapors, re-suspended dust and particles, which are toxic for humans and dangerous for the instrumentation [17].
Notwithstanding the harsh environment, BILLI operated practically continuously for nearly a week (from July 28-31, to the 1st of August 2016, including an initial instrumental setup phase), thanks to good weather
14 During our courtyard o position, ab distance gua Vertical sca 3c). In such between 7° Km range. Finally, pre 2006/25/EC particular, t access to th authorized p This experi operators. Fig. 3 Experim INGV observa fixed line of si the elevation a fact. Instead, t crater. Therefo experiment, of INGV ob bout 500 m aranteed the ans were per h conditions,
and 9°. Car
eventive mea C [23], to e
the laser poin he area just
personnel tha mental setup
mental area in atory in which t
ight – LOS equ angles in which the yellow solid ore, in these spe
, the system servatory, at below the v safety of op formed at co two rockfac rbon dioxide asures have nsure that l nting angle w around the s at wore prote p did not aff
which the cam the former was ual to 230°). Th h the laser beam d arrow indicat ecific cases, me was placed t 2823 m A volcano’s su erators. onstant azimu ce peaks wer was encoun been adopte laser beam was sufficien system locat ective glasse fect the use
mpaign was carr placed (B). Th he variation of e m has intercepted es an example easures have be into a 3.5-to ASL, in the ummit, is ≈ uth angle (2 re intercepted ntered and m ed in the fie did not hit ntly high in e tion was rest es.
of the laser
ried out (A). G he red arrow ind elevation angle d the rockface o of elevation an een performed in on laboratory North-East 3 Km far fr 30°) and at e d by laser lin measured insi eld, in acco buildings (I elevation to a tricted, in or and, at the Geographical co dicates the azim
(7° to 14°) is s of the Mount E ngle (of the lase n the free atmo
y truck (Fig. side of the rom the mai
elevation ang ne of sight (L de the volca
rdance with INGV obser avoid this fac rder to guara
same time, g
oordinates of bo muth pointing an
howed in (C). Y tna. The subten er beam), that e sphere. 3b), positio main crater in degassing gles from 7° LOS) at elev anic plume in h the Europe rvatory), or ct. In additio antee the ac guaranteed t
oth the BILLI angle of the lase
Yellow dotted a nded area in yel exceeds the heig
oned into the r. This fixed g vents. This to 14° (Fig. vation angles n the 2.2-4.2 ean directive persons. In n to this, the cess only to the safety of
system and the er beam (with a arrows indicate llow shows this ght of the main e d s . s 2 e n e o f e a e s n
3.2 Meteoro This paragr sessions (28 As it is kno techniques a In particula Relative Hu Even thoug during the d in-field insp weather was In Figure 3, the weather compared w [25], have c Fig. 4 Meteoro In conclusio influence of the direction between the ological para raph reports 8-31/07/2016 own, the we and, therefor ar, here the a umidity [%]; gh the experim day (from su pections, stab s sunny and , the most im r archive of with the ones confirmed bo ological parame on, weather f the wind th n of the near e detected lid ameters s the trends 6 and 01/08/2 eather condit re, also by ou attention is f Precipitation ments were ub-zero value ble weather the total abs mportant met
a popular fo s acquired by oth the result
eters observed a
conditions d hat blew from
rby city of C dar signals w of the main 2016) of the tions can str ur remote sen focused on t ns [mm]; Wi carried out i es during the conditions p ence of prec teorological orecast webs y in-situ stati s reported in at the Mount Et
did not signi m North-We Catania. How with the data c
n meteorolo experimenta rongly influe nsing system the analysis ind Speed [K into a hostile e night, to 15 persisted dur ipitations, ha trends are re site [24], du ion of Italian n Fig. 4 and i
tna, during the
ificantly affe st and could wever, these collected by ogical param al campaign o ence measur m. of the follow Km/h] and W e place, with ° at midday) ring the entir ave significa eported. The uring the sec n Air Force a in field obser second half of J ect BILLI m d probably sc conditions a conventiona meters, conce of Etna. rements carri wing parame Wind Directio h temperature ) even in the re measurem ntly favored ese parameter ond half of at Etna’s nort rvations. July, 2016. measurements catter volcani allowed also al in-situ instr erning the m ried out by c eters: Tempe on [°]. es that can s summer; on ment window d in-situ meas ers have been July 2016. rtheast crater s, except for ic particles a a quite good truments. measurement conventional erature [°C]; trongly vary n the basis of . In fact, the surements. n taken from The trends, observatory r a moderate and fumes in d correlation t l ; y f e m , y e n n
16 4. Results In this secti means of s dispersion m As already remotely an in the proxim Furthermore was also po displacemen During the acquisition elevation of In general, plume peak for the prof time), with
Fig. 5 Examp
relative to the peak has been clearly visible
In the previ localized be one (placed
s and discus
ion, the resu ome useful maps) extrap seen in the nd in extreme mity of the m e, after a chr ossible to dr nts of volcan campaign, time. In fac f the laser be for elevatio ks attached or file reported elevation an ple of in-plume presence of pl n highlighted in in the upper le ious figure, t etween 1750 d around 225 sion ults of the Mo examples (t polated from Section 2.2 ely rapid wa main vent of ronological r raw CO2 dis
nic plume par it has been ct, both the m eam-pointing n angle valu r strictly clos in Fig. 5, co gle equal to e CO2 concentr lume attached t nto the red dotte eft side of the fig
the exceedan and 2230 m 0 m) is due t
ount Etna fie three signific the whole da 2, thanks to ay, the conce f Etna volcan rearrangemen spersion map rticles as a fu n noted sev magnitude a g angle and, o ues comprise se to the first oncerning a s 8° and a fixe ation profile re to the second r ed box and a m gure. nce of in-plum m (from the s to the reflect eld campaign cant CO2 co ataset. the BRIDG entration prof no. nt of subsequ ps. These to unction of tim veral configu
and the size obviously, th ed within 7° t or the secon signal taken ed azimuth (2 etrieved at the rockface hit by magnification of me CO2 conc system locati tion of laser n will be pre oncentration GE DIAL tec files, relative uent profiles omographies me, elevation uration of p of CO2 plum
hey were also ° and 9° it w
nd rockface from the Sc 230°).
17:27 (local ti the laser beam f this profile’s p centration pr ion), is relati beam to the esented and t profiles and chnique, it w e to the exce , relative to t were extrem n angle and r plume that v me were sub o influenced was quite co of the Moun can n°8, and
me). Two peak m (the second pe portion, provide
rofile shows ive to the plu
second rock
thoroughly d d a series of
was possible eedance of in
the same ver mely useful range of acqu varied as a bject to chan by the prese ommon to de nt Etna. As, f acquired at ks are visible, peak in the figu ded with the y-a
two peaks, t ume; instead kface. The m discussed by f subsequent e to retrieve, n-plume CO2 rtical scan, it to track the uisition. function of nge with the nce of wind. etect narrow for example, 17:27 (local
the first one is ure). The plume axis errorbar, is
the first one, d, the second magnification y t , 2 t e f e . w , l s e s , d n
of the plum (see the Sec Finally, the residual pre neglected in The plume magnitude d altitude was proximity o cloud into th The situatio plume tende Once the la peaks, such elevation an Fig. 6 Exampl highlighted in the upper left s
Instead, the has been ac (local time) It is possibl from previo letter A in F 150 ppm. Instead, the beyond 4 K me profile (vi c. 2.2). last portion esence of in n the followin reported in does not exc s lower than of the rockfac
he atmosphe on was extre ed to dispers ser beam poi h as the one r ngle of 9.25°
le of in-plume nto the red dotte
side of the figu
concentratio quired in the , with elevat le to notice tw ous consider Fig.7, is extr e second plum Km (precisely sible in the u of the profil nstrumentatio ng discussio the previou eed the value n the summi
ce behind th ere and, at the emely differe e and expand inting angle reported in F °), that was l CO2 concentrat ed box. A magn
re. The same co
on profile, re e free atmosp tion angle eq wo peaks rel ations, the f remely wide me peak, aro y from 4060 upper side of le (from 2300 on noise. Fo n. us figure app e of 140 ppm t crater one. e plume that e same time, ent by increa d more than exceeded th Fig. 6 (taken localized aro
tion profile retr nification of th onsiderations, c eported in Fig phere. It conc qual to 12° an lative to CO2 first peak, lo (it extends f ound 250 ppm m to 4140 m f the Fig.5) s 0 m to 4500 or this reaso pears as qui m. It should b . Therefore, t, de facto, p , made the w asing the ele
profiles acqu he summit cra n from the Sc ound 2.5 Km
rieved at the 13 his profile’s por concerning resid g. 7, signific cerns a signa nd a fixed az 2 plume high ocalized betw for more tha
m, is identif m) from the s
shows also th
m) shows se on, the cont
te narrow (i be noted that the profiles prevented the wind contribu evation angle uired at lowe ater, it was p can n°4 and from the sys
3:08 (local time rtion, provided dual instrument antly differs al taken from imuth (230°) hlighted by th ween 1250 m an 1 Km) and fied by the le system locati he y-axis err everal oscilla tribution of it extends fo at 8° elevati ’ behavior c e complete di tion negligib e. In fact, it er elevation a possible to no acquired at stem location ). A narrow sin with the y-axis tal oscillations,
from the pre m the Scan n° ). he red dotted m and 2550 m d its magnitu etter B in Fig ion and repre
rorbar, equal ations, that a this segme or about 500 ion angle, th could be just ispersion of ble. has been no angles. otice immed 13:08 (local n.
ngle plume peak s errorbar, is cl
are valid also f
evious exam °6, and acqui d boxes. As m, and ident ude exceeds g.7. It has b esents the fa l to the 6.1% re due to the nt has been 0 m) and its e laser beam tified by the the volcanic
oted that the
iately plume l time), at an
k is visible and learly visible in for this case.
mples, since it ired at 15:19 we expected tified by the the value of een detected rthest plume % e n s m e c e e n d n t 9 d e f d e
18 peak ever d (6.1%), are Similarly to several osci reason, it w The behavio plume was c shown in Se Fig. 7 Examp indicated, resp interpreted as (uncertainty is the system loc
Finally, Fig between 13 slot has bee concentratio detected by clearly visib o the previou illations. The was considere or of this pl completely d ection 3.2). ple of in-plume pectively, with the backgroun s equal to 6.1% cation. gures 8, 9, 10 :20 and 18:1 en selected f on exceedanc our system. ble in the low us example, t ese latter are ed to be negli lume could b dispersed in t e CO2 concentr h the letters (A nd noise. In th %). The first pea
0 and 11 rep 15 (local tim for the relev
ce as a funct The magnif wer part of th the portion o due to the re igible. be justified b
the free atmo
ration profile r A) and (B). Ra he lower part o ak (A) has been
orts 15 exam me), during th ance of the ion of elevat fications of he Fig.7. of the profile esidual prese by the fact t osphere and retrieved at the apid signal flu of the figure, i n detected at 22 mples of CO2 he measurem results. Each tion angle an both plumes e between the ence of instru
that, for such scattered by e 15:19 (local uctuations, betw t is possible to 250 m. Instead, 2 dispersion ment session h of these to nd range of a s, provided w e two mentio umentation n h elevation a a moderate
time). Two plu ween the two o notice a prof
the second pea
vertical map of the 31st o
omographies cquisition.
with the y-a
oned plume p noise (see Fig
angles and a presence of
ume are visibl mentioned pea file’s zoom wi ak (B), beyond ps, acquired of July, 201 represents t axis errorbar peaks shows g.7). For this altitudes, the the wind (as
e and they are aks, have been th the errorbar the 4 Km from successively 6. This time the in-plume r s s e s e n r m y e e
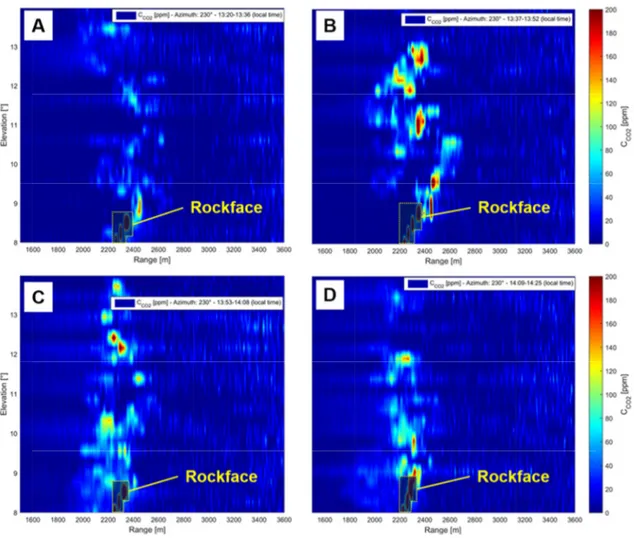
Fig. 8 Exceed 2016, during th This session profiles. The elevatio resolution o The maxim data sets we A fixed azim It is possibl spots) as a boxes indica ance of CO2 co the Scan numbe
n was comp on angle wa of about 0.25 mum operativ ere discarded muth angle ( le to notice function of ate the laser
oncentration dis er 5. osed of 4 ve as between 8 °. e range here d. 230°) was us the tempora elevation an beam reflect spersion maps a ertical loop, 8° and 14°. G e was equal t sed during th al evolution o
ngle and the ting off the r
acquired, succe each coverin Globally, the to 3.755 Km he entire mea of the plume range of ac rockface of th ssively, from th ng about 16 e system FO m. Missing an asurement se e (highlighte cquisition. A he volcano. he 13:20 to the minutes. Ea OV was equa nd/or erroneo ession. ed by red, or Areas highlig 14:25 (local tim
ach loop con
al to 6°, with ous acquisiti range, yellow ghted with ye me) on July 31, nsisted of 24 h an angular ons between w and green ellow dotted , 4 r n n d
20 Fig. 9 Exceed 2016, during th This session profiles. The elevatio resolution o The maxim data sets we A fixed azim It is possibl spotss) as a boxes indica ance of CO2 co the Scan numbe
n was comp on angle wa of about 0.25 mum operativ ere discarded muth angle ( le to notice a function of
ate the laser
oncentration dis er 6. osed of 4 ve as between 7 °. ve range here d. 230°) was us the tempora f elevation a beam reflect spersion maps a ertical loop, 7° and 14°. G e was equal sed during th al evolution o
ngle and the ting off the r
acquired, succe each coverin Globally, the to 4.5 Km. he entire mea of the plume e range of ac rockface of th ssively, from th ng about 18 e system FO Missing an asurement se e (highlighte cquisition. A he volcano. he 14:35 to the minutes. Ea OV was equa d/or erroneo ession. ed by red, or Areas highlig 15:50 (local tim
ach loop con
al to 7°, with ous acquisitio range, yellow ghted with ye me) on July 31, nsisted of 28 h an angular ons between w and green ellow dotted , 8 r n n d
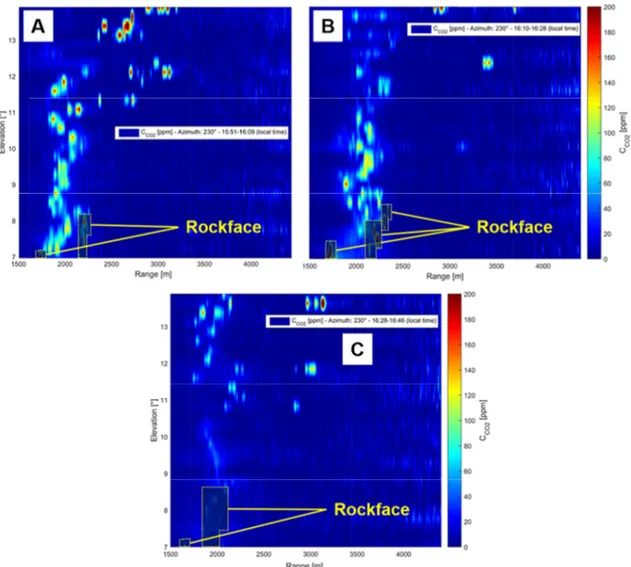
Fig. 10 Excee 31, 2016, durin This session since it was The elevatio resolution o The maxim data sets we A fixed azim It is possibl dots) as a f boxes indica edance of CO2 ng the Scan num
n was compo s affected by on angle wa of about 0.25 mum operativ ere discarded muth angle ( le to notice function of e
ate the laser
concentration d mber 7. osed of 4 ver an unexpect as between 7 °. ve range here d. 230°) was us the tempora elevation an beam reflect dispersion maps rtical loop, e ted measurem 7° and 14°. G e was equal sed during th al evolution o
gle and the ting off the r
s acquired, suc each covering ment error. E Globally, the to 4.5 Km. he entire mea of the plume range of ac rockface of th ccessively, from g about 18 m Each loop con e system FO Missing an asurement se e (highlighte cquisition. A he volcano. m the 15:51 to t minutes. The nsisted of 28 OV was equa d/or erroneo ession. ed by red, or reas highligh the 16:46 (loca last loop wa 8 profiles. al to 7°, with ous acquisitio range, yellow hted with ye al time) on July as discarded, h an angular ons between w and green ellow dotted y , r n n d
22 Fig. 11 Excee 31, 2016, durin This session profiles. The elevatio resolution o The maxim data sets we A fixed azim It is possibl dots) as a f boxes indica In the previ and green background As already rockface of the yellow d edance of CO2 ng the Scan num
n was comp on angle wa of about 0.25 mum operativ ere discarded muth angle ( le to notice function of e
ate the laser ous figures, spots respec d. stressed, for f the Mount E dotted boxes concentration d mber 8. osed of 4 ve as between 8 °. ve range here d. 230°) was us the tempora elevation an beam reflect it is clearly v ct to the da r lower elev Etna encoun s in the lower dispersion maps ertical loop, 8° and 14°. G e was equal sed during th al evolution o
gle and the ting off the r visible the tim ark blue col
ation angle, ntered by the r side of each s acquired, suc each coverin Globally, the to 4.5 Km. he entire mea of the plume range of ac rockface of th me evolution lor that, inst
the plume w e laser beam. h scan. Inste ccessively, from ng about 16 e system FO Missing an asurement se e (highlighte cquisition. A he volcano. n of plume h tead, represe was circums . The rockfa ad, in the fre
m the 15:51 to t minutes. Ea OV was equa d/or erroneo ession. ed by red, or reas highligh ighlighted by ents the CO cribed betwe ce regions h ee atmospher the 16:46 (loca
ach loop con
al to 6°, with
ous acquisitio
range, yellow hted with ye
y the red, ora O2 concentra
een the first have been hig
re, the smoke
al time) on July nsisted of 24 h an angular ons between w and green ellow dotted ange, yellow ation natural t and second ghlighted by e plume rose y 4 r n n d w l d y e
and developed in both vertical and horizontal direction, covering a wide area, after a complete random dispersion, as in Figures 9b,c, 10, 11a,b,c or remaining rather confined as in Figures 8, 9a, 11d.
Obviously, both spatio-temporal and intensity variations of CO2 concentration, shown in the previous
figures, were strictly linked to the variations of emitted particles and ash during the current volcanic activity. Plume fluctuations in free atmosphere were also probably due to a combination of the thermal updraft, from the main degassing vents on the volcano’s summit, and on a smaller scale, to the presence of North-West wind blowing during the measurement session.
Furthermore, differences between subsequent maps were also probably due to rapid, local and random fluctuations of particles and gases emitted by volcano.
In conclusion, the great novelty, respect to the previous works [15,16], is that our measurements allowed us to locate and track volcanic plumes, beyond 4 Km of distance from the system location. The detected values in excess of CO2 concentrations were in good agreement both with conventional measurements, carried out
in the same time interval, and with the previous lidar ones acquired during the Stromboli campaign [15]. The preliminary results reported in this work can be considered to be extremely promising to validate the reliability and accuracy of the system developed at ENEA. Furthermore, they could represent a further step forward in the ground-based volcano monitoring and volcanology research field.
5. Conclusions
In this work, the results of the experimental campaign carried out between the 28th of July and the 1st of
August 2016, at the Mount Etna volcano have been reported. The main goal was to detect and analyze volcanic plumes, in order to measure the exceedance of in-plume CO2 concentration. This gas is extremely
important since, according to volcanologists, it is a precursor of eruptions. For this purpose, BILLI, a DIAL system recently developed at ENEA under the ERC BRIDGE project, was used.
The great novelty/advantage of the measurements reported here is that BILLI allowed measurements to be taken continuously, remotely (more than 4 Km) and, therefore, from a safer location free from risks to which operators are exposed during direct sampling, with much higher temporal (40 s) and spatial (5 m) resolution (the plume was scanned in few minutes rather than over several hours). These performances are adequate to follow the spatiotemporal dynamics of the volcanic plume and can provide, quickly and continuously, reliable data on a key precursor of volcanic eruptions.
In conclusion, the BILLI DIAL system was used to retrieve 3D tomographies of volcanic plumes at Etna volcano. CO2 excess of a few tens of ppm has been clearly detected remotely and in a few minutes scan.
Furthermore, a complete time-resolved plume evolution has been detected in several measurement sessions; this fact could also be useful for the measurement of wind speed.
The lidar measurements of CO2 were in good agreement with results obtained with conventional techniques,
yet based on completely independent and significantly different approaches. This has proven the goodness and the reliability of the system developed by the ENEA.
24
To our knowledge, this is the first time that a CO2 peak is retrieved by lidar in a volcanic plume, at a distance
that exceeds the 4 Km. This fact demonstrates the high potential of laser remote sensing in volcanological research.
In the near future, it will be desirable to deploy a such established laser-based system, to eruptions forecasting, for prolonged periods. This will allow us to provide useful information to volcanologists, concerning the time evolution of volcanic gases in hazardous regions, working remotely and safely.
Acknowledgements
The authors are grateful to ENEA, in general, and Aldo Pizzuto, Roberta Fantoni and Antonio Palucci, in particular, for constant encouragement.
26
References
[1] “How do volcanoes affect the climate?,” The Guardian, London, UK, 9 February 2011 (accessed 1 September 2016). [https://www.theguardian.com/environment/2011/feb/09/volcanoes-climate]
[2] A. Aiuppa, M. Burton, T. Caltabiano, G. Giudice, S. Guerrieri, M. Liuzzo, F. Murè, and G. Salerno, “Unusually large magmatic CO2 gas emissions prior to a basaltic paroxysm,” Geophys. Res. Lett. 37(17),
L17303 (2010) [doi:10.1029/2010GL043837].
[3] C. Oppenheimer and A. McGonigle, “Exploiting ground-based optical sensing technologies for volcanic gas surveillance,” Annals of Geophysics 47(4), 1455-1470 (2004).
[4] L. Fiorani, F. Colao and A. Palucci, “Measurement of Mount Etna plume by CO2-laser-based lidar,” Opt. Lett. 34(6), 800-802 (2009).
[5] H. Jäger, “The pinatubo eruption cloud observed by lidar at garmisch-partenkirchen,” Geophys. Res.
Lett. 19(2), 191-194 (1992).
[6] J. N. Porter et al., “Sun photometer and lidar measurements of the plume from the Hawaii Kilauea Volcano Pu’u O’o vent: Aerosol flux and SO2 lifetime,” Geophys. Res. Lett. 29(16), 30-1 (2002) [doi: 10.1029/2002GL014744].
[7] T. Casadeval et al., “Sulfur Dioxide and Particles in Quiescent Volcanic Plumes From Poàs, Arenal, and Colima Volcanos, Costa Rica and Mexico,” Journal of Geophysical Research 89(D6), 9633-9641 (1984).
[8] P. Weibring, et al., “Monitoring of volcanic sulphur dioxide emissions using differential absorption lidar (DIAL), differential optical absorption spectroscopy (DOAS), and correlation spectroscopy (COSPEC),”
Appl. Phys. B 67(4), 419-426 (1998).
[9] L. Fiorani, F. Colao, A. Palucci, D. Poreh, A. Aiuppa, and G. Giudice, “First-time lidar measurement of water vapor flux in a volcanic plume,” Opt. Commun. 284(2011), 1295-1298 (2011).
[10] M.R. Burton, G.M. Sawyer and D. Granieri, “Deep Carbon Emissions from Volcanoes,” Rev. Mineral.
Geochem. 75(1), 323-354 (2013).
[11] A. Aiuppa, L. Fiorani, S. Santoro, S. Parracino, R. D’Aleo, M. Liuzzo, G. Maio and M. Nuvoli, “Frontiers in Dial-Lidar-based remote sensing of the volcanic CO2 flux,” Frontiers in Earth Sciences – Volcanology 2016 (submitted).
[12] L. Fiorani, S. Santoro, S. Parracino, M. Nuvoli, C. Minopoli and A. Aiuppa, “Volcanic CO2 detection
with a DFM/OPA-based Lidar,” Optics Letters 40(6), 1034-1036 (2015) [doi:10.1364/OL.40.001034]. [13] L. Fiorani, S. Santoro, S. Parracino, I. Maio, M. Del Franco and A. Aiuppa, “Lidar detection of carbon
dioxide in volcanic plumes,” Proc. SPIE 9535, Third International Conference on Remote Sensing and
Geoinformation of the Environment (RSCy2015), 95350N, 1-6 (2015) [doi:10.1117/12.2192724].
[14] A. Aiuppa, L. Fiorani, S. Santoro, S. Parracino, M. Nuvoli, G. Chiodini, C. Minopoli, G. Tamburello, “New ground-based Lidar enables volcanic CO2 flux measurements,” Scientific Reports 5(13614), 1-12
[15] L. Fiorani, S. Santoro, S. Parracino, G. Maio, M. Nuvoli, A. Aiuppa, “Early detection of volcanic hazard by Lidar measurement of carbon dioxide,” Natural Hazards 83(21), 1-9 (2016) [doi:10.1007/s11069-016-2209-0].
[16] S. Parracino, S. Santoro, G. Maio, M. Nuvoli, A. Aiuppa and L. Fiorani, “Lidar campaign at Stromboli volcano: methodology and results,” ENEA Technical Report RT/2016/31/ENEA (2016).
[17] A. Bonaccorso, S. Calvari, M. Coltelli, C. Del Negro, S. Falsaperla, Mt. Etna: Volcano Laboratory, Published by the American Geophysical Union as part of the Geophysical Monograph Series, Volume 143. Wiley Online Library, USA (2013) [doi: 10.1029/GM143].
[18] L. Fiorani, “Environmental Monitoring by Laser Radar,” Chap. 4 in Lasers and Electro-Optics Research
at the Cutting Edge, S. B. Larkin, Eds., pp. 123-175, Nova Science Publishers Inc., New York (2006).
[19] V. Kovalev, W. E. Eichenger, Elastic Lidar, Theory, Practice and Analysis Methods, Wiley & Sons, Inc., Hoboken, New Jersey, USA (2004).
[20] C. Weitkamp, Lidar Range-Resolved Optical Remote Sensing of the Atmosphere, Springer, NY, USA (2005).
[21] R. W. Schafer, “What Is a Savitzky-Golay Filter?,” IEEE Signal Processing Magazine 28(4), 111-117 (2011) [doi:10.1109/MSP.2011.941097].
[22] A. Papoulis, U. Pillai, Probability, Random Variables and Stochastic Processes, 4th ed., McGraw-Hill,
New York (2002).
[23] European Parliament, Council of the European Union, “Directive 2006/25/EC of the European Parliament and of the Council of 5 April 2006 on the minimum health and safety requirements regarding the exposure of workers to risks arising from physical agents (artificial optical radiation) (19th individual Directive within the meaning of Article 16(1) of Directive 89/391/EEC),” Off. J. Eur. Union L114, 38–59 (2006).
[24] Weather archive of Mount Etna, Meteoblue (accessed 1 September 2016) [https://www.meteoblue.com/it/tempo/previsioni/archive/37.745N14.996E?params=20160731&fcstlengt h=15]
[25] “Previsioni meteorologiche per Etna-Cratere NE (CT),” Aeronautica Militare, Centro Nazionale di Meteorologia e Climatologia Aeronautica, 26 June 2015 (accessed 31 July 2016) in Italian. [http://www.meteoam.it/ta/previsione/907/etna-cratere_ne]
ENEA
Servizio Promozione e Comunicazione www.enea.it
Stampa: Laboratorio Tecnografico ENEA - C.R. Frascati dicembre 2016