In Field Assessment of
Safety, Security, Comfort and Accessibility
of Bus Stops: a Planning Perspective
Silvia Rossetti
1, Michela Tiboni
21DIA – Università degli Studi di Parma 2DICATAM – Università degli Studi di Brescia
Abstract
There is a wide literature focused on how to design new bus stops, but the research on how to review and assess quality and safety of existing bus stops is, so far, still less developed.
Therefore, this paper highlights the need for in field inspections of existing bus stops and illustrates a possible methodology to assess and review them.
The paper further develops a Road Safety inspection methodology for existing bus stops. Particularly, starting from the inspection methodology, the paper describes how it is possible to handle data collected during bus stops inspections to perform a more comprehensive review of the bus stops, in terms of Road Safety, Security, Comfort and Accessibility levels. The technique was successfully applied to some bus lines in the Province of Brescia (Italy), and can be easily transferred to other contexts. Through the use of a Geographical Information System (GIS), informative layers were built, and thematic maps were realised.
The assessment can then be used by technicians and decision makers to plan and prioritise interventions on the infrastructure.
Keywords: Sustainable mobility; Public transport; Bus stops; Road safety; Inspections; Accessibility; GIS
1. Public Transport and Road Safety
Nowadays, there are still many bus stops, especially outside the city centres, that do not satisfy minimum safety requirements. Bus stops are complex realities, and especially on interurban bus lines they are often located in problematic contexts such as roads with high
Corresponding author: Silvia Rossetti ([email protected]). The authors jointly designed and
contributed to the paper. Conceptualization, S.R; Literature review, S.R.; Data curation, investigation and validation, S.R., Methodology, S.R. and M.T.; Supervision, M.T.; Writing - original draft, S.R.; Writing - review and editing, S.R. and M.T. Both authors have read and agreed to the published version of the manuscript.
traffic levels, or scarcely accessible for pedestrians. But the design of the public transport network is crucial since it plays a key-role in daily transports sustainability.
The present paper describes some developments in a research published by Tiboni & Rossetti (2013), which proposed a Road Safety inspection methodology for existing bus stops. Starting from those inspections, a technique to assess bus stops was elaborated, and it is here presented. Even if the assessment of the bus stop considers various and comprehensive perspectives (safety, security, comfort and accessibility – as explained in section 3), the first issue of the methodology is still to tackle road safety of public transport.
Why is there a need to focus on public transport and bus stops safety? Research published on bus accidents is not extensive (af Wåhlberg, 2004; Porcu at al., 2020); probably because it is generally accepted that public transport helps in increasing Road Safety, by reducing the use of individual motorised vehicles (Brenac & Clabaux, 2005). For example, according to White, Dennis & Tyler (1995) «...bus and coach accidents are a very minor problem», and Cafiso, Di Graziano & Pappalardo (2013) argue that «...bus-related accidents are marginal events in the context of road safety. Bus crashes account for only 1% of total road fatalities...». There is no doubt that increasing the use of public collective transport decreases the exposure to road accidents risk in the risk equation, that describes road accidents risk as the product of hazard, vulnerability, and exposure.
However, Allsop and Turner (1986) studied the relationships between the number of road casualties and public transport fares in London, showing that in the early '80s a near-doubling of fares led to an increase in the number of road traffic injuries. Therefore, public transport policy influences not only patterns of travel, but also the number of casualties in road accidents (Allsop, 1993).
Furthermore, the role played by the indirect involvement of buses in road accidents should also be considered. As stated by Brenac & Clabaux (2005), «...the indirect involvement of buses in traffic accident processes should not be regarded as negligible... This indirect involvement appears to fall within two main categories: (i) bus constituting a sight obstruction, and (ii) bus focusing the attention of a pedestrian who crosses hurriedly to catch it. Preventive measures concerning the infrastructure and transport system seem possible».
Therefore, focusing on preventive measures, the paper applies a road safety inspection technique to existing bus stops, and proposes a methodology to assess the safety, security, accessibility and comfort level of each inspected stop. Bus stops are the initial and the terminal points of other types of movements, and bus passengers are also vulnerable road users at each end of the bus trip (Transport for London, 2006; Maternini, 2009; Rossetti et al., 2020). Therefore, bus stops are crucial points of the public transport system and they highly contribute to increasing its attractiveness, both in terms of quality, accessibility, and safety levels. Bus stops need to be carefully designed to ensure maximum safety for all the roads users, and especially for the most vulnerable.
Within this framework, this paper adopts a technique to perform Road Safety Inspections of bus stops, and to comprehensively assess safety, but also security, comfort, and accessibility of bus stops. The early stages of the proposed methodology are in depth described in Tiboni & Rossetti (2013), and they are based on an inspection table, to be filled-in by experts and technicians during on-site inspections of bus stops. The inspection sheet is quite comprehensive, and it is divided into 5 main sections: general information, road features, bus stop features, accessibility and perceived safety.
The general information section contains data such as the location of the bus stop, the day and the time of the inspection, the name of the bus stop, a map, some pictures and the layout of the stop. The section on road features collects all the information regarding the geometrical and dimensional aspects of the road on which the bus stop is located, namely the road hierarchy, the number of lanes, the speed limit, the availability of zebra crossings, of footways, cycle lanes... The bus stops features section contains data on the geometrical features of the stop itself (e.g. width and length of the stop area and of the road markings), its equipment (e.g. shelter, benches, timetables, artificial lighting...), and the features of the waiting area. The section on accessibility issues gathers information on the pedestrian and cycle paths to access the stop, and on eventual interchange infrastructures. Finally, the perceived safety section detects information regarding the context in which the stop is placed and that can increase the safety perceived by the users.
The inspection methodology was tested and applied on 166 bus stops located on two demo interurban bus lines in the Province of Brescia, in the North of Italy, as reported in Tiboni & Rossetti (2013). More recently, the inspection methodology has been tested and validated also for some bus stops located within the urban area of the city of Brescia, providing further data and results to integrate the analysis.
2. A Methodological Approach to Review Bus Stops
But now how is it possible to define the safety level of the inspected bus stops? Which criteria should be used to assess and rank bus stops? There is a wide literature focused on how to design bus stops, but the research on how to assess quality and safety of existing bus stops is, so far, still less developed (see, i.a., Barabino, 2018).
Therefore, this section aims at defining a technique to review the performance of bus stops, starting from data gathered during the previous described safety inspections (as proposed in section 1).
The assessment can be performed by creating an index that measures the quality of each stop, merging together different aspects and features.
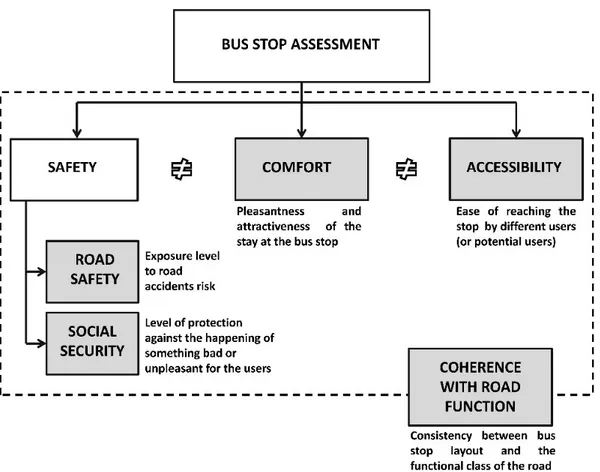
But, creating only an overall summary index of each bus stop may lead to an oversimplification of the problem, and reduce the quality of the information provided. For instance, a bus stop may be very well designed and equipped but, likewise, be poorly accessible for the users: as figure 1 shows, different aspects should be taken into account when assessing a bus stop. For instance, Safety should be considered both in terms of Road Safety and Social Security. On one hand, Road Safety is the freedom from danger and risk, and can be defined as the exposure level to road accidents risk. On the other hand, Security refers to an individual’s feeling of well being and to the level of protection against the happening of something bad or unpleasant for the users, like bag-snatchings and vandalism. Then, the level of Comfort, as pleasantness and attractiveness of the waiting time at the bus stop should be addressed. Finally, Accessibility should be taken into account, to assess the ease of reaching the stop by different users or potential users, and especially by the most vulnerable users like pedestrians and cyclists (Tira, 1999).
Figure 1: Different features that contribute to the bus stop review
Therefore, the proposed methodology considers four main indexes that together contribute to the overall assessment of each bus stop:
• I1 Road safety Index; • I2 Security Index; • I3 Comfort Index; • I4 Accessibility Index.
Furthermore, all the proposed assessment indexes should then be analysed with a focus on the consistency between the bus stop layout and the functional class of the road (fig.1). The functional classification of roads is a fundamental tool both for urban development and for road management. The classification system ranks streets into different groups according to the type of service each group is meant to provide. A street network performs more efficiently and safely both from a traffic operations and a road safety perspective if roads are designated and operated to serve their intended purposes.
Each index is estimated on a 0-1 scale, where a higher value corresponds to a better (safer, more secure, more comfortable or more accessible) stop. The methodology bears on the allocation of partial scores to the elements that contribute to the quality or the safety of the bus stop. Each index can be calculated using the eqn (1).
Where:
I is the final safety evaluation index that has to be estimated;
n is the number of the elements that are used to allocate partial scores; k is the partial score allocated to the element i;
p is the weight assigned to the element i (note that∑ p = 1).
The elements to be considered, the partial scores and the weights should be defined in strong cooperation with the administrative bodies and the decision-makers that manage public transport services and road infrastructures. However, in the following sections a proposal is developed, bearing in mind that other solutions are possible. Features, partial scores and weight have been defined keeping in mind the reality in which they were applied (in this case interurban bus lines within a provincial territory): in other context they may need a calibration. Furthermore, it has been decided to keep the construction of the indices as simple as possible, to facilitate their application and their transferability to other contexts. The aim of the methodology is to detect the most critical stops that will need intervention: the investment proposal is therefore a subsequent step.
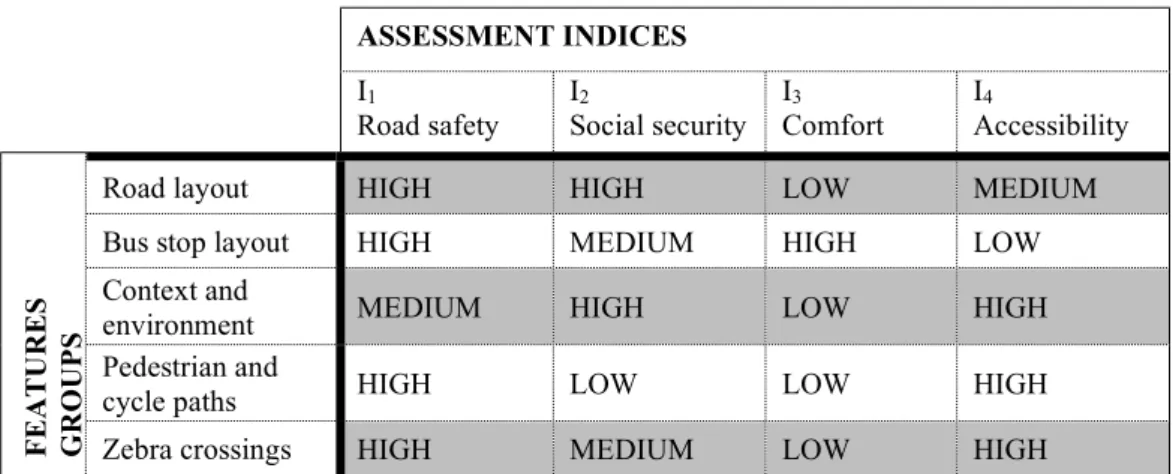
First of all, it is necessary to define which is the weight that different features group (like road layout, bus stop layout, context, pedestrian and cycle paths) have on the four main indexes. Table 1 provides this analysis and will be used as a reference to develop the construction of the indexes.
ASSESSMENT INDICES I1
Road safety ISocial security 2 IComfort 3 IAccessibility 4
F E A T U R E S G R O U P S
Road layout HIGH HIGH LOW MEDIUM
Bus stop layout HIGH MEDIUM HIGH LOW
Context and
environment MEDIUM HIGH LOW HIGH
Pedestrian and
cycle paths HIGH LOW LOW HIGH
Zebra crossings HIGH MEDIUM LOW HIGH
Table 1: Influence of different features on the four bus stop assessment indexes 3.1 Road Safety Index
A crucial element in a bus stop layout is its Safety. The Road Safety index aims at assessing the road safety level of a bus stop, focusing on the exposure level to road accidents risk. Pedestrians, bus passengers, buses, and private vehicles can all be involved in concerns for safety at or near a bus stop. The bus stop must be located so that passengers may alight and board with reasonable safety. But the stopped bus can affect sight distances for pedestrians using the crosswalk and for parallel and cross traffic vehicles. Therefore, the road safety index is highly influenced by the features of the road, by the pedestrian and cycle paths and by the zebra crossings. Furthermore, the bus hinders the traffic stream as it enters or leaves a stop.
But, which are the main features that affect road safety at bus stops and how do they actually influence safety?
Concerning road features, traffic speed is of course one of the main Road Safety threats, especially in areas where pedestrians and unprotected road users move or stand, like bus stops. Vulnerable road users such as pedestrians, cyclists and moped riders have a very high risk of severe or fatal injury when they are hit by motor vehicles. And higher speeds increase the risk of a crash for a number of reasons. First of all, speed influences the field of vision and the perception of the road: a pedestrian has a very wide range of view, while a car driver focuses automatic further ahead, and his field of vision is reduced. The higher the driving speed, the narrower is the view of the road. And, if the visual field is too narrow, visibility of road margins, where vulnerable road users stand and bus stops are located, will be very limited. Several studies (see i.a. Pasanen, 1992; Davis, 2001; OEDC/ECMT, 2006; GRSP, 2008; Rosén & Sander, 2009) demonstrate that the probability that a pedestrian will be killed in a car accident dramatically increases with impact speed. The research shows that while most vulnerable road users survive if hit by a car travelling 30 km/h, the majority are killed if hit by a car travelling at 50 km/h. Furthermore, the highest is the driving speed, the highest is the stopping distance for a vehicle, in terms both of reaction distance and braking distance. Therefore, traffic speed must be considered while assessing bus stops safety. Unfortunately, operative speed measures (like v80, the 80th percentile speed) cannot be easily measured as part of the bus
stop inspection. Thus, the speed limit of the road where the bus stop is located can be used as a reference for the Road Safety index.
The location of the bus stop highly affects its safety as well. Bus stops can be located immediately before a crossroad or a signal (near-side stops), immediately after a crossroad (far-side stops), or in the midway (midblock stops) (Transportation Research Board, 1996). From a strictly Road Safety point of view, midblock stops located on straight stretches are the safest, because they minimise sight distance problems for both vehicles and pedestrians, they reduce conflicts with crossing traffic, and they may result in passenger waiting area with less pedestrian congestion. But, especially in urban areas, the high number of crossroads may cause difficulties in finding a proper location for the bus stop. And far-side and near-side stops provide other advantages. First of all, near-side and far-side stops are closer to the crossroad, therefore they provide an easier access to the surrounding area. In far-side stops, passengers are more encouraged to cross behind the bus more safely, but buses may obscure sight lines for pedestrians and vehicles crossing the intersection. On the contrary, near-side stops allow passengers to board while the bus is stopped at red light and provide the driver a full view of the intersection activity, but they may facilitate conflicts between the bus and right-turning vehicles, may obscure sight lines for pedestrians and general traffic, and buses stopping and near-side stops may obstruct traffic (Transportation Research Board, 1996; DVRPC, 2012). Distances from road bends should also be considered, to avoid visibility problems for upcoming vehicles. The bus stop should be located far from those, to ensure that vehicles have enough visibility to see the stopping bus and to brake before hitting it. Finally, a last issue affecting road safety and concerning the location of the bus stop is the relative position of bus stops at the two sides of the same road, in the two directions. Corresponding bus stops should be located not exactly opposite each other but a bit postponed to facilitate the correct location of the zebra crossing, which must be always placed behind the stopping bus to let upcoming vehicles see pedestrians approaching. If corresponding bus
stops are not postponed, the zebra crossing may be wrongly placed and cause danger for pedestrians crossing the road.
Other issues that influence safety at bus stops are related to signages. Bus stops should be clearly visible and marked both with road markings and signposts. The bus stop marking on the carriageway is used to define the limits of the bus stop. This delimited area should be unobstructed to allow easy entry and exit for the bus. Within this delimited area, stopping by vehicles other than buses is not allowed (Transport for London, 2006). Then, the bus stop should be marked by a bus stop post and flag. The bus stop post indicates to the passengers where they should stand while waiting for the bus. It also serves as a marker to drivers to indicate where the bus should be positioned at the stop. The sign should not be obstructed by trees, buildings, advertisements or other signs. Bus stops can be accommodated with various roadway configurations and may fall into two major categories: in-line and off-line with respect to the roadway. Kerbside stops are in-lane stops and are still the most common bus stop type. The bus area is accommodated in the road, into the normal flow of traffic. Therefore, pedestrians are less protected and may be more exposed to the traffic than with other bus stops types. Bus borders are another type of in-lane stops and provide a convenient platform for passengers, reducing the interference with pedestrians moving on the footway. Bus bays are a location off-line with respect to the travel lanes, and they provide a protected area from moving vehicles for both the stopping bus and the bus users. Finally, open bus bays are a variation of the bus bay, that provides more manoeuvrability toward the upstream side of traffic flow (Transport for London, 2006).
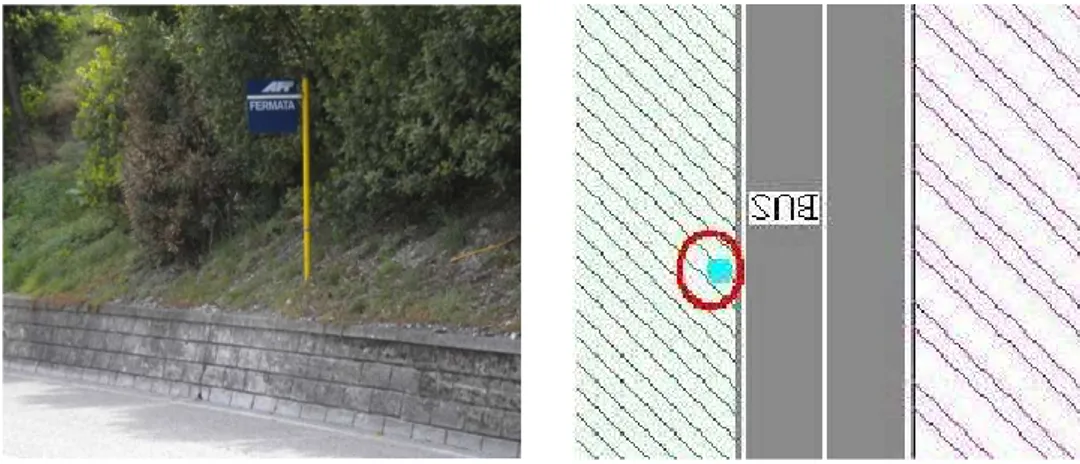
Ideally the layout of the passenger waiting area should be based on the footway, around the position of the bus stop signpost. This area should be protected from the traffic, and footway width should be increased. If the waiting area is on the road shoulder and there is no footway, the waiting area may be occupied or invaded by vehicles, resulting in a high exposure of pedestrians to the traffic. It may also happen that the waiting area is completely missing (figure 2).
Figure 2: Examples of bus stops with a lack of waiting area for passengers
Furthermore, pedestrian facilities to reach the bus stop should be appropriate to the expected usage, with adequate crossing opportunities and a sufficient width of pedestrian footway. If there is a lack of adequate footway provision on the pedestrian desire lines that reach a bus stop, pedestrians will be forced to walk in the carriageway. This increase pedestrians' exposure to traffic and road accidents risks, and safety levels
sharply decrease. Also pedestrian crossings should have an adequate width, and they should also be placed behind the stopping bus, to guarantee that upcoming vehicles see pedestrians approaching the crossing. Road crossings should also be marked with a signpost, especially in rural roads. Finally, also the presence of cycle paths influences Road Safety at bus stops. If there is a cycle path, it should continue also at the bus stop and should be lifted up to the footway level.
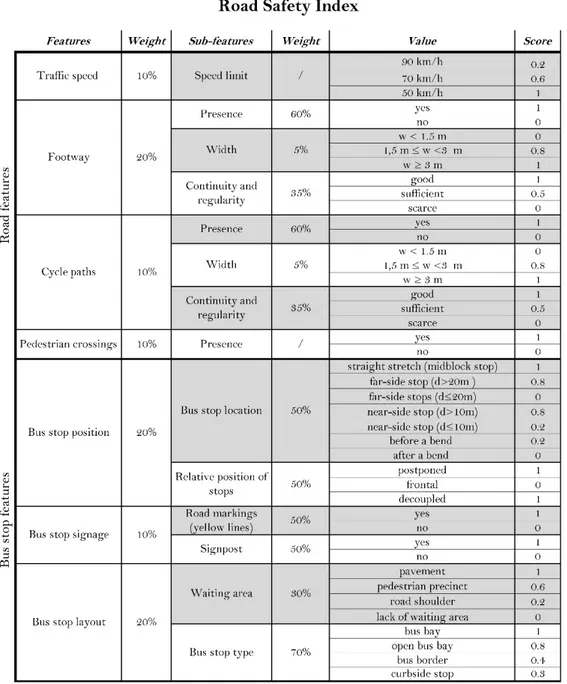
To sum up, table 2 shows the proposed list of features and weights that can be applied to define the Road Safety Index of each bus stop.
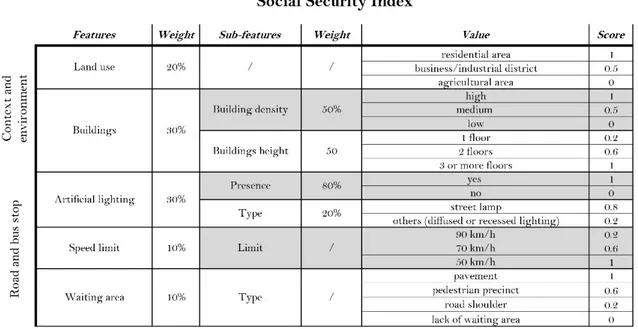
3.2 Security Index
Passenger security is a major issue in bus stop design and location, because design and location of the bus stop can positively or negatively influence a bus user's perception of that stop. Therefore, the Social Security index aims at assessing the protection level against the happening of something harmful or unpleasant for bus users, like bag-snatchings or vandalism. Security is affected by lighting at bus stops, bus stops visibility from the street and from nearby land uses and bus stop locations with hiding places. Security involves neighbourhood residents, bus users, and bus drivers.
Bus stops should be placed in highly visible sites, that permit approaching bus drivers and passing vehicular traffic to clearly see the stop. Furthermore, they should be located next to existing land uses that enhance surveillance of the site. According to Jane Jacobs and her theory of “Eyes upon the street” (Jacobs, 1961), urban structure influences the perceived security: high densities and tall buildings close to the bus stop increase the perceived security because residents can see what it is happening at the bus stop. Also traffic speed affects the numbers of “eyes upon the street” and influences the security level. Drivers can control and see what is happening at the bus stop depending on their speed.
Lighting is another essential factor: it increases visibility and the perception of security for the users. Good quality lighting ensures that pedestrians and bus stop passengers are visible during the hours of darkness. Bus stops, whenever possible, should be coordinated with existing street lighting to improve visibility.
Factors that contribute to the social security index and the assigned weights are listed in the following table (table 3).
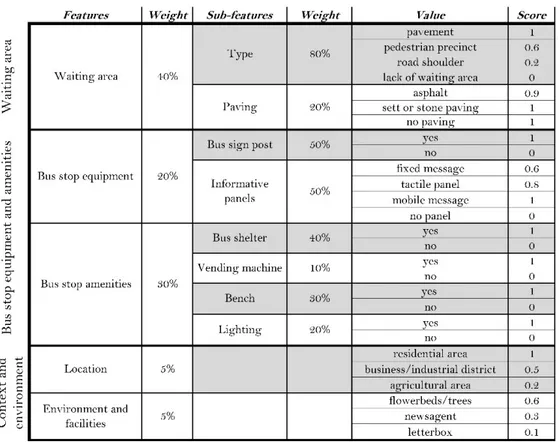
3.3 Comfort Index
The Comfort Index refers to the pleasantness, attractiveness and convenience of the waiting times at the bus stop: it investigates the presence of shelters, bus stop amenities that provide or increase comfort, facilities and all the elements that contribute to enhancing bus users convenience at the stop. This index is mainly built by the so called curb-side factors (Transportation Research Board, 1996). Curb-side factors are located off the roadway and address community integration, placement of bus stops, bus shelter and amenities such as lighting, benches, vending machines, bus route and schedule information...
First of all, the structure of the waiting area has to be considered, both in terms of typology and paving. Then, the equipment in terms of signposts and informative panels contributes to increasing convenience: it helps in identifying the bus stop itself, it is very useful for first time bus riders, and can communicate general system information.
The bus shelter plays a crucial role in the comfort index as well, mainly because it provides protection and relief for waiting passengers, especially from the weather: sun, wind, rain. Other amenities that influence the comfort level are benches, that provide a place to sit while passengers wait for the bus. Then, lighting also increase the perception of comfort for passengers, as well as ticket machines.
The full list of the factors assessed by the proposed comfort index is listed in Table 4.
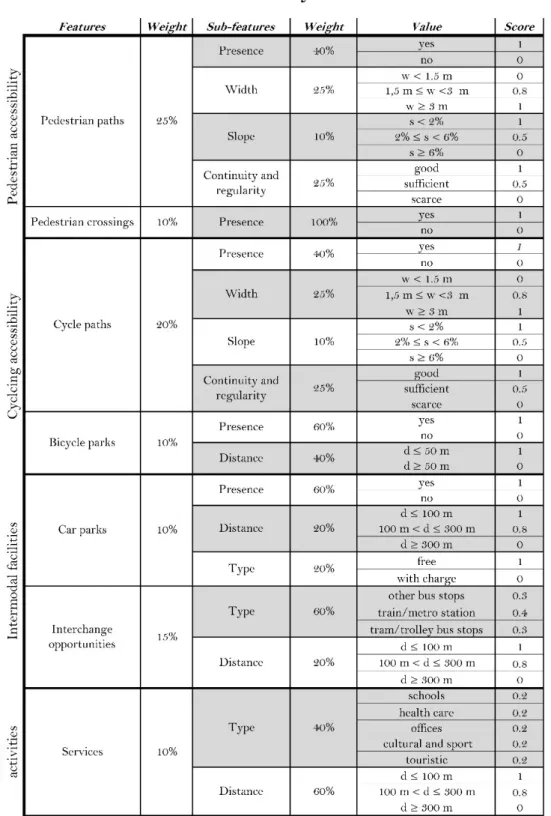
3.4 Accessibility index
The Accessibility Index (Table 5) aims at assessing the ease of reaching the stop by different users or potential users, and especially by vulnerable users like pedestrians and cyclists. Therefore, the index is built considering pedestrian accessibility, cycling accessibility, intermodal and parking facilities. Accessibility index differs from Safety, Security and Comfort indices mainly because it is focused not only on the bus stop point, but rather on its close surroundings and on the urban environment.
Considering accessibility from a wider perspective and focusing on the accessibility level that the bus stop itself guarantees to different public services, facilities and activities in its surroundings, also the availability of nearby facilities (like schools, hospitals, public offices, cultural, sport and accommodating facilities) can influence the accessibility index (Gargiulo et al., 2018; Zazzi et al., 2018; Tiboni & Rossetti, 2014; Carpentieri et al., 2020).
How is it possible to improve bus stop access from a pedestrian-friendly point of view? Providing a defined access to and from the bus stop is very important. Access to the bus stop from the origin of the movement should be as direct as possible: bus passengers need efficient ways to reach the bus stop from their residences or points of origin. The influence radius of a bus stop is ideally 400 m. Sidewalks and protected access ways should link the bus stop with its surroundings, and bus users should not have to walk through grass or exposed soil to reach the bus. The overall walkability of the urban environment (Dovey et al., 2017; Conticelli et al., 2018; Campisi et al., 2020).
Furthermore, as part of a Sustainable Mobility strategy, it is desirable to encourage people to cycle. This can be done by improving bicycle accessibility conditions to bus stops. And, granting access to public transport to cyclists helps in increasing public transport patronage. Bicycle use can widely increase the catchment area of a bus stop. Cyclists on flat surfaces travel at 15-20 km/h, fourfold the average speed of a pedestrian (4 km/h): assuming a 5 minutes access-time to bus stops the radius of influence by bicycle is 1.6-2 km, and the catchment areas is about 25 times the pedestrian one. Therefore, integration between bus and bicycle should be highly encouraged: a good connection with cycle lanes and cycle parking facilities is vital to ensure an easy access to bus stops for cyclists.
Also other intermodal opportunities foster accessibility: interchange with other transit modes or with private cars, should therefore be facilitated.
Finally, the availability of close public services and facilities has to be considered, both in terms of type and distance from the stop (Bonotti et al., 2015; Rossetti, 2020).
3.4 Coherence with the Road function
To wrap up the proposed description of the various indices and of the entire methodological approach, a last aspect should be evaluated (see fig. 3): the different features previously investigated have to be finally verified in relation to the function of the road on which the bus stop is located (see, i.a., Busi and Zavanella, 2002; Barabino et al, 2020).
Roads should be designed to serve for a defined function. The function typically depends on the distance of travel, on the level of traffic flow and on the desired speed of travel. Road networks should therefore reflect the development of a hierarchy of roads, with the primary network at the highest level and residential roads at the lowest. The functional classification plays a crucial role not only from the transport planning perspective, but from the urban planning one as well.
Even if the functional classification of roads is defined at National level, the road function can be usually divided into three main groups: arterial roads, distributor roads, and access roads. However, for the purpose of the present paper, bus stops should respect each National law and be coherent with the National classification system. Therefore, the coherence of the bus stop with the road function should be locally assessed, and it is not possible to define an overall table with features and weights to be considered, everywhere valid.
3. Application of the methodology
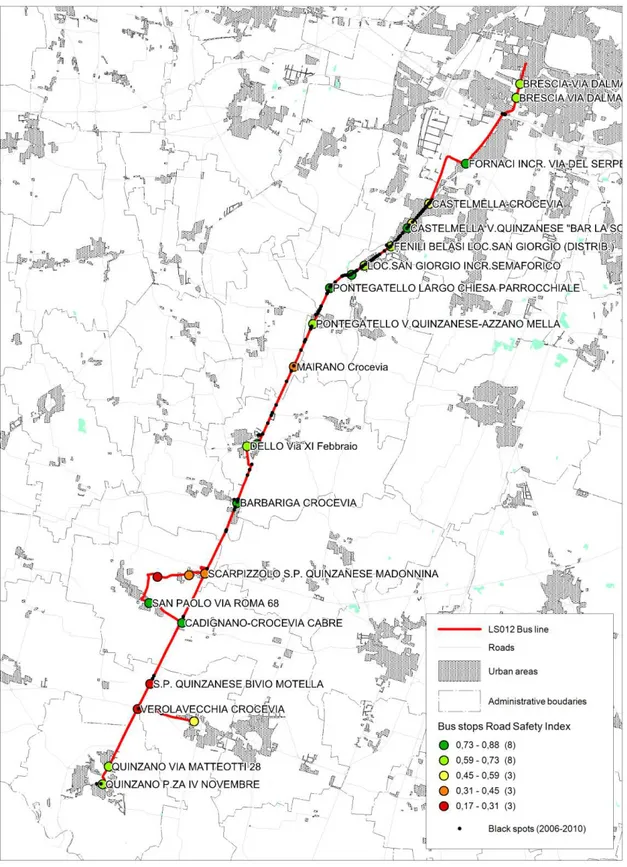
The technique was applied to each stop on two demo lines in the Province of Brescia (Italy) surveyed during the Road Safety Inspections phase (section 1). Firstly, it was tested on the Slink202 “Brescia-Salò-Gargnano-Arco” bus line, and then validated on the line LS012 “Brescia – Quinzano”. Furthermore, using a Geographical Information System (GIS), it was possible to link the value of each index to the location of the bus stops, and to represent it in thematic maps.
For example, fig. 5 shows the map related to the bus stop Road Safety index applied to the LS012 bus line, which is just one of the thematic maps that could be realized. It highlights the values of the Road Safety index (from 0 to 1), allowing an immediate reading key of the most critical stops, represented in red. From a planning perspective, the map can therefore support decision makers in planning and prioritizing possible interventions on the bus stop and road layout, starting from the ones with lowest values.
Furthermore, in the map the informative layer containing the geographical location of road accidents (categorized by the authorities as accidents that saw at least one injured) for the period 2006-2010 was also added: this is particular useful to match the location of bus stops with the so called “black spots” for the given period, in order to further support the identification of the possible threats.
Similar thematic maps were developed also for the other indexes described in the paper (security, accessibility and comfort), to support a comprehensive and comparable assessment of the existing bus stops environment.
4. Discussion and final remarks
A great deal of manuals and guidelines focused on how to design new bus stops are available (see i.a. Bresciani et all, 2012; TRB, 1996; Transport for London, 2006; Maternini & Foini, 2009; VSS, 1993). But the proposed approach focuses on the assessment of existing bus stops, with reference to their safety, security, comfort and accessibility levels and to the coherence with the road function.
Of course, the approach presents some limitations due to the fact that weights and scores were assigned subjectively by the authors, even if coherently to literature argumentations provided in the paper and to technical issues. However, the validation and calibration of the process highly depends on national laws and on the local contexts and conditions in which the methodology is applied. Therefore, the weights and the scores applied in the paper can be seen as reference values, but could then be adapted by the experts and technicians basing on the specific focuses of analysis in the specific contexts of application.
However, from a planning perspective, the value of the proposed approach lies more in the structure of the methodology and in the comprehensive list of features to be considered for the assessment, rather than in the single values assigned to weights and scores: the approach is useful to point out and stress the features that should be assessed to conduct a comprehensive analysis and support planning decisions. Specific weights and scores can then be properly adapted to specific contexts, also according to stakeholders considerations (Ignaccolo et al., 2017; Ignaccolo et al., 2019) or applying further research approaches (e.g. through an analytical hierarchy process or through survey on passengers). Public passenger transport service providers can already look at European Norms (e.g. European Committee for Standardization, 2002) for defining, targeting, and measuring the quality of their service: the proposed methodology may support the public authorities that deals with planning and managing the road infrastructures and the urban environment in assessing the quality of the stops. Furthermore, it may represent an easy approach to conduct preventive road safety measures, because it aims at analyzing a bus stop, and at highlighting possible safety threats before an accident takes place. However, it is a useful tool to assess not only road safety, but more in general, the quality of each bus stop: inspected bus stops can be ranked using the value of each index, and this represents an input for technicians and decision makers that should plan interventions on the existing infrastructures.
References
Af Wåhlberg, A.E. (2004), Characteristics of low-speed accidents with buses in public transport: part II. Accidents Analysis and Prevention, 36 (2004), pp. 63-71
Allsop R.E., Turner E.D. (1986),Road casualties and public transport fares in London. Accident Analysis and Prevention, 18 (1986), pp. 147-156
Allsop R.E., London fares and road casualties (1993), Traffic Engineering and Control, 34 (12), pp. 611
Barabino B., Bonera M., Ventura R., Maternini G. (2020), Caratteristiche infrastrutturali e spazi del trasporto collettivo su gomma nel regolamento viario in ambito urbano. Collective road transport infrastructural characteristics and spaces in the urban road regulation. Ingegneria Ferroviaria 75(10), pp. 727-767.
Barabino, B. (2018). Automatic recognition of “low-quality” vehicles and bus stops in bus services. Public Transport, 10(2), 257-289
Bonera M., Maternini G., Parkhurst G., Paddeu D., Clayton W., Vetturi D. (2020), Travel experience on board urban buses: a comparison between Bristol and Brescia, European Transport \ Trasporti Europei, Issue 76, Paper n° 4
Bonotti R., Rossetti S., Tiboni M., Tira M. (2015), Analysing space-time accessibility toward the implementation of the light rail system: the case study of Brescia, Planning Practice and Research, 30(4), pp. 424-442
Brenac, T. & Clabaux, N. (2005), The indirect involvement of buses in traffic accident processes, Safety Science, 43 (2005), pp. 835-843
Bresciani, C., Costa, F., Gerace, A., Popolizio, M., Pugnetti, C., Rossetti, S., Tiboni, M., Zavanella, L. (2012), Le fermate del trasporto pubblico locale. Guida metodologica alla progettazione, RB edizioni: Brescia
Busi R., Zavanella L. (2002), La classificazione funzionale delle strade, Egaf: Forlì Cafiso, S., Di Graziano, A. & Pappalardo, G. (2013), Using the Delphi method to evaluate
opinions of public transport managers on bus safety. Safety Science, 57 (2013), pp. 254-263
Campisi, T.; Basbas, S.; Tesoriere, G.; Trouva, M.; Papas, T.; Mrak, I. How to Create Walking Friendly Cities. A Multi-Criteria Analysis of the Central Open Market Area of Rijeka. Sustainability 2020, 12, 9470
Carpentieri, G.; Guida, C.; Masoumi, H.E. Multimodal Accessibility to Primary Health Services for the Elderly: A Case Study of Naples, Italy. Sustainability 2020, 12, 781 Conticelli E., Maimaris A., Papageorgiou G., Tondelli S. (2018) Planning and Designing
Walkable Cities: A Smart Approach. In: Papa R., Fistola R., Gargiulo C. (eds) Smart Planning: Sustainability and Mobility in the Age of Change. Green Energy and Technology. Springer, Cham.
Davis G.A. (2001), Relating Severity of Pedestrians Injury to Impact Speed in Vehicle-Pedestrian Crashes – Simple threshold model. Transportation Research Record, 1773(1), pp. 108-113, TRB: Washington DC
Delaware Valley Regional Planning Commission – DVRPC (2012),SEPTA Bus Stop Design Guidelines, DVRPC: Philadelphia
Dovey K., Woodcock I., Pike L. (2017) Isochrone Mapping of Urban Transport: Car-dependency, Mode-choice and Design Research, Planning Practice & Research, 32:4, 402-416
European Committee for Standardization (2002), Transportation-Logistics and Services-Public Passenger Transport-Service Quality Definition, Targeting and Measurement. EN 13816
Gargiulo, C., Zucaro, F., & Gaglione, F. (2018). A Set of Variables for the Elderly Accessibility in Urban Areas. TeMA - Journal of Land Use, Mobility and Environment, 53-66.
Global Road Safety Partnership (2008), Speed management. A Road Safety Manual for Decision Makers and Practitioners, GRSP
Ignaccolo M., Inturri G., Giuffrida N., Le Pira M., Torrisi V. (2019), Public Engagement for Designing New Transport Services: Investigating Citizen Preferences from a Multiple Criteria Perspective, Transportation Research Procedia, 37, pp. 91-98 Ignaccolo, M., Inturri, G., Giuffrida, N., Le Pira, M., Torrisi, V., (2017), Structuring
transport decision-making problems through stakeholder engagement: the case of Catania metro accessibility. In Dell'Acqua, G. and Wegman, F. (eds.), Transport
Infrastructure and Systems: AIIT International Congress on Transport Infrastructure and Systems, pp. 919-926. CRC Press
Jacobs J. (1961), The Death and Life of Great American Cities, Modern library: New York
Maternini, G. & Foini, S. (2009) (eds.), Linee guida per la realizzazione delle fermate del trasporto pubblico locale, Egaf: Forlì, 2009.
OECD/ECMT Transport Research Centre (2006), Speed Management Report, OECD Publishing: Paris
Pasanen, E. (1992), Driving speeds and pedestrian safety: a mathematical model. Transport Engineering. Publication 77, Helsinki University of Technology: Helsinki Porcu F., Olivo A., Maternini G., Barabino B. (2020), Evaluating bus accident risks in
public transport, Transportation Research Procedia, Volume 45, 2020, Pages 443-450 Rosén, E., & Sander, U. (2009),Pedestrian fatality risk as a function of car impact speed.
Accident Analysis and Prevention, 41(3), pp. 536-542
Rossetti S. (2020), Planning for Accessibility and Safety, Maggioli, Rimini.
Rossetti S., Tiboni M., Vetturi D., Zazzi M., Caselli B. (2020), Measuring Pedestrian Accessibility to Public Transport in Urban Areas: a GIS-based Discretisation Approach, European Transport\ Trasporti Europei, Issue 76, Paper n° 2, ISSN 1825-3997
Tiboni, M., Rossetti, S. (2013), Implementing a Road Safety Review Approach for Existing Bus Stops. WIT Transactions on Ecology and the Environment, Vol 130, WIT Press, pp. 699-709
Tiboni M., Rossetti S. (2014), Achieving People Friendly Accessibility. Key Concepts and a case Study Overview, TeMA Journal of Land Use, Mobility and Environment, Special Issue, june 2014, pg. 941-951
Tira M. (1999), Comfort, sicurezza e accessibilità, in Paesaggio Urbano, May - June 1999, pp. 58 – 63, Maggioli, Rimini.
Transport for London (2006), Accessible bus stop design guidance, Bus Priority Team technical advice note BP1/06
Transportation Research Board – TRB (1996), TCRP Report 19. Guidelines for the Location and Design of Bus Stops, National Academy Press: Washington D.C,1996. Vereinigung Schweizerischer Strassenfachleute – VSS, Technische Regelung SN 640 880
Bushaltestellen, VSS: Zurich
White, P., Dennis, N. & Tyler, N. (1995), Analysis of recent trends in bus and coach safety in Britain. Safety Science, 19(1995), pp. 99-107
Zazzi M., Ventura P., Caselli B., Carra M. (2018). GIS-based monitoring and evaluation system as an urban planning tool to enhance the quality of pedestrian mobility in Parma. In Tira M., Pezzagno M. (eds.), Town and Infrastructure Planning for Safety and Urban Quality: Proceedings of the XXIII International Conference on Living and Walking in Cities, CRC Press, Taylor and Francis group, London, pp. 87-94