~Centro Ricerche Bologna
NNFISS - LP2 - 063
R
1 di 16Titolo
Updated design of the IRIS nuclear reactor seismic isolation system and seismic analysis in beyond project design condition
Descrittori
Tipologia del documento: Rapporto tecnicofTechnical Report
Collocazione contrattuale: Accordo di programma ENEA-MSE: tema di ricerca "Nuovo Nucleare da Fissione"
Argomenti trattati: Reattori nucleari ad acqua, Sismica/Water Nuclear Reactors,
Seismic
Sommario
This document updates the document [1]: ACS - P9LU - 001. Only the new results are included here.
The isolation frequency was chosen in the document mentioned before and it will be maintained in order to keep the maximum horizontal displacement close to 1OOmm.Thus the global stiffness ofthe isolation system must be maintained (1570kN/mm).
This document besides presents the numerical analysis results performed in order to investigate the maximum peak ground acceleration that can be accepted by the isolation system in case of beyond project earthquake, without failures and maintaining the normal functionality.
Note Copia n. In carico a: NOME 2 FIRMA NOME FIRMA
o
EMISSIONE~5)
,
9
/2
0
1/ I--N_O_M_E--t_A_'-,P"ong_g_ia-+_-=,tMn_ti_._F_o_rn."Ji-,...-+--.,-P~-::.-M_e_l---o_nI _iFIRMA
j
'
(/
.
j1/
L
~
I
y~
-REDAZ{ONE CONVALIDA APPROVAZIONE
DESCRIZIONE DATA
Centro Ricerche Bologna
NNFISS – LP2 - 063
0
R
2 16
Index
Introduction ... 3
Isolator characteristic ... 4
Position of the isolators ... 4
Numerical results ... 7
New isolator model ... 12
Analysis ... 14
References ... 16
Centro Ricerche Bologna
NNFISS – LP2 - 063
0
R
3 16
Introduction
This document updates the document [1]: ACS – P9LU – 001. Only the new results are included here.
The isolation frequency was chosen in the document mentioned before and it will be maintained in order to keep the maximum horizontal displacement close to 100mm. Thus the global stiffness of the isolation system must be maintained (1570kN/mm), but a new type of isolators was selected and the analysis performed in [1] repeated.
This document, besides, presents the numerical analysis performed in order to investigate the behaviour of the isolation system when an earthquake with a PGA higher than the design value occurs.
The IRIS isolation system was designed [1] for peak ground acceleration (PGA) of 0.3g, but, as the recent earthquake that stroke the Fukushima nuclear plant demonstrated, it is possible that the design PGA should be overcome.
Scope of the second part of the document is to investigate the possibility that an earthquake with a PGA higher than 0.3g can be accepted by the isolation system without failures and maintaining the normal functionality.
During the test on the isolator designed for the IRIS isolation system [2] and [3] it was found that the shear strain design value (100% shear strain, corresponding to a 100mm displacement) can be overcome and a value three times the design one, namely 300mm, can be accepted by the isolator without any damage.
Based on this value a parametric analysis on the PGA was performed, until 300mm displacement is reached, scaling the maximum value, but keeping the same time histories used in [1].
A different isolator model was implemented to better reproduce the hysteretic cycle at a
displacement level three times of the design project, because at this level of deformation the usual linear model is no more valid.
Centro Ricerche Bologna
NNFISS – LP2 - 063
0
R
4 16
Isolator characteristic
Following the recent development in the isolator manufacturing, it is possible to increase the isolator diameter up to 1300mm. This leads to a smaller numbers of isolators and more freedom in their lay-out.
The new isolators will be specially designed and manufactured.
After some preliminary evaluation it was decided to use two different types of isolators (diameter 1000mm and 1300mm). Different configurations were studied in order to optimize the lay-out avoiding torsion effect in the structure. The chosen new configuration includes 64 isolators diameter 1300 and 35 diameter 1000: total 99 isolators.
All the isolators will have a rubber height of 100mm this because the maximum displacement reached during the SSE must be about 100% of shear strain.
The horizontal isolator stiffness is Kh = GA/T where:
G = rubber shear modulus depending on the rubber compound, A = rubber area,
T = rubber total height
Considering the diameters, T = 100mm and G = 1.4MPa (hard rubber compound), Kh results 11.0
KN/mm for the 1000 diameter and 18.6 KN/mm for the 1300 diameter. The global horizontal stiffness is 1574 KN/mm very close to the target value.
Summarizing the isolators characteristics are: Rubber diameter: 1000mm,
Max vertical load: to be decided , Max horizontal load: to be decided Horizontal stiffness: 11.0 kN/mm,
Vertical stiffness: 7150 kN/mm (to be confirmed), Rubber height: 100mm,
Rubber diameter: 1300mm, Max vertical load: to be decided , Max horizontal load: to be decided Horizontal stiffness: 18.6 kN/mm,
Vertical stiffness: 12000 kN/mm (to be confirmed), Rubber height: 100mm.
Position of the isolators
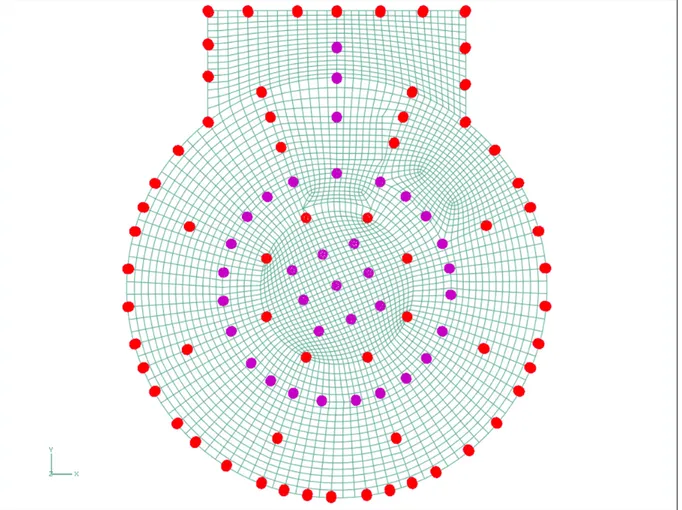
The isolators must be positioned in order to have the centre of stiffness as close as possible to the centre of gravity to avoid torsion effect. Another important condition is that the vertical load must be distributed on the isolators as uniformly as possible to avoid concentrated vertical load on some of them.
After some analysis it was chosen the configuration shown in the picture 1 below. The vertical load due to the dead weight on them varies from 5200 to 12200 kN. The centre of gravity is almost coincident with the centre of stiffness.
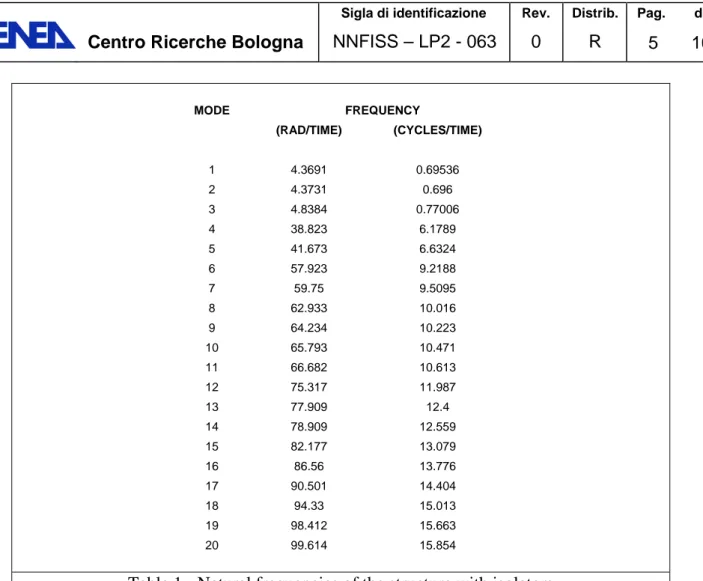
The modal analysis performed on the structure on isolators confirms the design objective were reached.
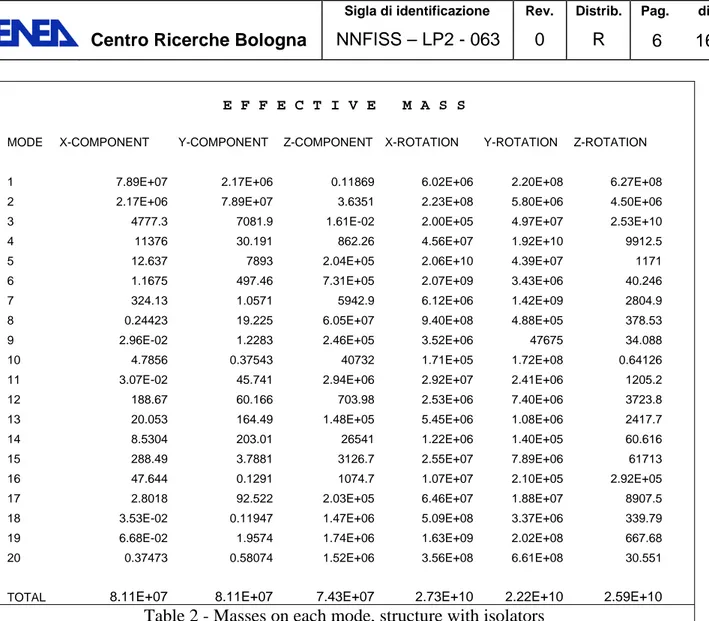
In the table 1 and 2 below we can see that the first two modes are pure translation along X and Y axis, with a very little torsion and they have a frequency very close to 0.7 Hz. All the mass of the structure is on these two modes, thus confirming the dynamic behaviour identical to one degree of freedom oscillator. The third mode is a pure torsion mode around the centre of gravity.
Centro Ricerche Bologna
NNFISS – LP2 - 063
0
R
5 16
MODE FREQUENCY (RAD/TIME) (CYCLES/TIME) 1 4.3691 0.69536 2 4.3731 0.696 3 4.8384 0.77006 4 38.823 6.1789 5 41.673 6.6324 6 57.923 9.2188 7 59.75 9.5095 8 62.933 10.016 9 64.234 10.223 10 65.793 10.471 11 66.682 10.613 12 75.317 11.987 13 77.909 12.4 14 78.909 12.559 15 82.177 13.079 16 86.56 13.776 17 90.501 14.404 18 94.33 15.013 19 98.412 15.663 20 99.614 15.854Centro Ricerche Bologna
NNFISS – LP2 - 063
0
R
6 16
E F F E C T I V E M A S S
MODE X-COMPONENT Y-COMPONENT Z-COMPONENT X-ROTATION Y-ROTATION Z-ROTATION
1 7.89E+07 2.17E+06 0.11869 6.02E+06 2.20E+08 6.27E+08
2 2.17E+06 7.89E+07 3.6351 2.23E+08 5.80E+06 4.50E+06
3 4777.3 7081.9 1.61E-02 2.00E+05 4.97E+07 2.53E+10
4 11376 30.191 862.26 4.56E+07 1.92E+10 9912.5
5 12.637 7893 2.04E+05 2.06E+10 4.39E+07 1171
6 1.1675 497.46 7.31E+05 2.07E+09 3.43E+06 40.246
7 324.13 1.0571 5942.9 6.12E+06 1.42E+09 2804.9
8 0.24423 19.225 6.05E+07 9.40E+08 4.88E+05 378.53
9 2.96E-02 1.2283 2.46E+05 3.52E+06 47675 34.088
10 4.7856 0.37543 40732 1.71E+05 1.72E+08 0.64126
11 3.07E-02 45.741 2.94E+06 2.92E+07 2.41E+06 1205.2
12 188.67 60.166 703.98 2.53E+06 7.40E+06 3723.8
13 20.053 164.49 1.48E+05 5.45E+06 1.08E+06 2417.7
14 8.5304 203.01 26541 1.22E+06 1.40E+05 60.616
15 288.49 3.7881 3126.7 2.55E+07 7.89E+06 61713
16 47.644 0.1291 1074.7 1.07E+07 2.10E+05 2.92E+05
17 2.8018 92.522 2.03E+05 6.46E+07 1.88E+07 8907.5
18 3.53E-02 0.11947 1.47E+06 5.09E+08 3.37E+06 339.79
19 6.68E-02 1.9574 1.74E+06 1.63E+09 2.02E+08 667.68
20 0.37473 0.58074 1.52E+06 3.56E+08 6.61E+08 30.551
TOTAL 8.11E+07 8.11E+07 7.43E+07 2.73E+10 2.22E+10 2.59E+10
Centro Ricerche Bologna
ACS – P9LU - 001
0
R
7 16
Figure 1 – Position of the isolators - Red: diam. 1300 Purple: diam. 1000
Numerical results
The same time histories as in the document ACS – P9LU – 001 were again applied to the structure equipped with the isolators.
Three time histories were applied contemporary with a PGA = 0.3g in the two horizontal directions (X and Y) and with a PGA = 0.2g in the vertical direction (Z).
The results are reported in the figures below.
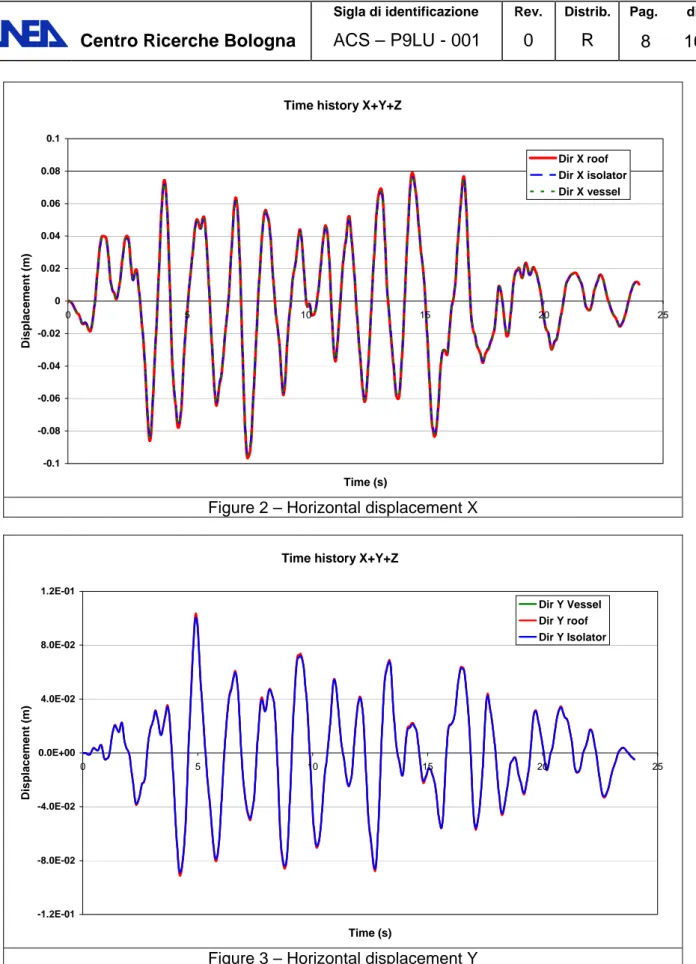
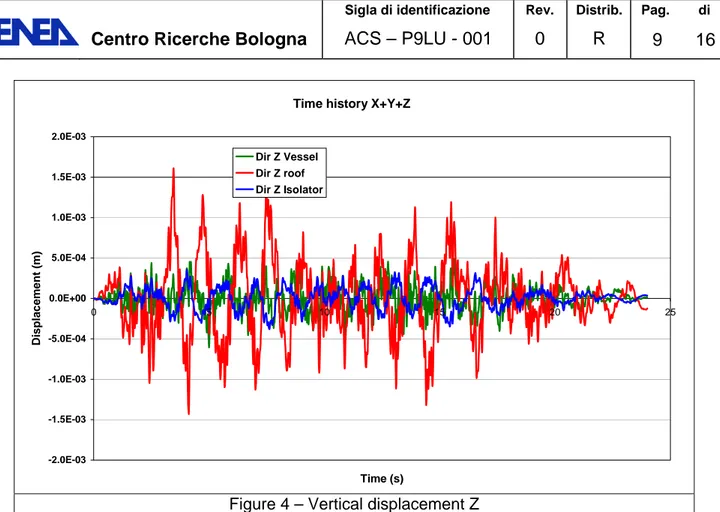
In figure 2 and 3 the displacement of a point on the roof, a point on the vessel and a point just above the isolation system are shown. It is evident that they move all together like a rigid body. In Z direction (figure 4) the isolation system hasn’t any effect, but due to the high stiffness in vertical direction there is no significant amplification of the ground acceleration.
Centro Ricerche Bologna
ACS – P9LU - 001
0
R
8 16
Figure 2 – Horizontal displacement X
Figure 3 – Horizontal displacement Y
Time history X+Y+Z
-0.1 -0.08 -0.06 -0.04 -0.02 0 0.02 0.04 0.06 0.08 0.1 0 5 10 15 20 25 Time (s) D ispl acem en t (m ) Dir X roof Dir X isolator Dir X vessel
Time history X+Y+Z
-1.2E-01 -8.0E-02 -4.0E-02 0.0E+00 4.0E-02 8.0E-02 1.2E-01 0 5 10 15 20 25 Time (s) D is plac eme nt ( m ) Dir Y Vessel Dir Y roof Dir Y Isolator
Centro Ricerche Bologna
ACS – P9LU - 001
0
R
9 16
Figure 4 – Vertical displacement Z
The total horizontal displacement is obtained as the magnitude of the vector Ux, Uy. The result is shown in the picture 5 below. We can see that the maximum displacement is around 100mm as in the previous configuration with 120 isolators.
Figure 5 – Total horizontal displacement
Time history X+Y+Z
-2.0E-03 -1.5E-03 -1.0E-03 -5.0E-04 0.0E+00 5.0E-04 1.0E-03 1.5E-03 2.0E-03 0 5 10 15 20 25 Time (s) Di sp la ce m e n t ( m ) Dir Z Vessel Dir Z roof Dir Z Isolator
Time history X+Y+Z
0.00 0.03 0.06 0.09 0.12 0 5 10 15 20 25 Time (s) D is p la c e me n t ( m ) Vector Magnitude
Centro Ricerche Bologna
ACS – P9LU - 001
0
R
10
16
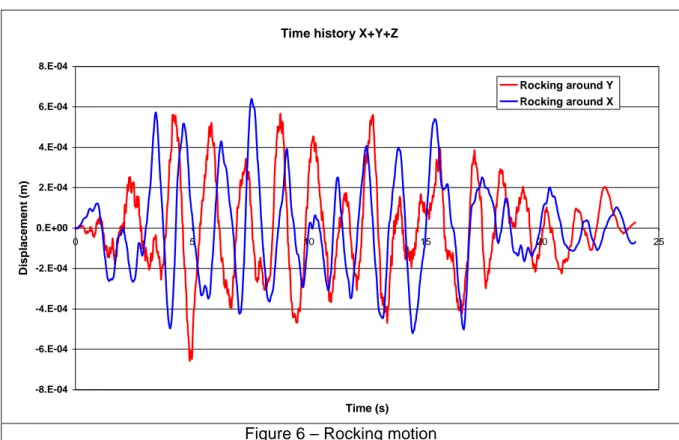
The rocking motion of the building is very small: about 1mm. In the Figure 6 below it is shown the differential displacement at opposite points on the external perimeter of the building, along the two axis (point 450-67 and 417-287, Figure 21 document ACS – P9LU – 001).
Figure 6 – Rocking motion
In figure 7, 8 and 9 the acceleration of a point on the roof , a point on the vessel and a point just above the isolation system is shown in the two horizontal directions X, Y and in the vertical direction Z. It is evident that the results are practically coincident with the ones obtained with the previous configuration. This underlines that the dynamic behaviour of the structure can be evaluated just seeing at the global stiffness of the isolation system, leaving the choice of the number type and layout of the isolators to an economical optimization.
Time history X+Y+Z
-8.E-04 -6.E-04 -4.E-04 -2.E-04 0.E+00 2.E-04 4.E-04 6.E-04 8.E-04 0 5 10 15 20 25 Time (s) D isp la ce men t (m ) Rocking around Y Rocking around X
Centro Ricerche Bologna
ACS – P9LU - 001
0
R
11
16
Figure 7 – Horizontal acceleration X
Figure 8 – Horizontal acceleration Y
Time history X+Y+Z
-2 -1.5 -1 -0.5 0 0.5 1 1.5 2 2.5 0 5 10 15 20 25 Time (s) A c c e le ra ti o n ( m /s 2 ) Dir X roof Dir X isolator Dir X vessel
Time history X+Y+Z
-2.5 -2 -1.5 -1 -0.5 0 0.5 1 1.5 2 2.5 0 5 10 15 20 25 Time (s) A ccel er at ion (m /s2) Dir Y roof Dir Y isolator Dir Y vessel
Centro Ricerche Bologna
ACS – P9LU - 001
0
R
12
16
Figure 9 – Vertical acceleration Z
For what concern the vertical load, combining the dead weight, the vertical load due to the horizontal acceleration (rocking movement) and the vertical load due to the vertical
acceleration we obtain a maximum value of 18200 kN. The minimum value is 426 kN, thus no one of the isolators is in tension during the earthquake.
New isolator model
The usual linear model implemented to reproduce the behaviour of the isolator cannot be considered valid when the displacement is over than about 200% shear strain. This implies that a nonlinear model for the isolator must be implemented in the code; the consequence is that the modal analysis method must be abandoned and a step by step dynamic analysis must be used. This means a large increasing in computing time, being the nonlinear analysis much more time consuming that the linear ones.
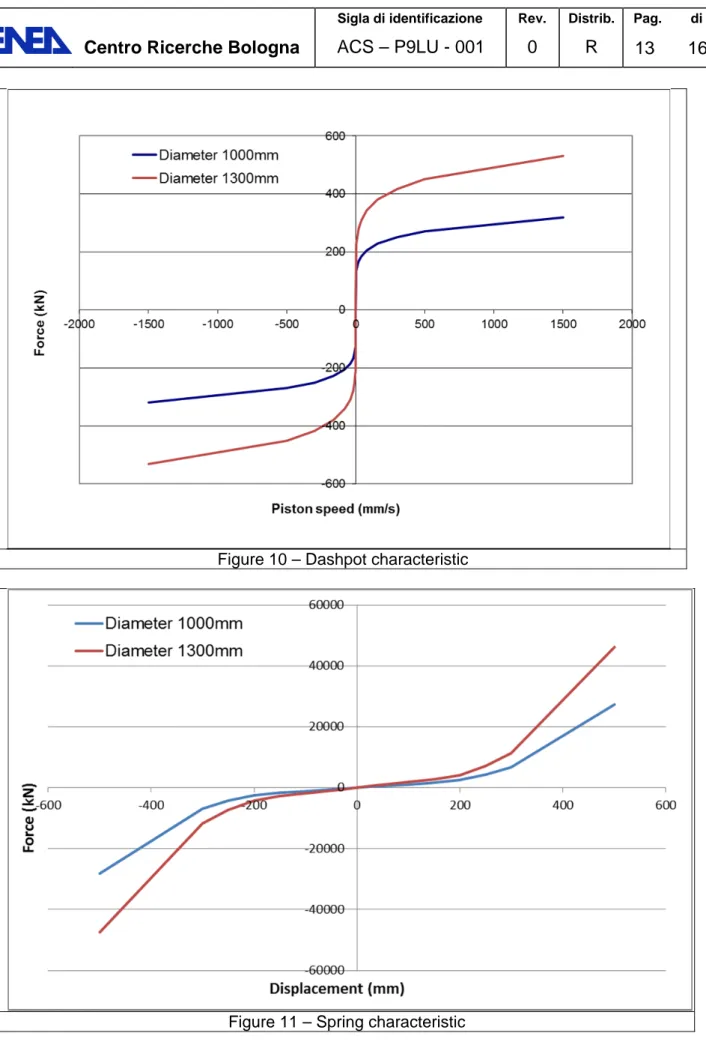
The new model implemented in the code is based on a nonlinear spring coupled, in parallel with a nonlinear dashpot.
The characteristic of the spring and the dashpot are shown in the tables below and are extrapolated from the data collected during the test.
Time history X+Y+Z
-4 -3 -2 -1 0 1 2 3 4 5 0 5 10 15 20 25 Time (s) A c cel e ra ti on (m /s2) Dir Z roof Dir Z Isolator Dir Z vessel
Centro Ricerche Bologna
ACS – P9LU - 001
0
R
13
16
Figure 10 – Dashpot characteristic
Centro Ricerche Bologna
ACS – P9LU - 001
0
R
14
16
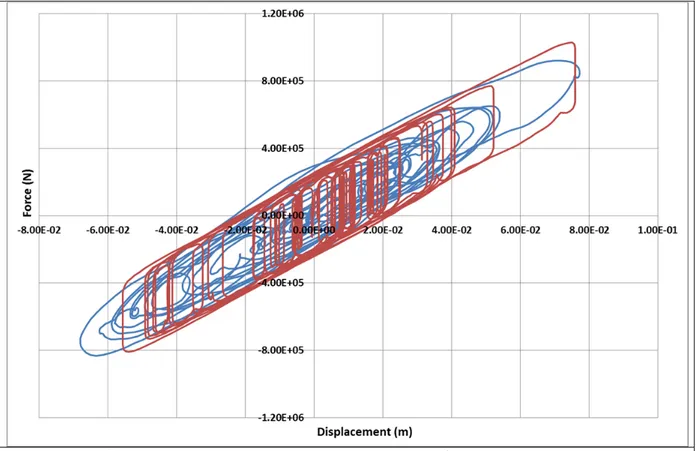
With these characteristic the analysis with a PGA=0.3 was repeated to check if, in the range up to 100% shear strain (100mm), the results are similar to the linear model. In the tables below the hysteretic cycles, linear and nonlinear are compared.
Figure 12 – comparison between the hysteretic cycle of linear and nonlinear model
The results are in good agreement, so the nonlinear model can be used in the parametric analysis.
Analysis
A parametric analysis was performed, keeping the same time history used in [1], but scaling the PGA until the value for the displacement was reached.
As limit value for the isolator displacement it was taken the vector magnitude of the
displacement vector across the isolator itself. In other words, being U1 and U2 the horizontal
displacement components, the value
U12 U22
.In figure below the results obtained with a PGA = 1g are shown. It is clear that this PGA is the limit value that the isolation system can accept without any damage. It’s worth noting that this value is very high also thinking to the earthquake that happens in the most seismic areas in the world.
Centro Ricerche Bologna
ACS – P9LU - 001
0
R
15
16
Figure 13 – Displacement vector magnitude in casa PGA = 1g
Centro Ricerche Bologna
ACS – P9LU - 001
0
R
16
16
References
[1] A. Poggianti: “Preliminary design of the seismic isolation system for the nuclear
power plant IRIS” doc. ENEA ACS-PLU-001, rev.0, 24/09/2008
[2] Test report CESI B0020266 – Doc ENEA XCESI – LP2 – 001
[3]
Test report FIP IndustrialeVP 59/10 – Doc ENEA XFIP – LP2 – 001
[4] ABAQUS UNIFIED FEA, SIMULIA, 166 Valley Street, Providence, RI 02909 USA,
www.simulia.com