DOI 10.1140/epjc/s10052-015-3376-y Regular Article - Experimental Physics
Measurement of the inclusive 3-jet production differential cross
section in proton–proton collisions at 7 TeV and determination
of the strong coupling constant in the TeV range
CMS Collaboration∗
CERN, 1211 Geneva 23, Switzerland
Received: 4 December 2014 / Accepted: 27 March 2015 / Published online: 1 May 2015
© CERN for the benefit of the CMS collaboration 2015. This article is published with open access at Springerlink.com
Abstract This paper presents a measurement of the inclu-sive 3-jet production differential cross section at a proton– proton centre-of-mass energy of 7 TeV using data corre-sponding to an integrated luminosity of 5 fb−1collected with the CMS detector. The analysis is based on the three jets with the highest transverse momenta. The cross section is measured as a function of the invariant mass of the three jets in a range of 445–3270 GeV and in two bins of the maxi-mum rapidity of the jets up to a value of 2. A comparison between the measurement and the prediction from pertur-bative QCD at next-to-leading order is performed. Within uncertainties, data and theory are in agreement. The sensi-tivity of the observable to the strong coupling constant αS is studied. A fit to all data points with 3-jet masses larger than 664 GeV gives a value of the strong coupling constant of αS(MZ)= 0.1171 ± 0.0013 (exp)+0.0073−0.0047(theo).
1 Introduction
A key characteristic of highly energetic proton–proton col-lisions at the LHC is the abundant production of multijet events. At high transverse momenta pT, such events are described by quantum chromodynamics (QCD) in terms of parton–parton scattering. The simplest jet production pro-cess corresponds to a 2→ 2 reaction with the two outgoing partons fragmenting into a pair of jets. Two cross sections, for which the leading-order (LO) predictions in perturbative QCD (pQCD) are proportional to the square of the strong coupling constant, αS2, are conventionally defined: the inclu-sive single-jet cross section as a function of jet pTand rapid-ity y, and the 2-jet production cross section as a function of the 2-jet invariant mass and a rapidity-related kinematic quantity that provides a separation of the phase space into exclusive bins. The ATLAS Collaboration usually character-izes the 2-jet system in terms of the rapidity separation of ∗e-mail:[email protected]
the two jets leading in pT, while CMS employs the larger of the two absolute rapidities of the two jets. Corresponding measurements by the ATLAS and CMS Collaborations can be found in Refs. [1–6].
In this paper, the inclusive 3-jet production differential cross section is measured as a function of the invariant mass m3 of the three jets leading in pT and of their maximum rapidity ymax, which are defined as follows:
m23= (p1+ p2+ p3)2 ymax= sgn!|max(y1,y2,y3)|
−|min(y1,y2,y3)|"· max (|y1|, |y2|, |y3|) , (1) where pi and yi are the four-momentum and rapidity of the ith jet leading in pT. Following Ref. [3], ymaxis defined as a signed quantity such that the double-differential cross sec-tion, d2σ/dm
3dymax, can be written in a way similar to the inclusive jet cross section, d2σ/d pTdy, including a factor of 2 for rapidity bin widths in terms of|ymax| and |y|, respec-tively. The absolute value of ymaxis equal to the maximum |y| of the jets, denoted |y|max. A previous study of the 3-jet mass spectra was published by the D0 Collaboration [7]. Very recently, ATLAS submitted a 3-jet cross section mea-surement [8].
For this cross section, the LO process is proportional to α3S and theoretical predictions are available up to next-to-leading order (NLO) [9,10] making precise comparisons to data possible. The potential impact of this measurement on the parton distribution functions (PDFs) of the proton is stud-ied and the strong coupling constant αSis extracted. In previ-ous publications by CMS, the value of αSwas determined to αS(MZ)= 0.1148 ± 0.0014 (exp) ± 0.0050 (theo) by inves-tigating the ratio of inclusive 3-jet to inclusive 2-jet pro-duction, R32 [11], and αS(MZ) = 0.1185 ± 0.0019 (exp) +0.0060
−0.0037(theo) by fitting the inclusive jet cross section [12]. The ratio R32 benefits from uncertainty cancellations, but it is only proportional to αS at LO, leading to a correspond-ingly high sensitivity to its experimental uncertainties in fits
of αS(MZ). The second observable, which is similar to the denominator in R32, is proportional to αS2at LO with a sen-sitivity to experimental uncertainties reduced by a factor of 1/2, but without uncertainty cancellations. It is interesting to study how fits of αSto the inclusive 3-jet mass cross section, d2σ/dm
3dymax, which is a 3-jet observable similar to the numerator of R32, compare to previous results.
The data analyzed in the following were recorded by the CMS detector at the LHC during the 2011 data-taking period at a proton–proton centre-of-mass energy of 7 TeV and cor-respond to an integrated luminosity of 5.0 fb−1. Jets are clus-tered by using the infrared- and collinear-safe anti-kT algo-rithm [13] as implemented in the FastJet package [14] with a jet size parameter of R= 0.7. A smaller jet size parameter of R= 0.5 has been investigated, but was found to describe the data less well. Similarly, in Ref. [15] it is shown that the inclusive jet cross section is better described by NLO theory for R= 0.7 than for R = 0.5.
Events are studied in which at least three jets are found up to a rapidity of|y| = 3 that are above a minimal pTthreshold of 100 GeV. The jet yields are corrected for detector effects resulting in a final measurement phase space of 445 GeV≤ m3 <3270 GeV and|y|max<2. Extension of the analysis to larger values of|y|maxwas not feasible with the available trigger paths.
This paper is divided into seven parts. Section2presents an overview of the CMS detector and the event reconstruc-tion. Sections3and4discuss the event selection and present the measurement. Theoretical ingredients are introduced in Sect.5and are applied in Sect.6to determine αS(MZ)from a fit to the measured 3-jet production cross section. Conclu-sions are presented in Sect.7.
2 Apparatus and event reconstruction
The central feature of the CMS apparatus is a superconduct-ing solenoid of 6 m internal diameter, providsuperconduct-ing a magnetic field of 3.8 T. Within the superconducting solenoid volume are a silicon pixel and strip tracker, a lead tungstate crystal electromagnetic calorimeter (ECAL), and a brass and scintil-lator hadron calorimeter (HCAL), each composed of a bar-rel and two endcap sections. Muons are measured in gas-ionization detectors embedded in the steel flux-return yoke outside the solenoid. Extensive forward calorimetry com-plements the coverage provided by the barrel and endcap detectors.
The first level (L1) of the CMS trigger system, composed of custom hardware processors, uses information from the calorimeters and muon detectors to select the most interesting events in a fixed time interval of less than 4 µs. The high level trigger (HLT) processor farm further decreases the event rate from around 100 kHz to around 400 Hz, before data storage.
The particle-flow algorithm reconstructs and identifies each particle candidate with an optimized combination of all subdetector information [16,17]. For each event, the recon-structed particle candidates are clustered into hadronic jets by using the anti-kT algorithm with a jet size parameter of
R = 0.7. The jet momentum is determined as the vecto-rial sum of all constituent momenta in this jet, and is found in the simulation to be within 5–10 % of the true momen-tum over the whole pT spectrum and detector acceptance. An offset correction is applied to take into account the extra energy clustered into jets due to additional proton–proton interactions within the same or neighbouring bunch crossings (pileup). Jet energy corrections are derived from the simula-tion, and are confirmed with in situ measurements with the energy balance of dijet, photon+jet, and Z+jet events [18,19]. The jet energy resolution amounts typically to 15 % at 10 GeV, 8 % at 100 GeV, and 4 % at 1 TeV. A more detailed description of the CMS apparatus can be found in Ref. [20].
3 Event selection
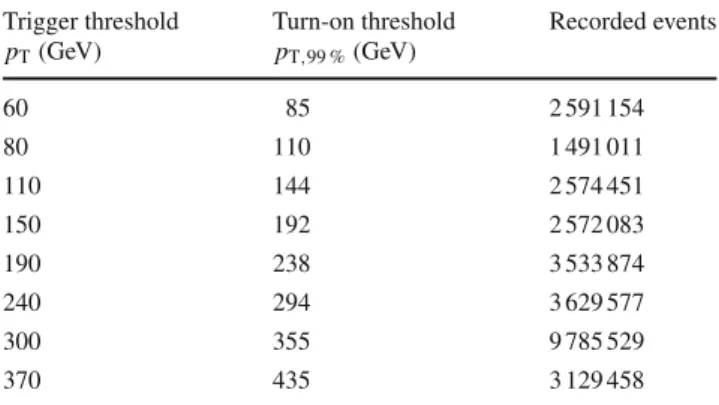
The data set used for this analysis contains all events that were triggered by any of the single-jet triggers. A single-jet trigger accepts events if at least one reconstructed jet sur-passes a transverse momentum threshold. During the 2011 data-taking period, triggers with eight different thresholds ranging from 60 to 370 GeV were employed. They are listed in Table1with the number of events recorded by each trigger and the corresponding turn-on threshold pT,99 %, where the trigger is more than 99 % efficient.
The different triggers are used to measure the 3-jet mass spectrum in mutually exclusive regions of the phase space, defined in terms of the pT of the leading jet: the pT inter-val covered by a single-jet trigger starts at the corresponding turn-on threshold pT,99 %and ends at the turn-on threshold of the trigger with the next highest threshold. The final 3-jet mass spectrum is obtained by summing the spectra mea-sured with the different triggers while taking trigger prescale factors into account. Apart from the prescaling, the trigger efficiency is more than 99 % across the entire mass range studied.
In the inner rapidity region, most single-jet triggers con-tribute up to 50 % of the final event yield, with the exception of the two triggers with the lowest and highest threshold, which contribute up to 80 and 100 % respectively, depend-ing on m3. In particular, starting at 1100 GeV, the majority of the events are taken from the highest unprescaled trigger. In the outer rapidity region, each jet trigger contributes over a large range of three-jet masses to the measurement. With the exception of the two triggers with the lowest and highest
Table 1 Trigger and turn-on thresholds in leading jet pT, and the num-ber of events recorded via the single-jet trigger paths used for this mea-surement
Trigger threshold Turn-on threshold Recorded events pT(GeV) pT,99 %(GeV) 60 85 2 591 154 80 110 1 491 011 110 144 2 574 451 150 192 2 572 083 190 238 3 533 874 240 294 3 629 577 300 355 9 785 529 370 435 3 129 458
thresholds, each trigger contributes around 25 % to the final event yield.
The recorded events are filtered with tracking-based selec-tions [21] to remove interacselec-tions between the circulating proton bunches and residual gas particles or the beam colli-mators. To further reject beam backgrounds and off-centre parasitic bunch crossings, standard vertex selection cuts are applied [21]. To enhance the QCD event purity, events in which the missing transverse energy ETmiss amounts to more than 30 % of the measured total transverse energy are removed. The missing transverse energy is calculated by requiring momentum conservation for the reconstructed par-ticle flow candidates [19].
Jet identification (jet ID) selection criteria [22] are devel-oped to reject pure noise or noise enhanced jets, while keep-ing more than 99 % of physical jets with transverse momen-tum above 10 GeV. In contrast to the previous selection criteria, which reject complete events, the jet ID removes only individual jets from the event. The jet ID applied to the particle-flow jets requires that each jet should contain at least two particles, one of which is a charged hadron. In addition, the jet energy fraction carried by neutral hadrons and pho-tons must be less than 90 %. These criteria have an efficiency greater than 99 % for hadronic jets.
4 Measurement and experimental uncertainties
The double-differential 3-jet production cross section is mea-sured as a function of the invariant 3-jet mass m3 and the maximum rapidity ymax of the three jets with the highest transverse momenta in the event:
d2σ dm3dymax = 1 ϵL N $m3(2$|y|max). (2)
Here, L is the integrated luminosity and N is the number of events. The efficiency ϵ is the product of the trigger and event selection efficiencies, and differs from unity by less than one
percent for this jet analysis. Differences in the efficiency with respect to unity are included in a systematic uncertainty. The width of a 3-jet mass bin is based on the 3-jet mass resolution, which is derived from a detector simulation. Starting at m3= 50 GeV, the bin width increases progressively with m3. In addition, the phase space is split into an inner,|y|max <1, and an outer, 1≤ |y|max<2, rapidity region. The bin widths in ymaxare equal to 2. Events with|y|max≥ 2 are rejected.
To remove the impact of detector effects from limited acceptance and finite resolution, the measurement is cor-rected with the iterative d’Agostini unfolding algorithm [23] with four iterations. Response matrices for the unfolding algorithm are derived from detector simulation by using the two event generators pythia version 6.4.22 [24] with tune Z2 [25] and herwig++ version 2.4.2 [26] with the default tune. (The pythia 6 Z2 tune is identical to the Z1 tune described in [25] except that Z2 uses the CTEQ6L PDF while Z1 uses CTEQ5L.) Differences in the unfolding result are used to evaluate the uncertainties related to assumptions in modelling the parton showering [27,28], hadronization [29– 32], and the underlying event [27,33,34] in these event generators. Additional uncertainties are determined from an ensemble of Monte Carlo (MC) experiments, where the data input and the response matrix are varied within the limits of their statistical precision before entering the unfolding algo-rithm. The unfolding result corresponds to the sample mean, while the statistical uncertainty, which is propagated through the unfolding procedure, is given by the sample covariance. The variation of the input data leads to the statistical uncer-tainty in the unfolded cross section, while the variation of the response matrix is an additional uncertainty inherent in the unfolding technique because of the limited size of simulated samples.
The systematic uncertainty related to the determination of the jet energy scale (JES) is evaluated via 16 independent sources as described in Ref. [3]. The modified prescription for the treatment of correlations as recommended in Ref. [12] is applied. To reduce artifacts caused by trigger turn-ons and prescale weights, the JES uncertainty is propagated to the cross section measurement by employing an ensemble of MC experiments, where the data input is varied within the lim-its of the systematic uncertainty and where average prescale weights are used.
The luminosity uncertainty, which is fully correlated across all m3and ymaxbins, is estimated to be 2.2 % [35].
Residual jet reconstruction and trigger inefficiencies are accounted for by an additional uncorrelated uncertainty of 1 % as in Ref. [3].
Figure1presents an overview of the experimental uncer-tainties for the 3-jet mass measurement. Over a wide range of 3-jet masses, the JES uncertainty represents the largest con-tribution. At the edges of the investigated phase space, i.e. in the low and high 3-jet mass regions, statistical and
unfold-ing uncertainties, which are intrinsically linked through the unfolding procedure, become major contributors to the total uncertainty. 500 1000 2000 m3[GeV] −40 −20 0 20 40 R el at iv e exp . un ce rt ai nt y [% ] CMS 5.0 fb−1(7 TeV)
Anti-ktR = 0.7, |y|max< 1
Total uncertainty
Unfolding + stat. uncertainty Jet energy scale uncertainty Luminosity uncertainty 500 1000 2000 m3[GeV] −40 −20 0 20 40 R el at iv e exp . un ce rt ai nt y [% ] CMS 5.0 fb−1(7 TeV)
Anti-ktR = 0.7, 1 ≤ |y|max< 2
Total uncertainty
Unfolding + stat. uncertainty Jet energy scale uncertainty Luminosity uncertainty
Fig. 1 Overview of the measurement uncertainties in the inner
|y|max<1 (top) and the outer rapidity region 1≤ |y|max<2 (bottom). All uncertainty components, including the 1 % uncorrelated residual uncertainty, are added in quadrature to give the total uncertainty
5 Theoretical predictions and uncertainties
The theoretical predictions for the 3-jet mass cross sections consist of an NLO QCD calculation and a nonperturbative (NP) correction to account for the underlying event mod-elled by multiparton interactions (MPI) and for hadroniza-tion effects. Electroweak correchadroniza-tions to inclusive and dijet cross sections have been calculated in Ref. [36], where they are found to be limited to a few percent at the highest dijet masses accessible with the CMS data at 7 TeV centre-of-mass energy. For 3-jet quantities these corrections are not known and hence cannot be considered in the present analysis.
The NLO calculations are performed by using the NLO-Jet++ program version 4.1.3 [9,10] within the framework of the fastNLO package version 2.1 [37]. The partonic events are subjected to the same jet algorithm and phase space selec-tions as the data events, where at least three jets with|y| ≤ 3 and pT > 100 GeV are required. The number of massless quark flavours, Nf, is set to five. The impact of jet produc-tion via massive top-antitop quark pairs is estimated to be negligible. The renormalization and factorization scales, µr and µf, are identified with m3/2. With this choice, which is identical to the jet pTin case of dijet events at central rapidity with m2/2 as scale, the NLO corrections to the LO cross sec-tions remain limited between 1.2 and 1.6. The uncertainty in the predicted cross section associated with the renormaliza-tion and factorizarenormaliza-tion scale choice is evaluated by varying µr and µf from the default by the following six combinations: (µr/(m3/2), µf/(m3/2))= (1/2, 1/2), (1/2, 1), (1, 1/2), (1, 2), (2, 1), and (2, 2).
Comparisons to the NLO predictions are performed for five different PDF sets, each with NLO and NNLO PDF evo-lutions, from the LHAPDF package [38]. They are listed in Table 2 together with the corresponding number of active flavours, Nf, the default values of the strong coupling con-stant αS(MZ), and the ranges in αS(MZ)available for fits.
Table 2 The PDF sets used in comparisons to the data together with the
evolution order (Evol.), the corresponding number of active flavours, Nf, the assumed masses Mtand MZof the top quark and the Z boson,
respectively, the default values of αS(MZ), and the range in αS(MZ) variation available for fits. For CT10 the updated versions of 2012 are taken
Base set Refs. Evol. Nf Mt(GeV) MZ(GeV) αS(MZ) αS(MZ)range
ABM11 [39] NLO 5 180 91.174 0.1180 0.110–0.130 ABM11 [39] NNLO 5 180 91.174 0.1134 0.104–0.120 CT10 [40] NLO ≤5 172 91.188 0.1180 0.112–0.127 CT10 [40] NNLO ≤5 172 91.188 0.1180 0.110–0.130 HERAPDF1.5 [41] NLO ≤5 180 91.187 0.1176 0.114–0.122 HERAPDF1.5 [41] NNLO ≤5 180 91.187 0.1176 0.114–0.122 MSTW2008 [42,43] NLO ≤5 1010 91.1876 0.1202 0.110–0.130 MSTW2008 [42,43] NNLO ≤5 1010 91.1876 0.1171 0.107–0.127 NNPDF2.1 [44] NLO ≤6 175 91.2 0.1190 0.114–0.124 NNPDF2.1 [44] NNLO ≤6 175 91.2 0.1190 0.114–0.124
500 1000 1500 2000 2500 3000 m3[GeV] 0.95 1.00 1.05 1.10 1.15 1.20 1.25 N on pe rt ur ba tiv e co rr ec tio n fa ct or CMS Simulation √s = 7 TeV Anti-ktR = 0.7 |y|max< 1 1 ≤ |y|max< 2
Fig. 2 Overview of the NP correction factors and their uncertainties
in the inner|y|max < 1 (solid line) and in the outer rapidity region 1≤ |y|max<2 (dashed line)
All PDF sets include a maximum of five active flavours Nf except for NNPDF2.1, which has Nf,max = 6. Only the ABM11 PDF set employs a fixed-flavour number scheme in contrast to variable-flavour number schemes favoured by all other PDF sets. The PDF uncertainties in the cross section predictions are evaluated according to the prescriptions rec-ommended for the respective PDFs. More details are avail-able in the references listed in Tavail-able2.
For the NP corrections, the multijet-improved MC event generators sherpa version 1.4.3 [45] and MadGraph 5 ver-sion 1.5.12 [46] are used to simulate 3-jet events. sherpa employs a dipole formulation for parton showering [47,48], a cluster model for hadronization [49], and an MPI model for the underlying event that is based on independent hard pro-cesses similar to pythia [33,45]. In the case of MadGraph, the steps of parton showering, hadronization, and multiple parton scatterings come from pythia version 6.4.26 with default settings using the Lund string model for hadroniza-tion [29–31] and a multiple-interachadroniza-tion model for the under-lying event that is interleaved with the parton shower [27]. The 3-jet mass is determined for a given event before and after the MPI and hadronization phases are performed. This allows the derivation of correction factors, which are applied to the theory prediction at NLO. The correction factor is defined as the mean of the corrections from the two exam-ined event generators and ranges in value from 1.16 for the low mass range to about 1.05 at high 3-jet mass. The system-atic uncertainty in the NP correction factors is estimated as plus or minus half of the spread between the two predictions and amounts to roughly±2%. The NP correction factors and their uncertainties are shown in Fig.2for both rapidity bins. An overview of the different theoretical uncertainties is given in Fig.3. 500 1000 2000 m3[GeV] −40 −20 0 20 40 Relativ e theor . uncer tainty [%] √ s = 7 TeV
Anti-ktR = 0.7, |y|max< 1
CT10-NLO Total uncertainty PDF uncertainty Scale uncertainty NP uncertainty 500 1000 2000 m3[GeV] −40 −20 0 20 40 Relativ e theor . uncer tainty [%] √s = 7 TeV
Anti-ktR = 0.7, 1 ≤ |y|max< 2
CT10-NLO
Total uncertainty PDF uncertainty Scale uncertainty NP uncertainty
Fig. 3 Overview of the theory uncertainties in the inner |y|max <1 (top) and in the outer rapidity region 1≤ |y|max<2 (bottom) for the CT10 PDF set with NLO PDF evolution
500 1000 2000 m3[GeV] 10−6 10−5 10−4 10−3 10−2 10−1 100 101 d 2σ / dm 3 dymax [pb /GeV] CMS 5.0 fb−1(7 TeV) Anti-ktR = 0.7 CT10-NLO NLO × NP |y|max≤ 1 1 < |y|max≤ 2
Fig. 4 Comparison of the measured 3-jet mass cross section with the
theory prediction for the two regions in|y|max. This prediction is based on an NLO 3-jet calculation, which employs the CT10-NLO PDF set and is corrected for nonperturbative effects. The vertical error bars represent the total experimental uncertainty, while the horizontal error barsindicate the bin widths
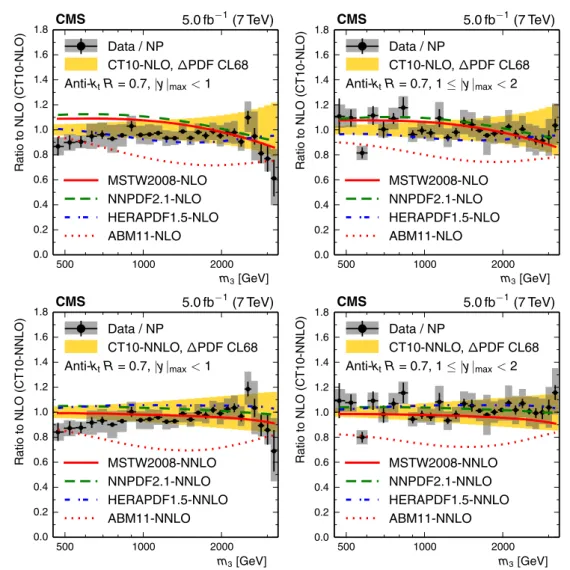
500 1000 2000 m3[GeV] 0.0 0.2 0.4 0.6 0.8 1.0 1.2 1.4 1.6 1.8 R at io to NL O (C T 10 -N LO ) CMS 5.0 fb −1(7 TeV)
Anti-ktR = 0.7, |y|max< 1 Data / NP CT10-NLO,∆PDF CL68 MSTW2008-NLO NNPDF2.1-NLO HERAPDF1.5-NLO ABM11-NLO 500 1000 2000 m3[GeV] 0.0 0.2 0.4 0.6 0.8 1.0 1.2 1.4 1.6 1.8 R at io to NL O (C T 10 -N LO ) CMS 5.0 fb −1(7 TeV)
Anti-ktR = 0.7, 1 ≤ |y|max< 2 Data / NP CT10-NLO,∆PDF CL68 MSTW2008-NLO NNPDF2.1-NLO HERAPDF1.5-NLO ABM11-NLO 500 1000 2000 m3[GeV] 0.0 0.2 0.4 0.6 0.8 1.0 1.2 1.4 1.6 1.8 Ratio to NLO (CT10-NNLO) CMS 5.0 fb−1(7 TeV)
Anti-ktR = 0.7, |y|max< 1 Data / NP CT10-NNLO,∆PDF CL68 MSTW2008-NNLO NNPDF2.1-NNLO HERAPDF1.5-NNLO ABM11-NNLO 500 1000 2000 m3[GeV] 0.0 0.2 0.4 0.6 0.8 1.0 1.2 1.4 1.6 1.8 Ratio to NLO (CT10-NNLO) CMS 5.0 fb−1(7 TeV)
Anti-ktR = 0.7, 1 ≤ |y|max< 2 Data / NP CT10-NNLO,∆PDF CL68 MSTW2008-NNLO NNPDF2.1-NNLO HERAPDF1.5-NNLO ABM11-NNLO
Fig. 5 Ratio of the 3-jet mass cross section, divided by NP
correc-tions, to the theory prediction at NLO with the CT10-NLO (top) or CT10-NNLO PDF set (bottom) for the inner rapidity region (left) and for the outer rapidity region (right). The data are shown with error bars representing the statistical uncertainty after unfolding added quadrati-cally to the 1 % uncorrelated residual uncertainty and gray rectangles
for the total correlated systematic uncertainty. The light gray (colour version: yellow) band indicates the PDF uncertainty for the CT10 PDF sets at 68 % confidence level. In addition, the ratios of the NLO predic-tions are displayed for the PDF sets MSTW2008, NNPDF2.1, HERA-PDF1.5, and ABM11, also at next-to- (top) and next-to-next-to-leading evolution order (bottom)
6 Results and determination of the strong coupling constant
Figure 4 compares the measured 3-jet mass spectrum to the Theory prediction. This prediction is based on an NLO 3-jet calculation, which employs the CT10-NLO PDF set and is corrected for nonperturbative effects. Perturbative QCD describes the 3-jet mass cross section over five orders of magnitude for 3-jet masses up to 3 TeV. The ratios of the measured cross sections to the theory predictions are pre-sented in Fig.5to better judge potential differences between data and theory. Within uncertainties, most PDF sets are able to describe the data. Some deviations are visible for small m3. Significant deviations are exhibited when using
the ABM11 PDFs, which therefore are not considered in our fits of αS(MZ).
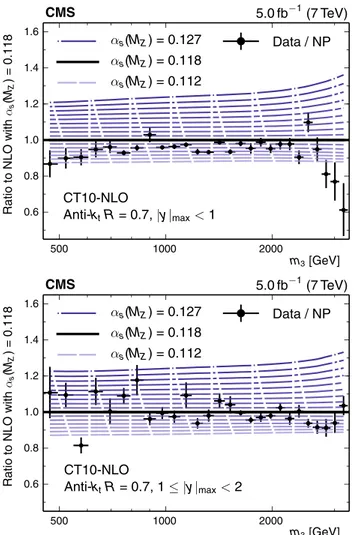
In the following, the PDFs are considered to be an exter-nal input such that a value of αS(MZ)can be determined. Potential correlations between αS(MZ)and the PDFs are taken into account by using PDF sets that include variations in αS(MZ)as listed in Table 2. Figure 6 demonstrates for the example of the CT10-NLO PDF set the sensitivity of the theory predictions with respect to variations in the value of αS(MZ)in comparison to the data and their total uncer-tainty.
A value of αS(MZ)is determined by minimizing the χ2 between the N measurements Diand the theoretical predic-tions Ti. The χ2is defined as
500 1000 2000 m3[GeV] 0.6 0.8 1.0 1.2 1.4 1.6 R at io to N LO wit h αs (M Z )= 0. 11 8 CMS 5.0 fb−1(7 TeV)
Anti-ktR = 0.7, |y|max< 1 CT10-NLO αs(MZ) = 0.127 αs(MZ) = 0.118 αs(MZ) = 0.112 Data / NP 500 1000 2000 m3[GeV] 0.6 0.8 1.0 1.2 1.4 1.6 Ratio to N LO with αs (M Z )=0 .1 18 CMS 5.0 fb−1(7 TeV)
Anti-ktR = 0.7, 1 ≤ |y|max< 2 CT10-NLO
αs(MZ) = 0.127
αs(MZ) = 0.118
αs(MZ) = 0.112
Data / NP
Fig. 6 Ratio of the measured 3-jet mass cross section in the inner
rapidity region (top) and in the outer rapidity region (bottom), divided by the NP correction, with respect to the theory prediction at NLO while using the CT10-NLO PDF set with the default value of αS(MZ) = 0.118. In addition, ratios are shown for the theory predictions with CT10-NLO PDFs assuming values of αS(MZ)ranging from 0.112 up to 0.127 in steps of 0.001. The error bars represent the total uncorrelated uncertainty of the data
χ2= N #
i j
(Di − Ti) C−1i j !Dj − Tj", (3)
where the covariance matrix Ci jis composed of the following terms:
C= covunf+stat+ covuncor + $ # sources covJES %
+ covlumi+ covPDF, (4) and the terms in the sum represent
1. covunf+stat: statistical and unfolding uncertainty includ-ing correlations induced through the unfoldinclud-ing;
2. covuncor: uncorrelated systematic uncertainty summing up small residual effects such as trigger and identification inefficiencies, time dependence of the jet pTresolution, and the uncertainty on the trigger prescale factor; 3. covJES,sources: systematic uncertainty for each JES
uncer-tainty source;
4. covlumi: luminosity uncertainty; and 5. covPDF: PDF uncertainties.
The first four sources constitute the experimental uncer-tainty. The JES and luminosity uncertainty are treated as fully correlated across the m3 and |y|max bins, where for the JES uncertainty the procedure recommended in Ref. [12] is applied. The derivation of PDF uncertainties follows pre-scriptions for each individual PDF set. The CT10 and MSTW PDF sets both employ the Hessian or eigenvector method [50] with upward and downward variations for each eigenvec-tor. As required by the use of covariance matrices, sym-metric PDF uncertainties are computed following Ref. [51]. For the HERAPDF1.5 PDF set, which employs a Hessian method for the experimental uncertainties, complemented with model and parameterization uncertainties, the prescrip-tion from Ref. [41] is used. The NNPDF2.1 PDF set uses the technique of MC pseudo-experiments instead of the eigen-vector method to provide PDF uncertainties. The ensemble of replicas, whose averaged predictions give the central result, are evaluated following the prescription in Ref. [52] to derive the PDF uncertainty for NNPDF. The JES and luminosity uncertainties are assumed to be multiplicative to avoid the statistical bias that arises from uncertainty estimations taken from data [53–55]. The uncertainty in a result for αS(MZ) from a χ2fit is obtained from the α
S(MZ)values for which the χ2is increased by one with respect to the minimum value. The uncertainty in αS(MZ)due to the NP uncertainties is evaluated by looking for maximal offsets from a default fit. The theoretical prediction T is varied by the NP uncertainty $NP as T · NP → T · (NP ± $NP). The fitting procedure is repeated for these two variations, and the deviation from the central αS(MZ)values is considered as the uncertainty in αS(MZ). Finally, the uncertainty due to the µr and µf scales is evaluated by applying the same method as for the NP corrections, varying µr and µf by the six scale factor combinations as described in Sect.5.
The shape of the predicted 3-jet mass cross section depends on the QCD matrix elements and kinematic con-straints. Because each of the leading three jets is required to have a pT larger than 100 GeV, some event configura-tions, possible with respect to the QCD matrix elements, are kinematically forbidden at low m3. In the spectra shown in
Fig.4, this fact is visible in the form of a maximum in the 3-jet
mass cross section, which is shifted to higher m3values for the outer compared to the inner|y|maxbin because the larger differences in the jet rapidities allow higher m3to be reached
Table 3 Determinations of αS(MZ)in the considered m3ranges. The relevant scale in each 3-jet mass range is calculated from the cross section-weighted average as given by the theory prediction using the CT10 PDF set with NLO evolution. The three bottom rows present fits
using the whole 3-jet mass range above 664 GeV in both rapidity regions either separately or combined (last row). Uncertainties are quoted sep-arately for experimental sources, the PDFs, the NP corrections, and the scale uncertainty
m3(GeV) ⟨Q⟩ (GeV) χ2/ndof αS(MZ) ±(exp) ±(PDF) ±(NP) ±(scale)
664–794 361 4.5/3 0.1232 +0.0040 −0.0042 +0.0019−0.0016 +0.0008−0.0007 +0.0079−0.0044 794–938 429 7.8/3 0.1143 +0.0034−0.0033 +0.0019−0.0016 ±0.0008 +0.0073−0.0042 938–1098 504 0.6/3 0.1171 +0.0033−0.0034 ±0.0022 ±0.0007 +0.0068−0.0040 1098–1369 602 2.6/5 0.1152 ±0.0026 +0.0027−0.0026 +0.0008−0.0007 +0.0060−0.0027 1369–2172 785 8.8/13 0.1168 +0.0018−0.0019 +0.0030−0.0031 +0.0007−0.0006 +0.0068−0.0034 2172–2602 1164 3.6/5 0.1167 +0.0037−0.0044 +0.0040−0.0044 ±0.0008 +0.0065−0.0041 2602–3270 1402 5.5/7 0.1120 +0.0043−0.0041 +0.0056−0.0040 ±0.0001 +0.0088−0.0050 |y|max<1 413 10.3/22 0.1163 +0.0018−0.0019 ±0.0027 ±0.0007 +0.0059−0.0025 1≤ |y|max<2 441 10.6/22 0.1179 +0.0018−0.0019 ±0.0021 ±0.0007 +0.0067−0.0037 |y|max<2 438 47.2/45 0.1171 ±0.0013 ±0.0024 ±0.0008 +0.0069−0.0040
Table 4 Same as Table3but showing the fit result in terms of αS(Q)for each range in Q
m3(GeV) ⟨Q⟩ (GeV) χ2/ndof αS(Q) ±(exp) ±(PDF) ±(NP) ±(scale)
664–794 361 4.5/3 0.1013 +0.0027−0.0028 +0.0013−0.0011 ±0.0005 +0.0052−0.0030 794–938 429 7.8/3 0.0933 ±0.0022 +0.0012−0.0011 ±0.0005 +0.0048−0.0028 938–1098 504 0.6/3 0.0934 ±0.0021 ±0.0014 ±0.0005 +0.0043−0.0025 1098–1369 602 2.6/5 0.0902 ±0.0016 ±0.0016 +0.0005−0.0004 +0.0036−0.0017 1369–2172 785 8.8/13 0.0885 +0.0010−0.0011 +0.0017−0.0018 +0.0004−0.0003 +0.0038−0.0020 2172–2602 1164 3.6/5 0.0848 +0.0019−0.0023 +0.0020−0.0023 ±0.0004 +0.0034−0.0021 2602–3270 1402 5.5/7 0.0807 +0.0022−0.0021 +0.0028−0.0021 ±0.0001 +0.0044−0.0026
with lower pTjets. For fits of αS(MZ)the m3region limited through kinematical constraints is unsuited, since close to the phase space boundaries fixed-order pQCD calculations might be insufficient and resummations might be required. To avoid this region of phase space as done in Ref. [11], only m3bins beyond the maximum of the 3-jet mass cross section in the outer|y|maxbin are considered. This corresponds to a minimum in m3of 664 GeV. Including one bin more or less induces changes in the measured αS(MZ)below the percent level. To study the running of the strong coupling, the com-parison between data and theory is also performed in several 3-jet mass regions above 664 GeV as shown in Table3.
For the evolution of αS(Q) in the fits of αS(MZ), the Glück–Reya–Vogt formula [56] is used at 2-loop order as implemented in fastNLO. The capability of fastNLO to replace the αS(Q)evolution of a PDF set by such alterna-tive codes is exploited to interpolate cross section predic-tions between the available fixed points of αS(MZ)listed in Table 2. Limited extrapolations beyond the lowest or highest values of αS(MZ) provided in a PDF series are accepted if necessary for uncertainty evaluations, up to a limit of |$αS(MZ)| = 0.003. This extrapolation method
can be necessary in some cases to fully evaluate the scale uncertainty. The procedure has been cross-checked using the original αS(Q)grid of each PDF within LHAPDF and with the evolution code of the hoppet toolkit [57] and of RunDec [58,59].
The CT10-NLO PDF set is chosen for the main result for two reasons: The range in available αS(MZ)values is wide enough to evaluate almost all scale uncertainties within this range and the central value of αS(MZ)in this set is rather close to the combined fit result.
The fit results for αS(MZ)and αS(Q)for all considered m3ranges are presented in Tables3and4, respectively. Fits over the total m3range above 664 GeV are shown for each
ymaxbin separately and for both combined in the bottom three rows of Table3.
For comparison, the combined fit was also tried for alterna-tive PDF sets listed in Table5. For the ABM11 PDFs, which predict 3-jet mass cross sections that are too small, fits are technically possible. However, to compensate for this dis-crepancy, the αS(MZ)results take unreasonably high values that are far outside the αS(MZ)values that are given by the PDF authors. For the NNPDF2.1-NLO and
HERAPDF1.5-Table 5 Determinations of αS(MZ)with different PDF sets using all 3-jet mass points with m3>664 GeV. Uncertainties are quoted separately for experimental sources, the PDFs, the NP corrections, and the scale uncertainty
PDF set χ2/ndof αS(MZ) ±(exp) ±(PDF) ±(NP) ± (scale)
CT10-NLO 47.2/45 0.1171 ±0.0013 ±0.0024 ±0.0008 +0.0069−0.0040 CT10-NNLO 48.5/45 0.1165 +0.0011 −0.0010 +0.0022−0.0023 +0.0006−0.0008 +0.0066−0.0034 MSTW2008-NLO 52.8/45 0.1155 +0.0014−0.0013 +0.0014−0.0015 +0.0008−0.0009 +0.0105−0.0029 MSTW2008-NNLO 53.9/45 0.1183 +0.0011 −0.0016 +0.0012−0.0023 +0.0011−0.0019 +0.0052−0.0050 HERAPDF1.5-NNLO 49.9/45 0.1143 ±0.0007 +0.0020−0.0035 +0.0003−0.0008 +0.0035−0.0027 NNPDF2.1-NNLO 51.1/45 0.1164 ±0.0010 +0.0020−0.0019 +0.0010−0.0009 +0.0058−0.0025 10 100 1000 Q [GeV] 0.05 0.10 0.15 0.20 0.25 αs (Q ) αs(MZ) = 0.1171±0.0075 0.0050(3-jet mass) αs(MZ) = 0.1185 ± 0.0006 (World average) CMS R32ratio CMS tt prod. CMS incl. jet CMS 3-jet mass HERA LEP PETRA SPS Tevatron
Fig. 7 Comparison of the αS(Q)evolution as determined in this anal-ysis from all measurement bins with m3 > 664 GeV (solid curve with light grey uncertainty band; colour version: red curve with yellow uncertainty band) to the world average (dashed curve with dark grey uncertainty band) [60]. The error bars on the data points correspond to the total uncertainty. In addition, an overview of measurements of the running of the strong coupling αS(Q)from electron–positron [65–
67], electron–proton [69–72], and proton–(anti)proton collider exper-iments [11,61,62,68] is presented. The results of this analysis extend the covered range in values of the scale Q up to≈1.4 TeV
NLO PDF series, a central value for αS(MZ)can be calcu-lated, but the range in αS(MZ)values is not sufficient for a reliable determination of uncertainty estimations. In all other cases the fit results for αS(MZ)are in agreement between the investigated PDF sets and PDF evolution orders within uncertainties.
Figure7 shows the αS(Q)evolution determined in this analysis with CT10-NLO in comparison to the world average of αS(MZ)= 0.1185 ± 0.0006 [60]. The figure also shows an overview of the measurements of the running of the strong coupling from various other experiments [61–67] together with recent determinations by CMS [11,12,68] and from this analysis. Within uncertainties, the new results presented here are in agreement with previous determinations and extend the covered range in scale Q up to a value of 1.4 TeV.
7 Summary
The proton–proton collision data collected by the CMS experiment in 2011 at a centre-of-mass energy of 7 TeV were used to measure the double-differential 3-jet production cross section as a function of the invariant mass m3of the three jets leading in pT, and of their maximum rapidity ymax. The measurement covers a 3-jet mass range from 445 GeV up to 3270 GeV in two bins of rapidity up to|ymax| = 2. Within experimental and theoretical uncertainties, which are of com-parable size, the data are in agreement with predictions of perturbative QCD at next-to-leading order.
The strong coupling constant has been determined in mul-tiple regions of 3-jet mass for values of the scale Q between 0.4 and 1.4 TeV from a comparison between data and theory. The results are consistent with the evolution of the strong coupling as predicted by the renormalization group equa-tion and extend the range in Q where this could be tested up to 1.4 TeV. A combined fit of all data points above a 3-jet mass of 664 GeV gives the value of the strong coupling constant αS(MZ)= 0.1171 ± 0.0013 (exp) ± 0.0024 (PDF) ± 0.0008 (NP)+0.0069−0.0040(scale).
This result, achieved with 3-jet production cross sec-tions, is consistent with determinations previously reported by CMS using the inclusive jet cross section [12] and the ratio of inclusive 3-jet to inclusive 2-jet production cross sec-tions [11]. It is also consistent with a recent determination of αS(MZ)by CMS at the top production threshold using theory at NNLO [68] and with the latest world average of αS(MZ)= 0.1185 ± 0.0006 [60].
Acknowledgments We congratulate our colleagues in the CERN
accelerator departments for the excellent performance of the LHC and thank the technical and administrative staffs at CERN and at other CMS institutes for their contributions to the success of the CMS effort. In addition, we gratefully acknowledge the computing centres and per-sonnel of the Worldwide LHC Computing Grid for delivering so effec-tively the computing infrastructure essential to our analyses. Finally, we acknowledge the enduring support for the construction and oper-ation of the LHC and the CMS detector provided by the following funding agencies: the Austrian Federal Ministry of Science, Research and Economy and the Austrian Science Fund; the Belgian Fonds de
la Recherche Scientifique, and Fonds voor Wetenschappelijk Onder-zoek; the Brazilian Funding Agencies (CNPq, CAPES, FAPERJ, and FAPESP); the Bulgarian Ministry of Education and Science; CERN; the Chinese Academy of Sciences, Ministry of Science and Technol-ogy, and National Natural Science Foundation of China; the Colom-bian Funding Agency (COLCIENCIAS); the Croatian Ministry of Sci-ence, Education and Sport, and the Croatian Science Foundation; the Research Promotion Foundation, Cyprus; the Ministry of Education and Research, Estonian Research Council via 4 and IUT23-6 and European Regional Development Fund, Estonia; the Academy of Finland, Finnish Ministry of Education and Culture, and Helsinki Institute of Physics; the Institut National de Physique Nucléaire et de Physique des Particules/CNRS, and Commissariat à l’Énergie Atom-ique et aux Énergies Alternatives/CEA, France; the Bundesministerium für Bildung und Forschung, Deutsche Forschungsgemeinschaft, and Helmholtz-Gemeinschaft Deutscher Forschungszentren, Germany; the General Secretariat for Research and Technology, Greece; the National Scientific Research Foundation, and National Innovation Office, Hun-gary; the Department of Atomic Energy and the Department of Science and Technology, India; the Institute for Studies in Theoretical Physics and Mathematics, Iran; the Science Foundation, Ireland; the Istituto Nazionale di Fisica Nucleare, Italy; the Ministry of Science, ICT and Future Planning, and National Research Foundation (NRF), Republic of Korea; the Lithuanian Academy of Sciences; the Ministry of Educa-tion, and University of Malaya (Malaysia); the Mexican Funding Agen-cies (CINVESTAV, CONACYT, SEP, and UASLP-FAI); the Ministry of Business, Innovation and Employment, New Zealand; the Pakistan Atomic Energy Commission; the Ministry of Science and Higher Edu-cation and the National Science Centre, Poland; the Fundação para a Ciência e a Tecnologia, Portugal; JINR, Dubna; the Ministry of Edu-cation and Science of the Russian Federation, the Federal Agency of Atomic Energy of the Russian Federation, Russian Academy of Sci-ences, and the Russian Foundation for Basic Research; the Ministry of Education, Science and Technological Development of Serbia; the Secretaría de Estado de Investigación, Desarrollo e Innovación and Pro-grama Consolider-Ingenio 2010, Spain; the Swiss Funding Agencies (ETH Board, ETH Zurich, PSI, SNF, UniZH, Canton Zurich, and SER); the Ministry of Science and Technology, Taipei; the Thailand Center of Excellence in Physics, the Institute for the Promotion of Teaching Science and Technology of Thailand, Special Task Force for Activat-ing Research and the National Science and Technology Development Agency of Thailand; the Scientific and Technical Research Council of Turkey, and Turkish Atomic Energy Authority; the National Academy of Sciences of Ukraine, and State Fund for Fundamental Researches, Ukraine; the Science and Technology Facilities Council, UK; the US Department of Energy, and the US National Science Foundation. Indi-viduals have received support from the Marie-Curie programme and the European Research Council and EPLANET (European Union); the Lev-entis Foundation; the A. P. Sloan Foundation; the Alexander von Hum-boldt Foundation; the Belgian Federal Science Policy Office; the Fonds pour la Formation à la Recherche dans l’Industrie et dans l’Agriculture (FRIA-Belgium); the Agentschap voor Innovatie door Wetenschap en Technologie (IWT-Belgium); the Ministry of Education, Youth and Sports (MEYS) of the Czech Republic; the Council of Science and Industrial Research, India; the HOMING PLUS programme of Foun-dation for Polish Science, cofinanced from European Union, Regional Development Fund; the Compagnia di San Paolo (Torino); the Con-sorzio per la Fisica (Trieste); MIUR project 20108T4XTM (Italy); the Thalis and Aristeia programmes cofinanced by EU-ESF and the Greek NSRF; and the National Priorities Research Program by Qatar National Research Fund.
Open Access This article is distributed under the terms of the Creative
Commons Attribution 4.0 International License (http://creativecomm ons.org/licenses/by/4.0/), which permits unrestricted use, distribution, and reproduction in any medium, provided you give appropriate credit
to the original author(s) and the source, provide a link to the Creative Commons license, and indicate if changes were made.
Funded by SCOAP3.
References
1. ATLAS Collaboration, Measurement of dijet cross sections in pp collisions at 7 TeV centre-of-mass energy using the ATLAS detec-tor. JHEP 05, 059 (2014). doi:10.1007/JHEP0.arXiv:1312.3524
2. ATLAS Collaboration, Measurement of the inclusive jet cross sec-tion in pp collisions at √s= 2.76 TeV and comparison to the inclu-sive jet cross section at √s= 7 TeV using the ATLAS detector. Eur. Phys. J. C 73, 2509 (2013). doi:10.1140/epjc/s10052-013-2509-4.
arXiv:1304.4739
3. CMS Collaboration, Measurements of differential jet cross sections in proton–proton collisions at √s = 7TeV with the CMS detec-tor. Phys. Rev. D 87, 112002 (2012). doi:10.1103/PhysRevD.87. 112002
4. CMS Collaboration, Measurement of the inclusive jet cross section in pp collisions at √s = 7 TeV. Phys. Rev. Lett. 107, 132001 (2011). doi:10.1103/PhysRevLett.107.132001
5. CMS Collaboration, Measurement of the differential dijet produc-tion cross secproduc-tion in proton-proton collisions at √s= 7TeV. Phys. Lett. B 700, 187 (2011). doi:10.1016/j.physletb.2011.05.027
6. ATLAS Collaboration, Measurement of inclusive jet and dijet cross sections in proton-proton collisions at 7 TeV centre-of-mass energy with the ATLAS detector. Eur. Phys. J. C 71, 1512 (2011). doi:10. 1140/epjc/s10052-010-1512-2.arXiv:1009.5908
7. D0 Collaboration, Measurement of three-jet differential cross sections dσ3jet/d M3jet in p¯p collisions at √s = 1.96 TeV. Phys. Lett. B 704, 434 (2011). doi:10.1016/j.physletb.2011.09.048.
arXiv:1104.1986
8. ATLAS Collaboration, Measurement of three-jet production cross-sections in pp collisions at 7 TeV centre-of-mass energy using the ATLAS detector. Eur. Phys. J. C (2014, submitted).
arXiv:1411.1855
9. Z. Nagy, Three-jet cross sections in hadron-hadron collisions at next-to-leading order. Phys. Rev. Lett. 88, 122003 (2002). doi:10. 1103/PhysRevLett.88.122003.arXiv:hep-ph/0110315
10. Z. Nagy, Next-to-leading order calculation of three-jet observables in hadron–hadron collisions. Phys. Rev. D 68, 094002 (2003). doi:10.1103/PhysRevD.68.094002.arXiv:hep-ph/0307268
11. CMS Collaboration, Measurement of the ratio of the inclusive 3-jet cross section to the inclusive 2-jet cross section in pp collisions at √s= 7TeV and first determination of the strong coupling constant in the TeV range. Eur. Phys. J. C 73, 2604 (2013). doi:10.1140/epjc/ s10052-013-2604-6
12. CMS Collaboration, Constraints on parton distribution functions and extraction of the strong coupling constant from the inclusive jet cross section in pp collisions at √s = 7 TeV. Eur. Phys. J. C (2014, Submitted).arXiv:1410.6765
13. M. Cacciari, G.P. Salam, G. Soyez, The anti-ktjet clustering algo-rithm. JHEP 04, 063 (2008). doi:10.1088/1126-6708/2008/04/063.
arXiv:0802.1189
14. M. Cacciari, G.P. Salam, G. Soyez, FastJet user manual. Eur. Phys. J. C 72, 1896 (2012). doi:10.1140/epjc/s10052-012-1896-2.
arXiv:1111.6097
15. CMS Collaboration, Measurement of the ratio of inclusive jet cross sections using the anti-kTalgorithm with radius parameters R = 0.5 and 0.7 in pp collisions at √s = 7 TeV. Phys. Rev. D 90, 072006 (2014). doi:10.1103/PhysRevD.90.072006.arXiv:1406.0324
16. CMS Collaboration, Particle-flow event reconstruction in CMS and performance for jets, taus, and Emiss
T . In: CMS Physics Analysis Summary CMS-PAS-PFT-09-001 (2009)
17. CMS Collaboration, Commissioning of the particle-flow event reconstruction with the first LHC collisions recorded in the CMS detector. In: CMS Physics Analysis Summary CMS-PAS-PFT-10-001 (2010)
18. CMS Collaboration, Determination of the jet energy scale in CMS with pp collisions at √s = 7 TeV. In: CMS Physics Analysis Summary CMS-PAS-JME-10-010 (2010)
19. CMS Collaboration, Determination of jet energy calibration and transverse momentum resolution in CMS. J. Instrum. 6, P11002 (2011). doi:10.1088/1748-0221/6/11/P11002
20. CMS Collaboration, The CMS experiment at the CERN LHC. JINST 03, S08004 (2008). doi:10.1088/1748-0221/3/08/S08004
21. CMS Collaboration, Tracking and primary vertex results in first 7 TeV collisions. In: CMS Physics Analysis Summary CMS-PAS-TRK-10-005 (2010)
22. CMS Collaboration, Calorimeter jet quality criteria for the first CMS collision data. In: CMS Physics Analysis Summary CMS-PAS-JME-09-008 (2010)
23. G. D’Agostini, A multidimensional unfolding method based on Bayes’ theorem. Nucl. Instrum. Meth. A 362, 487 (1995). doi:10. 1016/0168-9002(95)00274-X
24. T. Sjöstrand, S. Mrenna, P. Skands, PYTHIA 6.4 physics and man-ual. JHEP 05, 026 (2006). doi:10.1088/1126-6708/2006/05/026.
arXiv:hep-ph/0603175
25. R. Field, Early LHC underlying event data-findings and surprises. In: 21st Hadron Collider Physics Symposium (HCP 2010). Toronto, Ontario, Canada, August 23–27 (2010).arXiv:1010.3558
26. M. Bähr et al., Herwig++ physics and manual. Eur. Phys. J. C 58, 639 (2008). doi:10.1140/epjc/s10052-008-0798-9.
arXiv:0803.0883
27. T. Sjöstrand, P.Z. Skands, Transverse-momentum-ordered show-ers and interleaved multiple interactions. Eur. Phys. J. C 39, 129 (2005). doi:10.1140/epjc/s2004-02084-y.arXiv:hep-ph/0408302
28. S. Gieseke, P. Stephens, B. Webber, New formalism for QCD parton showers. JHEP 12, 045 (2003). doi:10.1088/1126-6708/2003/12/ 045.arXiv:hep-ph/0310083
29. B. Andersson, G. Gustafson, G. Ingelman, T. Sjöstrand, Parton fragmentation and string dynamics. Phys. Rept. 97, 31 (1983). doi:10.1016/0370-1573(83)90080-7
30. B. Andersson, G. Gustafson, B. Söderberg, A general model for jet fragmentation. Z. Phys. C 20, 317 (1983). doi:10.1007/ BF01407824
31. T. Sjöstrand, The merging of jets. Phys. Lett. B 142, 420 (1984). doi:10.1016/0370-2693(84)91354-6
32. B.R. Webber, A QCD model for jet fragmentation including soft gluon interference. Nucl. Phys. B 238, 492 (1984). doi:10.1016/ 0550-3213(84)90333-X
33. T. Sjöstrand, M. van Zijl, A multiple-interaction model for the event structure in hadron collisions. Phys. Rev. D 36, 2019 (1987). doi:10.1103/PhysRevD.36.2019
34. M. Bähr, S. Gieseke, M.H. Seymour, Simulation of multiple par-tonic interactions in Herwig++. JHEP 07, 076 (2008). doi:10.1088/ 1126-6708/2008/07/076.arXiv:0803.3633
35. CMS Collaboration, Absolute calibration of the luminosity mea-surement at CMS: Winter 2012 update. In: CMS Physics Analysis Summary CMS-PAS-SMP-12-008 (2012)
36. S. Dittmaier, A. Huss, C. Speckner, Weak radiative corrections to dijet production at hadron colliders. JHEP 11, 095 (2012). doi:10. 1007/JHEP11(2012)095.arXiv:1210.0438
37. D. Britzger, K. Rabbertz, F. Stober, M. Wobisch, New features in version 2 of the fastNLO project. In: 20th International Workshop on Deep-Inelastic Scattering and Related Subjects (DIS 2012), p. 217. Bonn, Germany, March 26–30 (2012).arXiv:1208.3641. doi:10.3204/DESY-PROC-2012-02/165
38. M.R. Whalley, D. Bourilkov, R.C. Group, The Les Houches Accord PDFs (LHAPDF) and LHAGLUE (2005).arXiv:hep-ph/0508110
39. S. Alekhin, J. Blümlein, S. Moch, Parton distribution functions and benchmark cross sections at next-to-next-to-leading order. Phys. Rev. D 86, 054009 (2012). doi:10.1103/PhysRevD.86.054009.
arXiv:1202.2281
40. H.-L. Lai et al., New parton distributions for collider physics. Phys. Rev. D 82, 074024 (2010). doi:10.1103/PhysRevD.82.074024.
arXiv:1007.2241
41. JHEP Combined measurement and QCD analysis of the inclusive e±pscattering cross sections at HERA. 01, 109 (2010). doi:10. 1007/JHEP01(2010)109.arXiv:0911.0884
42. A.D. Martin, W.J. Stirling, R.S. Thorne, G. Watt, Parton distribu-tions for the LHC. Eur. Phys. J. C 63, 189 (2009). doi:10.1140/ epjc/s10052-009-1072-5.arXiv:0901.0002
43. A.D. Martin, W.J. Stirling, R.S. Thorne, G. Watt, Uncertainties on αSin global PDF analyses and implications for predicted hadronic cross sections. Eur. Phys. J. C 64, 653 (2009). doi:10.1140/epjc/ s10052-009-1164-2.arXiv:0905.3531
44. NNPDF Collaboration, Impact of heavy quark masses on parton distributions and LHC phenomenology. Nucl. Phys. B 849, 296 (2011). doi:10.1016/j.nuclphysb.2011.03.021.arXiv:1101.1300
45. T. Gleisberg et al., Event generation with SHERPA 1.1. JHEP 02, 007 (2009). doi:10.1088/1126-6708/2009/02/007.
arXiv:0811.4622
46. J. Alwall et al., MadGraph 5: going beyond. JHEP 06, 128 (2011). doi:10.1007/JHEP06(2011)128.arXiv:1106.0522
47. J.-C. Winter, F. Krauss, Initial-state showering based on colour dipoles connected to incoming parton lines. JHEP 07, 040 (2008). doi:10.1088/1126-6708/2008/07/040.arXiv:0712.3913
48. S. Schumann, F. Krauss, A parton shower algorithm based on Catani–Seymour dipole factorisation. JHEP 03, 038 (2008). doi:10. 1088/1126-6708/2008/03/038.arXiv:0709.1027
49. J.-C. Winter, F. Krauss, G. Soff, A modified cluster hadroniza-tion model. Eur. Phys. J. C 36, 381 (2004). doi:10.1140/epjc/ s2004-01960-8.arXiv:hep-ph/0311085
50. J. Pumplin et al., Uncertainties of predictions from par-ton distribution functions II: the Hessian method. Phys. Rev. D 65, 014013 (2001). doi:10.1103/PhysRevD.65.014013.
arXiv:hep-ph/0101032
51. J. Pumplin et al., New generation of parton distributions with uncer-tainties from global QCD analysis. JHEP 07, 012 (2002). doi:10. 1088/1126-6708/2002/07/012.arXiv:hep-ph/0201195
52. NNPDF Collaboration, A first unbiased global NLO deter-mination of parton distributions and their uncertainties. Nucl. Phys. B 838, 136 (2010). doi:10.1016/j.nuclphysb.2010.05.008.
arXiv:1002.4407
53. L. Lyons, A.J. Martin, D.H. Saxon, On the determination of the B lifetime by combining the results of different experiments. Phys. Rev. D 41, 982 (1990). doi:10.1103/PhysRevD.41.982
54. G. D’Agostini, Bayesian reasoning in data analysis: a critical introduction(World Scientific, Singapore, 2003)
55. NNPDF Collaboration, Fitting parton distribution data with multi-plicative normalization uncertainties. JHEP 05, 075 (2010). doi:10. 1007/JHEP05(2010)075.arXiv:0912.2276
56. M. Glück, E. Reya, A. Vogt, Dynamical parton distributions revis-ited. Eur. Phys. J. C 5, 461 (1998). doi:10.1007/s100520050289.
arXiv:hep-ph/9806404
57. G.P. Salam, J. Rojo, A higher order perturbative parton evolu-tion toolkit (HOPPET). Comput. Phys. Commun. 180, 120 (2009). doi:10.1016/j.cpc.2008.08.010.arXiv:0804.3755
58. B. Schmidt, M. Steinhauser, CRunDec: a C++ package for running and decoupling of the strong coupling and quark masses. Comput. Phys. Commun. 183, 1845 (2012). doi:10.1016/j.cpc.2012.03.023.
arXiv:1201.6149
59. K.G. Chetyrkin, J.H. Kuhn, M. Steinhauser, RunDec: a mathemat-ica package for running and decoupling of the strong coupling and
60. Particle Data Group, K.A. Olive et al., Review of particle physics. Chin. Phys. C 38, 090001 (2014). doi:10.1088/1674-1137/38/9/ 090001
61. D0 Collaboration, Determination of the strong coupling constant from the inclusive jet cross section in p¯p collisions at√s= 1.96 TeV. Phys. Rev. D 80, 111107 (2009). doi:10.1103/PhysRevD.80. 111107.arXiv:0911.2710
62. D0 Collaboration, Measurement of angular correlations of jets at√ s= 1.96 TeV and determination of the strong coupling at high momentum transfers. Phys. Lett. B 718, 56 (2012). doi:10.1016/j. physletb.2012.10.003.arXiv:1207.4957
63. ZEUS Collaboration, Jet-radius dependence of inclusive-jet cross-sections in deep inelastic scattering at HERA. Phys. Lett. B 649, 12 (2007). doi:10.1016/j.physletb.2007.03.039.
arXiv:hep-ex/0701039
64. H1 Collaboration, Deep inelastic inclusive ep scattering at low x and a determination of αS. Eur. Phys. J. C 21, 33 (2001). doi:10. 1007/s100520100720.arXiv:hep-ex/0012053
65. JADE Collaboration, Measurement of the strong coupling αS from the four-jet rate in e+e− annihilation using JADE data. Eur. Phys. J. C 48, 3 (2006). doi:10.1140/epjc/s2006-02625-4.
arXiv:0707.0392
66. DELPHI Collaboration, The measurement of αS from event shapes with the DELPHI detector at the highest LEP energies. Eur. Phys. J. C 37, 1 (2004). doi:10.1140/epjc/s2004-01889-x.
arXiv:hep-ex/0406011
67. S. Martí i García, Review of αsmeasurements at LEP 2 (1997). arXiv:hep-ex/9704016
68. CMS Collaboration, Determination of the top-quark pole mass and strong coupling constant from the t¯t production cross section in pp collisions at √s = 7 TeV. Phys. Lett. B 728, 496 (2014). doi:10. 1016/j.physletb.2013.12.009.arXiv:1307.1907
69. H1 Collaboration, Jet production in ep collisions at high Q2and determination of αs. Eur. Phys. J. C 65, 363 (2010). doi:10.1140/ epjc/s10052-009-1208-7.arXiv:0904.3870
70. H1 Collaboration, Jet production in ep collisions at low Q2and determination of αs. Eur. Phys. J. C 67, 1 (2010). doi:10.1140/ epjc/s10052-010-1282-x.arXiv:0911.5678
71. ZEUS Collaboration, Inclusive-jet photoproduction at HERA and determination of αS. Nucl. Phys. B 864, 1 (2012). doi:10.1016/j. nuclphysb.2012.06.006.arXiv:1205.6153
72. H1 Collaboration, Measurement of multijet production in EP colli-sions at high Q2and determination of the strong coupling α
s. Eur. Phys. J. C (2014).arXiv:1406.4709
CMS Collaboration
Yerevan Physics Institute, Yerevan, Armenia V. Khachatryan, A. M. Sirunyan, A. Tumasyan
Institut für Hochenergiephysik der OeAW, wien, Austria
W. Adam, T. Bergauer, M. Dragicevic, J. Erö, C. Fabjan1, M. Friedl, R. Frühwirth1, V. M. Ghete, C. Hartl, N. Hörmann,
J. Hrubec, M. Jeitler1, W. Kiesenhofer, V. Knünz, M. Krammer1, I. Krätschmer, D. Liko, I. Mikulec, D. Rabady2,
B. Rahbaran, H. Rohringer, R. Schöfbeck, J. Strauss, A. Taurok, W. Treberer-Treberspurg, W. Waltenberger, C.-E. Wulz1
National Centre for Particle and High Energy Physics, Minsk, Belarus V. Mossolov, N. Shumeiko, J. Suarez Gonzalez
Universiteit Antwerpen, Antwerpen, Belgium
S. Alderweireldt, M. Bansal, S. Bansal, T. Cornelis, E. A. De Wolf, X. Janssen, A. Knutsson, S. Luyckx, S. Ochesanu, R. Rougny, M. Van De Klundert, H. Van Haevermaet, P. Van Mechelen, N. Van Remortel, A. Van Spilbeeck
Vrije Universiteit Brussel, Brussels, Belgium
F. Blekman, S. Blyweert, J. D’Hondt, N. Daci, N. Heracleous, J. Keaveney, S. Lowette, M. Maes, A. Olbrechts, Q. Python, D. Strom, S. Tavernier, W. Van Doninck, P. Van Mulders, G. P. Van Onsem, I. Villella
Université Libre de Bruxelles, Bruxelles, Belgium
C. Caillol, B. Clerbaux, G. De Lentdecker, D. Dobur, L. Favart, A. P. R. Gay, A. Grebenyuk, A. Léonard, A. Mohammadi, L. Perniè2, T. Reis, T. Seva, L. Thomas, C. Vander Velde, P. Vanlaer, J. Wang, F. Zenoni
Ghent University, Ghent, Belgium
V. Adler, K. Beernaert, L. Benucci, A. Cimmino, S. Costantini, S. Crucy, S. Dildick, A. Fagot, G. Garcia, J. Mccartin, A. A. Ocampo Rios, D. Ryckbosch, S. Salva Diblen, M. Sigamani, N. Strobbe, F. Thyssen, M. Tytgat, E. Yazgan, N. Zaganidis
Université Catholique de Louvain, Louvain-la-Neuve, Belgium
S. Basegmez, C. Beluffi3, G. Bruno, R. Castello, A. Caudron, L. Ceard, G. G. Da Silveira, C. Delaere, T. du Pree,
D. Favart, L. Forthomme, A. Giammanco4, J. Hollar, A. Jafari, P. Jez, M. Komm, V. Lemaitre, C. Nuttens, D. Pagano,
L. Perrini, A. Pin, K. Piotrzkowski, A. Popov5, L. Quertenmont, M. Selvaggi, M. Vidal Marono, J. M. Vizan Garcia
Université de Mons, Mons, Belgium
Centro Brasileiro de Pesquisas Fisicas, Rio de Janeiro, Brazil
W. L. Aldá Júnior, G. A. Alves, L. Brito, M. Correa Martins Junior, T. Dos Reis Martins, C. Mora Herrera, M. E. Pol Universidade do Estado do Rio de Janeiro, Rio de Janeiro, Brazil
W. Carvalho, J. Chinellato6, A. Custódio, E. M. Da Costa, D. De Jesus Damiao, C. De Oliveira Martins,
S. Fonseca De Souza, H. Malbouisson, D. Matos Figueiredo, L. Mundim, H. Nogima, W. L. Prado Da Silva, J. Santaolalla, A. Santoro, A. Sznajder, E. J. Tonelli Manganote6, A. Vilela Pereira
Universidade Estadual Paulistaa, Universidade Federal do ABCb, São Paulo, Brazil
C. A. Bernardesb, S. Dograa, T. R. Fernandez Perez Tomeia, E. M. Gregoresb, P. G. Mercadanteb, S. F. Novaesa, Sandra S. Padulaa
Institute for Nuclear Research and Nuclear Energy, Sofia, Bulgaria
A. Aleksandrov, V. Genchev2, P. Iaydjiev, A. Marinov, S. Piperov, M. Rodozov, S. Stoykova, G. Sultanov, V. Tcholakov,
M. Vutova
University of Sofia, Sofia, Bulgaria
A. Dimitrov, I. Glushkov, R. Hadjiiska, V. Kozhuharov, L. Litov, B. Pavlov, P. Petkov Institute of High Energy Physics, Beijing, China
J. G. Bian, G. M. Chen, H. S. Chen, M. Chen, R. Du, C. H. Jiang, R. Plestina7, F. Romeo, J. Tao, Z. Wang State Key Laboratory of Nuclear Physics and Technology, Peking University, Beijing, China C. Asawatangtrakuldee, Y. Ban, Q. Li, S. Liu, Y. Mao, S. J. Qian, D. Wang, W. Zou
Universidad de Los Andes, Bogota, Colombia
C. Avila, L. F. Chaparro Sierra, C. Florez, J. P. Gomez, B. Gomez Moreno, J. C. Sanabria
Faculty of Electrical Engineering, Mechanical Engineering and Naval Architecture, University of Split, Split, Croatia N. Godinovic, D. Lelas, D. Polic, I. Puljak
Faculty of Science, University of Split, Split, Croatia Z. Antunovic, M. Kovac
Institute Rudjer Boskovic, Zagreb, Croatia
V. Brigljevic, K. Kadija, J. Luetic, D. Mekterovic, L. Sudic University of Cyprus, Nicosia, Cyprus
A. Attikis, G. Mavromanolakis, J. Mousa, C. Nicolaou, F. Ptochos, P. A. Razis Charles University, Prague, Czech Republic
M. Bodlak, M. Finger, M. Finger Jr.8
Academy of Scientific Research and Technology of the Arab Republic of Egypt, Egyptian Network of High Energy Physics, Cairo, Egypt
Y. Assran9, A. Ellithi Kamel10, M. A. Mahmoud11, A. Radi12,13
National Institute of Chemical Physics and Biophysics, Tallinn, Estonia M. Kadastik, M. Murumaa, M. Raidal, A. Tiko
Department of Physics, University of Helsinki, Helsinki, Finland P. Eerola, G. Fedi, M. Voutilainen
Helsinki Institute of Physics, Helsinki, Finland
J. Härkönen, V. Karimäki, R. Kinnunen, M. J. Kortelainen, T. Lampén, K. Lassila-Perini, S. Lehti, T. Lindén, P. Luukka, T. Mäenpää, T. Peltola, E. Tuominen, J. Tuominiemi, E. Tuovinen, L. Wendland
Lappeenranta University of Technology, Lappeenranta, Finland J. Talvitie, T. Tuuva
DSM/IRFU, CEA/Saclay, Gif-sur-Yvette, France
M. Besancon, F. Couderc, M. Dejardin, D. Denegri, B. Fabbro, J. L. Faure, C. Favaro, F. Ferri, S. Ganjour, A. Givernaud, P. Gras, G. Hamel de Monchenault, P. Jarry, E. Locci, J. Malcles, J. Rander, A. Rosowsky, M. Titov
Laboratoire Leprince-Ringuet, Ecole Polytechnique, IN2P3-CNRS, Palaiseau, France
S. Baffioni, F. Beaudette, P. Busson, C. Charlot, T. Dahms, M. Dalchenko, L. Dobrzynski, N. Filipovic, A. Florent, R. Granier de Cassagnac, L. Mastrolorenzo, P. Miné, C. Mironov, I. N. Naranjo, M. Nguyen, C. Ochando, P. Paganini, S. Regnard, R. Salerno, J. B. Sauvan, Y. Sirois, C. Veelken, Y. Yilmaz, A. Zabi
Institut Pluridisciplinaire Hubert Curien, Université de Strasbourg, Université de Haute Alsace Mulhouse, CNRS/IN2P3, Strasbourg, France
J.-L. Agram14, J. Andrea, A. Aubin, D. Bloch, J.-M. Brom, E. C. Chabert, C. Collard, E. Conte14, J.-C. Fontaine14,
D. Gelé, U. Goerlach, C. Goetzmann, A.-C. Le Bihan, P. Van Hove
Centre de Calcul de l’Institut National de Physique Nucleaire et de Physique des Particules, CNRS/IN2P3, Villeurbanne, France
S. Gadrat
Institut de Physique Nucléaire de Lyon, Université de Lyon, Université Claude Bernard Lyon 1, CNRS-IN2P3, Villeurbanne, France
S. Beauceron, N. Beaupere, G. Boudoul2, E. Bouvier, S. Brochet, C. A. Carrillo Montoya, J. Chasserat, R. Chierici,
D. Contardo2, P. Depasse, H. El Mamouni, J. Fan, J. Fay, S. Gascon, M. Gouzevitch, B. Ille, T. Kurca, M. Lethuillier,
L. Mirabito, S. Perries, J. D. Ruiz Alvarez, D. Sabes, L. Sgandurra, V. Sordini, M. Vander Donckt, P. Verdier, S. Viret, H. Xiao
Institute of High Energy Physics and Informatization, Tbilisi State University, Tbilisi, Georgia I. Bagaturia15
I. Physikalisches Institut, RWTH Aachen University, Aachen, Germany
C. Autermann, S. Beranek, M. Bontenackels, M. Edelhoff, L. Feld, O. Hindrichs, K. Klein, A. Ostapchuk, A. Perieanu, F. Raupach, J. Sammet, S. Schael, H. Weber, B. Wittmer, V. Zhukov5
III. Physikalisches Institut A, RWTH Aachen University, Aachen, Germany
M. Ata, M. Brodski, E. Dietz-Laursonn, D. Duchardt, M. Erdmann, R. Fischer, A. Güth, T. Hebbeker, C. Heidemann, K. Hoepfner, D. Klingebiel, S. Knutzen, P. Kreuzer, M. Merschmeyer, A. Meyer, P. Millet, M. Olschewski, K. Padeken, P. Papacz, H. Reithler, S. A. Schmitz, L. Sonnenschein, D. Teyssier, S. Thüer, M. Weber
III. Physikalisches Institut B, RWTH Aachen University, Aachen, Germany
V. Cherepanov, Y. Erdogan, G. Flügge, H. Geenen, M. Geisler, W. Haj Ahmad, A. Heister, F. Hoehle, B. Kargoll, T. Kress, Y. Kuessel, A. Künsken, J. Lingemann2, A. Nowack, I. M. Nugent, L. Perchalla, O. Pooth, A. Stahl
Deutsches Elektronen-Synchrotron, Hamburg, Germany
I. Asin, N. Bartosik, J. Behr, W. Behrenhoff, U. Behrens, A. J. Bell, M. Bergholz16, A. Bethani, K. Borras, A. Burgmeier,
A. Cakir, L. Calligaris, A. Campbell, S. Choudhury, F. Costanza, C. Diez Pardos, S. Dooling, T. Dorland, G. Eckerlin, D. Eckstein, T. Eichhorn, G. Flucke, J. Garay Garcia, A. Geiser, P. Gunnellini, J. Hauk, M. Hempel16, D. Horton, H. Jung, A. Kalogeropoulos, M. Kasemann, P. Katsas, J. Kieseler, C. Kleinwort, D. Krücker, W. Lange, J. Leonard, K. Lipka, A. Lobanov, W. Lohmann16, B. Lutz, R. Mankel, I. Marfin16, I.-A. Melzer-Pellmann, A. B. Meyer, G. Mittag, J. Mnich,
A. Mussgiller, S. Naumann-Emme, A. Nayak, O. Novgorodova, E. Ntomari, H. Perrey, D. Pitzl, R. Placakyte, A. Raspereza, P. M. Ribeiro Cipriano, B. Roland, E. Ron, M. Ö. Sahin, J. Salfeld-Nebgen, P. Saxena, R. Schmidt16,
T. Schoerner-Sadenius, M. Schröder, C. Seitz, S. Spannagel, A. D. R. Vargas Trevino, R. Walsh, C. Wissing University of Hamburg, Hamburg, Germany
M. Aldaya Martin, V. Blobel, M. Centis Vignali, A. R. Draeger, J. Erfle, E. Garutti, K. Goebel, M. Görner, J. Haller, M. Hoffmann, R. S. Höing, H. Kirschenmann, R. Klanner, R. Kogler, J. Lange, T. Lapsien, T. Lenz, I. Marchesini, J. Ott, T. Peiffer, N. Pietsch, J. Poehlsen, T. Poehlsen, D. Rathjens, C. Sander, H. Schettler, P. Schleper, E. Schlieckau,
Institut für Experimentelle Kernphysik, Karlsruhe, Germany
C. Barth, C. Baus, J. Berger, C. Böser, E. Butz, T. Chwalek, W. De Boer, A. Descroix, A. Dierlamm, M. Feindt, F. Frensch, M. Giffels, F. Hartmann2, T. Hauth2, U. Husemann, I. Katkov5, A. Kornmayer2, E. Kuznetsova, P. Lobelle Pardo,
M. U. Mozer, Th. Müller, A. Nürnberg, G. Quast, K. Rabbertz, F. Ratnikov, S. Röcker, G. Sieber, H. J. Simonis, F. M. Stober, R. Ulrich, J. Wagner-Kuhr, S. Wayand, T. Weiler, R. Wolf
Institute of Nuclear and Particle Physics (INPP), NCSR Demokritos, Aghia Paraskevi, Greece
G. Anagnostou, G. Daskalakis, T. Geralis, V. A. Giakoumopoulou, A. Kyriakis, D. Loukas, A. Markou, C. Markou, A. Psallidas, I. Topsis-Giotis
University of Athens, Athens, Greece
A. Agapitos, S. Kesisoglou, A. Panagiotou, N. Saoulidou, E. Stiliaris University of Ioánnina, Ioánnina, Greece
X. Aslanoglou, I. Evangelou, G. Flouris, C. Foudas, P. Kokkas, N. Manthos, I. Papadopoulos, E. Paradas Wigner Research Centre for Physics, Budapest, Hungary
G. Bencze, C. Hajdu, P. Hidas, D. Horvath17, F. Sikler, V. Veszpremi, G. Vesztergombi18, A. J. Zsigmond
Institute of Nuclear Research ATOMKI, Debrecen, Hungary N. Beni, S. Czellar, J. Karancsi19, J. Molnar, J. Palinkas, Z. Szillasi University of Debrecen, Debrecen, Hungary
P. Raics, Z. L. Trocsanyi, B. Ujvari
National Institute of Science Education and Research, Bhubaneswar, India S. K. Swain
Panjab University, Chandigarh, India
S. B. Beri, V. Bhatnagar, R. Gupta, U. Bhawandeep, A. K. Kalsi, M. Kaur, R. Kumar, M. Mittal, N. Nishu, J. B. Singh University of Delhi, Delhi, India
Ashok Kumar, Arun Kumar, S. Ahuja, A. Bhardwaj, B. C. Choudhary, A. Kumar, S. Malhotra, M. Naimuddin, K. Ranjan, V. Sharma
Saha Institute of Nuclear Physics, Kolkata, India
S. Banerjee, S. Bhattacharya, K. Chatterjee, S. Dutta, B. Gomber, Sa. Jain, Sh. Jain, R. Khurana, A. Modak, S. Mukherjee, D. Roy, S. Sarkar, M. Sharan
Bhabha Atomic Research Centre, Mumbai, India
A. Abdulsalam, D. Dutta, S. Kailas, V. Kumar, A. K. Mohanty2, L. M. Pant, P. Shukla, A. Topkar
Tata Institute of Fundamental Research, Mumbai, India
T. Aziz, S. Banerjee, S. Bhowmik20, R. M. Chatterjee, R. K. Dewanjee, S. Dugad, S. Ganguly, S. Ghosh, M. Guchait,
A. Gurtu21, G. Kole, S. Kumar, M. Maity20, G. Majumder, K. Mazumdar, G. B. Mohanty, B. Parida, K. Sudhakar,
N. Wickramage22
Institute for Research in Fundamental Sciences (IPM), Tehran, Iran
H. Bakhshiansohi, H. Behnamian, S. M. Etesami23, A. Fahim24, R. Goldouzian, M. Khakzad, M. Mohammadi Najafabadi,
M. Naseri, S. Paktinat Mehdiabadi, F. Rezaei Hosseinabadi, B. Safarzadeh25, M. Zeinali
University College Dublin, Dublin, Ireland M. Felcini, M. Grunewald
INFN Sezione di Baria, Università di Barib, Politecnico di Baric, Bari, Italy
M. Abbresciaa,b, L. Barbonea,b, C. Calabriaa,b, S. S. Chhibraa,b, A. Colaleoa, D. Creanzaa,c, N. De Filippisa,c, M. De Palmaa,b, L. Fiorea, G. Iasellia,c, G. Maggia,c, M. Maggia, S. Mya,c, S. Nuzzoa,b, A. Pompilia,b, G. Pugliesea,c, R. Radognaa,b,2, G. Selvaggia,b, L. Silvestrisa,2, R. Vendittia,b, G. Zitoa