Unione Europea Università Degli Studi di Salerno
Dottorato in Biochimica e Patologia dell’Azione dei Farmaci
IX Ciclo - Nuova Serie
2007 - 2011
Trafficking from the Endoplasmic Reticulum to
the Golgi Complex and Gene Expression Profiling
during the Cell Stress
Dottorando:
Dott. Giuseppina Amodio
Tutor:
Ch. mo Prof. Paolo Remondelli
Coordinatore:
“Considerate la vostra semenza,
fatti non foste a viver come bruti,
ma per seguir virtute e canoscenza”
~ I ~
ABSTRACT pag. 1
RIASSUNTO pag. 2
Chapter I
Introduction
Protein Quality Control In and Out of ER Pag. 3
The exit from ER: Assembly, Organization and
Function of the COPII Coat Pag. 6
Chapter II
Materials and Methods
Antibodies Pag. 11
Construction of Plasmids Pag. 11
Cell Cultures and Drug Treatments Pag. 11
Immunofluorescence Analysis Pag. 12
Western Blot Analysis Pag. 12
Immuno Electron Microscopy Analysis Pag. 12
Cell Fractionation by Discontinuos Sucrose Gradient Pag. 13 Cell Transfection and Analysis of TS045G Protein Transport Pag. 13
Trimerization Assay Pag. 13
Transfection and FRAP Analysis Pag. 14
Streptolysin O Assay Pag. 14
3XFLAG-Sec23a and HA-Ubiquitin Co-Immunoprecipitation Pag. 15 Identification of Sec23a Ubiquitination Sites Pag. 15
RNA Extraction and microRNA Microarray Pag. 15
Northern Blot Analysis Pag. 16
Bioinformatics Prediction of microRNA Targets Pag. 16
2D-DIGE Analysis Pag. 16
Chapter III
ER exit and Trafficking to the Golgi Complex
Scientific Background, Rationale and Aims Pag. 19
Results Pag. 20
Discussion Pag. 40
Chapter IV
Gene Expression Profiling during ER Stress
Scientific Background, Rationale and Aims Pag. 44
Results Pag. 44
Discussion Pag. 54
~ II ~
CONCLUSIONS AND PERSPECTIVES pag. 57
ACKNOWELDGEMENTS pag. 58
~ 1 ~
The elucidation of the molecular mechanisms regulating the export from the Endoplasmic Reticulum (ER) and the transport to post-ER compartments of secretory proteins represents the basic aim of the present PhD project.
To ensure that only properly folded proteins exit the ER and locate to their final destination, a quality control system inspects protein folding within the ER. However, several physiological and pathological conditions generate the accumulation of unfolded proteins within the organelle. The ER reacts to this condition, known as ER stress, by turning on the Unfolded Protein Response (UPR), an integrated signal transduction pathway that transforms the unfolding signals into the expression of molecules required to restore protein homeostasis. Notably, the response to the ER stress affects many functions of the secretory pathway and, in particular, the ER-export. Therefore, an essential aim of the present experimental work was to describe the effect of the ER stress on the molecular events that regulate the exit from ER and the trafficking to the Golgi complex. Experimental results suggest that the ER stress response attenuates the ER-to-Golgi trafficking by affecting COPII function. This control occurs by targeting Sec16 protein expression and by modifying Sec23a recycling properties on the ER membrane. The results concerning this part are analyzed and discussed in the chapter III.
Since the UPR carries out its function through the regulation of gene expression, we decided to identify new molecular actors of the UPR control by analyzing gene expression profiles in ER stressed cells. In particular, given the increasing importance of microRNAs in the regulation of several signaling transduction pathways, we analyzed the microRNome changes induced by the UPR activation. In parallel, we characterized the proteome signature in the same stress conditions. The results obtained by the study of microRNome and proteome profiles are described in the chapter IV.
~ 2 ~
Lo scopo del progetto di dottorato è lo studio dei meccanismi molecolari che regolano l’uscita dal Reticolo Endoplasmatico (RE) e il trasporto al Golgi delle proteine secretorie. Un sistema di controllo di qualità opera all’interno del RE per garantire che solo le proteine correttamente conformate possano uscire dal RE e raggiungere la loro destinazione finale. L’alterazione dell’omeostasi proteica, indotta da condizioni fisiologiche o patologiche, determina l’accumulo di proteine non correttamente conformate nel lume del RE generando una condizione di stress. Per reagire a questa situazione, il RE attiva l’Unfolded Protein Response (UPR), un sistema di trasduzione integrato, che trasmette il segnale di unfolding proteico dal RE al nucleo allo scopo di attivare l’espressione di fattori necessari alla ricostituzione dell’omeostasi proteica nel lume del RE. La risposta allo stress del RE coinvolge ogni funzione della via secretoria; in particolare, il controllo dell’uscita dal RE e del trasporto vescicolare potrebbe rappresentare uno strumento fondamentale della risposta adattativa attivata dalla cellula per affrontare la condizione di stress. Pertanto, lo studio delle dinamiche di uscita dal RE e trasporto al Golgi nel corso dello stress del RE rappresentano lo scopo principale di questo lavoro. I risultati ottenuti suggeriscono che lo stress del RE modula il traffico vescicolare dal RE al Golgi attraverso la modulazione dell’assemblaggio del rivestimento proteico COPII. Questo controllo si realizza attraverso la riduzione dei livelli di espressione della proteina Sec16 e la concomitante modulazione delle cinetiche di ricircolo sulla membrana della proteina Sec23a. I risultati relativi a questo aspetto sono analizzati e discussi in dettaglio nel capitolo III.
Poiché la risposta UPR si realizza prevalentemente attraverso il controllo dell’espressione genica, ci siamo proposti anche di identificare nuovi bersagli molecolari dell’UPR attraverso la caratterizzazione dei profili di espressione genica in cellule trattate con tapsigargina. In particolare, considerata la crescente importanza dei microRNA nella regolazione della trasduzione del segnale, abbiamo analizzato le modificazioni del microRNoma indotte dall’UPR. Parallelamente, abbiamo caratterizzato le variazioni del proteoma indotte dall’UPR nelle stesse condizioni. I risultati ottenuti dallo studio dei profili di espressione del microRNoma e del proteoma sono descritti in dettaglio nel capitolo IV.
~ 3 ~
Protein Quality control in and out of ER
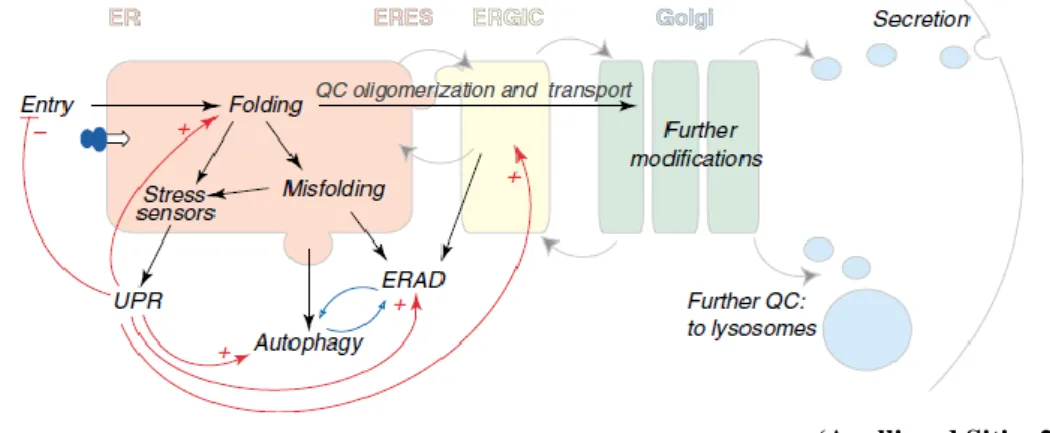
The Endoplasmic Reticulum and Quality ControlIn eukaryotic cells secreted and resident proteins of the endomembrane system fold into their native conformation within the Endoplasmic Reticulum (ER). The ER is a membrane network of tubules and sheets, whose luminal environment contains molecular chaperones and protein-modification enzymes specialized in protein folding. Folding of secretory proteins must be controlled in the tightest way to ensure proper cell functions. Therefore, within the ER a quality control (QC) system guarantees that only properly folded proteins can reach their final destination in the secretory pathway (Anelli and Sitia, 2008; Ellgaard and Helenius, 2003). The final goals of QC are to recognize, retain and eventually induce to degradation aberrant protein conformers (Fig. 1) even after the transport to the ERGIC (ER Golgi Intermediate Compartment) and the cis-Golgi (Anelli et al., 2007; Qiang et al., 2007). When this control is overwhelmed, protein homeostasis within the secretory pathway is impaired and misfolded proteins accumulate within the ER. This condition is commonly referred as ER stress and, to restore protein homeostasis, the cell activates a coordinated signalling pathway, known as the Unfolded Protein Response (UPR) (Ron and Walter, 2007). The activation of the UPR allows the rapid adaptation of ER-folding capacity to the new cellular requirements. This response is required during the physiological processes, such as cell growth and differentiation, when the flux of proteins entering the ER is higher or during special environmental conditions such as hypoxia, oxidative injury, high-fat diet, hypoglycaemia and viral infection. Dysregulation of UPR contributes to several important human diseases, including diabetes, neurodegeneration and cancer (Kim et al., 2008) (Box 1).
_________________________________________________________(Anelli and Sitia, 2008)
Fig. 1 The early secretory pathway. Secretory proteins enter the ER where they attain their native structure (folding), under strict QC scrutiny. Only properly folded and assembled proteins can reach the Golgi, where they are further modified, to be transported to the extracellular space, to the lysosomes or be inserted in the membrane. Gray arrows indicate the direction of vesicles moving among different compartments; dark arrows indicate the pathways followed by cargoes in the early secretory pathway; red lines show homeostatic control pathways (+ stimulatory, - inhibitory). Misfolded proteins are recognized and eventually destined to degradation by ERAD (ER Associated Degradation) or autophagy (which are likely reciprocally
~ 4 ~
regulated, as indicated by the blue arrows). Some misfolded soluble ERAD substrates are transported to ERGIC or cis-Golgi before retrotranslocation and degradation. Too high load for the folding machinery or the accumulation of misfolded proteins activate resident ER stress sensors, which elicit the UPR.
__________________________________________________________________________ Box 1: ER stress related diseases
The Unfolded Protein Response
In mammalian cells, the UPR signalling is initiated by three ER-resident transmembrane proteins: PERK, ATF6 and IRE1. The activation of these three proximal detectors is regulated by Bip/Grp78, an ER resident chaperone that under
~ 5 ~
basal conditions is bound to their luminal domains thus inhibiting their activation. When unfolded proteins accumulate into the ER, Bip dissociates from PERK, ATF6 and IRE1 to preferentially interact with misfolded proteins, thus allowing their activation (Bertolotti et al., 2000). IRE1 is a type-1 transmembrane protein with an N-terminal luminal domain, a cytosolic kinase domain and a cytosolic RNAse domain (Wang et al., 1998). After the dissociation of Bip, the monomers of IRE1 oligomerize into dimers or higher structures, causing trans-autophosphorylation of the kinase domains, which in turn activates the RNAse catalytic domains. Active IRE1 catalyzes the non-conventional splicing of the XBP1 mRNA, which encodes the XBP1 transcription factor (Yoshida et al., 2001). PERK is also a type-1 transmembrane protein that has a cytosolic kinase domain and an N-terminal luminal domain homologous to that of IRE1. Activated PERK phosphorylates the eukaryotic translation initiation factor 2α (eIF2α), which slows down translation initiation (Harding et al., 1999). Concomitantly, translation of the transcription factor ATF4 increases during eIF2α phosphorilation (Harding et al., 2003) thanks to alternative CAP-independent initiation of translation.
ATF6 is an ER resident type-II transmembrane protein that exists as an oxidized monomer, dimer, and oligomer. After dissociation of Bip, the intra/inter molecular disulfide bonds are reduced and the monomeric ATF6 translocates to the Golgi and becames a substrate for SP1 and SP2 proteases that liberate the N-terminal cytosolic domain of ATF6 which has transcriptional activity (Haze et al., 1999; Shen et al., 2005). When the proximal UPR sensors are active, they initiate an adaptive response involving several outputs to restore protein-folding homeostasis in the ER (Fig. 2). Two negative feedback loops can be conceptualized: one fast loop that decreases the influx of proteins into the ER, thanks to the PERK-mediated inhibition of eIF2α, and a slow negative feedback loop that requires de novo mRNA and protein synthesis to increase the folding capacity of the ER through XBP1 and ATF6 transcriptional activity. They increase the transcription rates of genes encoding ER resident chaperones, protein modification enzymes, lipid biosynthetic enzymes and components of the ERAD (ER Associated Degradation) (Yamamoto et al., 2007), to enhance the size of the folding and degradation activities of the ER. In addition, IRE1 is responsible for the rapid degradation of several ER localized mRNAs (Hollien and Weissman, 2006) that, together with PERK-dependent translation attenuation, provides an extended opportunity to fold or degrade the existing unfolded proteins. In particular, the degradation of irreversible unfolded proteins occurs through the ERAD mechanism that involves recognition, retro-translocation in the cytosol of the aberrant proteins and finally degradation by the ubiquitin-proteasomal system (Travers et al., 2000). In addition to ERAD, cells can dispose of protein aggregates difficult to unravel by autophagy. In this process, organelles can be degraded regardless of their size or the folding sate of their constituent proteins. Many of the components that mediate autophagy have been identified as UPR target genes (Yorimitsu et al., 2006) and are important for cells to counteract severe ER stress.
The ultimate output of UPR in cells experiencing irremediable ER stress is the commitment to apoptosis. The two apoptotic pathways that are activated by UPR are mediated by CHOP and JNK proteins. CHOP transcription is induced by ATF4 factor and was found to increase the rate of expression of the pro-apoptotic Bim during severe ER stress (Puthalakath et al., 2007). In parallel, IRE1 initiates a signalling cascade that results in the activation of JNK that finally activates several pro-apoptotic factors such as Bid and Bim (Urano et al., 2000).
~ 6 ~
___________________________________________________(Merksamer and Papa, 2010) Fig. 2 Adaptive responses of UPR (see text for details)
The exit from ER: assembly, organization and function of the
COPII coat
The assembly of the COPII coat
The first membrane trafficking step in the biosynthetic secretory pathway is the export of proteins from the ER, which is mediated by COPII-coated vesicles. COPII is a multiprotein coat consisting of five cytosolic proteins: Sar1, Sec23, Sec24, Sec13 and Sec31 and their isoforms. In particular, the mammalian repertoire consists of: two Sar1 paralogs, Sar1a and Sar1b; two Sec23 paralogs, Sec23a and Sec23b; four Sec24 paralogs, Sec24a, Sec24b, Sec24c, Sec24d; a single Sec13 and two Sec31 paralogs, Sec31a and Sec31b. In cells, Sec23 and Sec24 are found in tight heterodimers, which form the inner COPII coat, whereas Sec13 and Sec31 are found in stable heterotetramers of two subunits of each, which form the outer COPII coat (Barlowe et al., 1994). Biogenesis of COPII vesicles (Fig. 3) is regulated at the most basic level by a GTPase cycle under direction of the small GTPase Sar1. Sar1 is specifically activated on the surface of ER membrane by its guanine nucleotide exchange factor (GEF) Sec12 (Barlowe and Schekman, 1993). Activation to Sar1-GTP exposes an amphipathic α-helix that anchors Sar1-Sar1-GTP to the ER membrane and initiates membrane curvature (Bielli et al., 2005; Lee et al., 2005). Acting as a membrane bound anchor for the other COPII components, activated Sar1 binds and recruits the heterodimer Sec23-Sec24 trough the direct interaction with Se23 (Bi et al., 2002). This interaction has not only a structural role for the assembling of COPII vesicles but has also a catalytic role since Sec23 is a GTPase activating protein
~ 7 ~
(GAP) for Sar1-GTP that is necessary to accelerate the GTPase activity of Sar1 (Yoshihisa et al., 1993). Fully GTPase activity is not realized until the complete COPII coat is assembled following the arrival of the Sec31-Sec13 outer coat that stimulates the GTPase activity of Sar1-Sec23 of approximately tenfold (Antonny et al., 2001). The set of proteins consisting of a membrane-bound Sar1 along with a cargo-loaded Sec23-Sec24 dimer has been termed “pre-budding complex”, a complex that is ready for the activity of Sec13-Sec31 to complete the formation of the vesicle. This outer layer of the coat collects pre-budding complexes and shapes the membrane to form a bud enriched in cargo molecules. To accomplish this task, the Sec13-Sec31 complexes polymerize into cuboctahedrones (Fath et al., 2007; Stagg et al., 2006), whereas Sec31 directly interacts with Sec23 and Sar1 (Bi et al., 2007). Once the coat is assembled in its entirety, GTP hydrolysis by Sar1 is maximal and thereby drives immediate coat disassembly (Antonny et al., 2001) leaving a spherical membrane vesicle roughly 60-70 nm in size.
__________________________________________________(Dancourt and Barlowe, 2010) Fig.3 COPII assembly and the Sar1 GTPase cycle
Cargo and not-cargo regulation of COPII function
The coupling of coat formation to cargo packaging is an intrinsic property of the COPII coat. Sec24 is considered to be the primary subunit responsible for binding to membrane cargo proteins at the ER and concentrating them into the forming vesicles (Miller et al., 2002). Many cargo proteins have specific export-signal sequences in their cytoplasmic domains to mark them for COPII transport. Types of COPII signal sequences include di-hydrophobic (e.g. -FF-), diacidic (e.g. -DxE-), C-Terminal hydrophobic and aromatic motifs (Barlowe, 2003; Wendeler et al., 2007). Moreover, cells are endowed with multiple Sec24p isoforms to greatly expand the diversity of export signals that can be recognized by the COPII sorting machinery. Not all proteins
~ 8 ~
that need to leave the ER contain a signal for the direct binding to Sec24. Some proteins might interact with a transport adaptor and thus be included in the COPII vesicles through an indirect interaction (Baines and Zhang, 2007). Known cargo receptor proteins include ERGIC-53, VIP36 and VIPL. Still other proteins might passively enter COPII vesicles by simple diffusion, a process called bulk-flow (Thor et al., 2009). However, of those cargo proteins tested, several are found in COPII vesicles in concentration higher than a bulk-flow model would suggest, indicating that concentrative sorting by Sec24 might be the rule (Malkus et al., 2002).
Recent experiments have started to shed some light on how the GTP cycle on Sar1 is modulated to permit cargo loading and vesicles release. The continual presence of Sec12 is able to prolong Sar1-GTP loading onto ER membrane providing a sufficient membrane bound pool of Sar1 and Sec23-24 for cargo concentration to occur (Sato and Nakano, 2005; Tabata et al., 2009). A corollary to the question of cargo loading is how the process of ER export manages to accommodate cargoes of widely disparate sizes. Single particle cryo-EM reconstitution of the spherical cage formed by Sec13-Sec31 revealed a basic architecture capable to create structures of increasing dimensions (Stagg et al., 2006). More recent results indicate that there may be a physical link between COPII coat and high molecular size cargo like pro-collagen filaments: the ER membrane protein TANGO1 interacts with both collagen and COPII coat facilitating collagen capture into COPII vesicles without being itself introduced in the vesicle (Saito et al., 2009).
In addition to cargo regulation of COPII assembling, multiple factors have been identified that impact on COPII function. Such proteins include protein kinases such as PCTAIRE (Palmer et al., 2005), p38 MAP kinase (Wang and Lucocq, 2007), adaptors such as STAM (Rismanchi et al., 2009), and potential regulators of lipid biosynthesis including p125 (Shimoi et al., 2005) and Phosphatidylinositol-4-kinase (Blumental-Perry et al., 2006). The calcium binding protein ALG-2 has also been implicated in COPII assembly (Shibata et al., 2007), potentially providing a point of integration of calcium oscillations and ER export activity. The dynactin subunit p150glued interacts with Sec23 (Watson et al., 2005), providing a direct link and integration with the microtubule cytoskeleton. A potential unifying theme is that many of this proteins including p125, p150glued and PICTAIRE, interact with Sec23-Sec24 component of the coat and so regulates Sar1-GTPase activity. Protein phosphorylation is likely to play a key role, having been shown that Sec31 (Salama et al., 1997) and Sec16 are phosphorylated (Farhan et al., 2010).
Definition and structure of ER exit sites
In mammalian cells, secretory proteins, after their translation at rough ER, enter specific sub-domains of the ER which are devoid of ribosomes and show characteristic COPII positive buds. This domains are called transitional ER (tER) (Orci et al., 1991). The term ER Exit Sites (ERES) originates from light microscopy observations of the localization and dynamics of COPII proteins in cells; but ERES encompass more than just the tER itself and include the post-ER structure characterized by free COPII vesicles and tubular elements prior to fusion with or became the ERGIC (Mironov et al., 2003). Over the past years, many evidences suggested the central role of the peripheral membrane protein Sec16 in the organization of ERES. Sec16 is a 240 KDa peripheral membrane protein that cycles on and off the ER membrane and has a direct interaction with Sec23, Sec24, Sec31
~ 9 ~
and Sec13 (Bhattacharyya and Glick, 2007; Hughes et al., 2009; Shaywitz et al., 1997; Whittle and Schwartz, 2010). Sec16 facilitates the recruitment of Sec23-24 and Sec13-31 (Supek et al., 2002) acting as scaffold for the assembling of COPII coats. Considerable evidence points show also that cargo can influence the number and the size of ERES providing a means to regulate the COPII vesicle formation when the secretory requirements of the cell change (Aridor et al., 1999; Farhan et al., 2008; Forster et al., 2006); for example following the stimulation of cell growth by growth factors, the control of ERES number is achieved through the ERK2-mediated phosphorilation of Sec16 (Farhan et al., 2010). From this findings a more precise picture of an ERES is developed: they are tER membranes that are defined by the presence of Sec16 (Hughes et al., 2009), the nascent COPII-coated tubule-vesicular-compartment (Zeuschner et al., 2006) and the first post-COPII membranes which are likely to almost immediately become COPI-coated and therefore ERGIC (Appenzeller-Herzog, 2006) (Fig. 4).
__________________________________________________________(Hughes et al., 2009) Fig. 4 Schematic model of ERES organization
The COPII proteins in human diseases
In recent years examples of developmental disorders and human diseases caused by mutations in Sar1b, Sec23a, Sec23b and Sec24b have begun to shed light on the reason that the multiple paralogs of COPII proteins have been conserved among higher organisms.
Several different mutations in Sar1b have been associated with two related fat malabsorption diseases: chylomicron retention disease and Anderson disease (Jones et al., 2003). Affected individuals show a lack of chylomicrons in their blood because the mutations in SAR1b prevents their normal secretion from the intestinal epithelial cells. Interestingly, chylomicrons range in size from 75 to 450 nm in diameter while vesicles are only 60–70 nm, so it is possible that Sar1b is specialized to enable the transport of chylomicrons and perhaps of other large cargo molecules such as pro-collagen, even if these issues remain unresolved.
A single missense mutation in Sec23a (F382L) has been found to lead to an autosomal recessive disease called cranio-lenticulo-sutural dysplasia (CLSD) (Boyadjiev et al., 2006). The disease is marked by skeletal defects, cataracts and facial dysmorphisms. It was found that the mutation is near the part of Sec23a that
~ 10 ~
binds and recruits Sec31(Bi et al., 2007). Failure to recruit Sec31 leads to a large reduction in the packaging of cargo proteins in vitro, and is accompanied by swelling of the ER with untransported cargo in vivo. Many separate mutations in Sec23b were found in patients with a disease called congenital dyserythropoietic anemia type II (CDAII) (Schwarz et al., 2009).The symptoms of this disease appear to be largely due to defective erythropoiesis; various proteins in the red blood cells show immature glycosylation, indicating transport defects. As with the Sec23a mutation, it seems that the Sec23b mutations only affect a specific tissue. It might be that Sec23a and Sec23b are functionally redundant, and able to largely compensate for one another in unaffected tissues where they are normally both expressed.
Recent reports demonstrate that two distinct premature stop codons in Sec24b lead to major neural tube defects in mice (Merte et al., 2010). Homozygous mutant mice developed craniorachischisis and several other phenotypes indicative of defects within the tissue-organizing planar cell polarity pathway. In this study was revealed that the membrane protein Vangl2 appears to be specifically packaged by Sec24b and that the defective packaging of Vangl2 into COPII vesicles was the cause of the developmental defects. Sec24 is a versatile protein but, in this case, Sec24b appears to have specific binding activity for at least one important cargo protein that cannot be compensated by the presence of other Sec24 paralogs.
~ 11 ~
Antibodies
The following antibodies were used: mouse monoclonal anti-ERGIC-53 antibody, rabbit polyclonal GM130, rabbit polyclonal Sec31, mouse monoclonal calnexin (Marra et al., 2001); goat polyclonal Sec23, mouse monoclonal GAPDH and ʏ tubulin, mouse monoclonal (F-7) and rabbit polyclonal (Y-11) anti-HA probe (Santa Cruz Biotechnology); mouse monoclonal anti-FLAG (M2, Sigma-Aldrich); rabbit polyclonal calreticulin and calnexin, mouse monoclonal anti-KDEL (StressGen); rabbit polyclonal anti-Sec16 (KIAA0310, Bethyl Laboratories); rabbit polyclonal anti-Sar1 (Upstate-Millipore); mouse monoclonal anti-GM130 (BD Transduction Laboratories); mouse monoclonal anti-GFP (Molecular Probes); rabbit polyclonal anti-Grp78/BIP (Cell Signaling Technology); mouse monoclonal anti-ALIX (G-10), goat polyclonal anti-PP2A (SET), rabbit polyclonal anti-calumenin (H-40) and PLOD3 mouse polyclonal antibody (B01P) (Abnova); mouse anti-reticulocalbin 2 (RCN2) (Abcam). FITC-, Texas Red- (Jackson Immuno Research Laboratories), TRITC- and CY5- (GE Healthcare) conjugated antibody were used as secondary antibody for indirect immunofluorescence analysis; HRP-conjugated secondary anti-mouse, anti-rabbit and anti-goat IgG (Sigma-Aldrich) were used for immunoblotting analysis.
Construction of plasmids
Human Sec23A cDNA was obtained by One-Step RT-PCR (Invitrogen) performed on HeLa total RNA with the following primers spanning from nucleotide -26 to +2622 of the mRNA sequence (NM_006364): Sec23A forward: 5’-CGC AGA AAT AAG AAT CAA ACT CC-3’ and Sec23A reverse: 5’-TAG AGC AAT ATC TGT TGG TTT CC -3’. To create the pEGFP-Sec23a expressing plasmid, the full Sec23A coding sequence (1-767 aa) was consequently obtained by PCR amplification (Roche) with KpnI and XbaI flanked oligonucleotides (forward: 5’-GG GGT ACC ATG ACA ACC TAT TTG GAA TTG-3’; reverse: 5’-GC TCT AGA ATT AGC ACT TCA AGC AGC-3’; AUG and stop codon are indicated in bold) and inserted in the KpnI-XbaI sites of the pEGFP-C1 vector (Clontech). To obtain the p3xFlag-Sec23a expressing plasmid the full Sec23a coding sequence was amplified by PCR with HindIII and XbaI flanked primers (forward: 5’-CCC AAG CTT ATG ACA ACC TAT TTG GAA TTC-3’; reverse: 5’-GC TCT AGA ATT AGC ACT TCA AGC AGC-3’) and cloned in the HindIII-XbaI sites of the p3xFlag-CMV-7.1 vector (Sigma-Aldrich). The DNA sequences of the obtained constructs were verified by sequencing. The pEGFP-Sec16 expressing plasmid (Watson et al., 2006) was kindly provided by Dr. David Stephens (University of Bristol, UK). The pHA-Ubiquitin vector was previously described (Mauro et al., 2006).
Cell cultures and drugs treatments
Human hepatoma Huh7 cells, mouse embryonic fibroblast MEF wt and IRE1α knock-out were grown in DMEM 10% FCS supplemented with 4.5 g/l D-glucose, 1 mM Na-pyruvate, 2 mM L-glutamine, at 37°C, in a humidified atmosphere with 5% CO2. When indicated, actively growing cells were incubated either with 1 mg/ml of the NO donor DETA NONOate (2,2-[hydroxynitrosohydrazino bis-ethanamine] (Calbiochem), 300 nM thapsigargin (TG, Sigma-Aldrich), 2 mM dithiothreitol (DTT), 10 µM MG132 (Sigma-Aldrich), 50 µM BAPTA-AM, 2 µM Ionomycin (Calbiochem) or 10 µg/ml Cycloheximide (CHX: Sigma-Aldrich). Brefeldin A (BFA) (Sigma-Aldrich) was used at a final concentration of 5 µg/ml.
~ 12 ~
Immunofluorescence analysis
Huh7 or MEF cells seeded on glass cover slips were washed, fixed 10 min in PBS-4% paraformaldehyde and incubated 30 min in PBS containing 0.5% BSA, 0.005% saponin and 50 mM NH4Cl at room temperature. Cells were then labelled with the appropriate primary antibody and with fluorophore-conjugated secondary antibodies. Cover slips were mounted with the Prolong AntiFade kit (Molecular Probes, Invitrogen). For ERGIC-53 staining, cells were fixed with PBS-3.7% formaldehyde for 30 min at room temperature and made permeable with 0.1% Triton X-100 in PBS. Images were collected as specified using either an Axiophot microscope (Carl Zeiss MicroImaging) equipped with a Photometrics Sensys camera controlled by IP lab spectrum software or a laser scanning confocal microscope (Zeiss LSM 510 or Leica TCS SP5 II) equipped with a plan Apo 63X, NA 1.4 oil immersion objective lens. The quantification of mean fluorescence intensities after VSV ts045G transport assay was performed as previously described (Nichols et al., 2001). In particular, fluorescence intensity was measured in areas of equal size in the ER or in the Golgi complex in a single z-plane through the cell volume (from a range of 1–3 µm starting from the top of the cell) and normalised for the average area of the ER and the Golgi complex measured in the selected regions of interest. The sum of the ER or Golgi apparatus amounts was regarded as total fluorescence. The COPII coats labelled with Sec 31 or the ER-exit sites labelled with Sec 16 were measured by counting the fluorescent spots in two in-focus z-planes by using Image J software. The degree of co-localization of the two fluorescence signals was quantified either by using the LSM 510 or by Image J software. The number of co-localized pixels was normalized for the total of pixels of the fluorophore in the image.
Western Blot analysis
Huh7 cells were lysed in B-Buffer (10 mM Tris-HCl pH 7.4, 150 mM NaCl, 1 mM EDTA pH 8.0), containing 1% Triton, on ice, for 20 min and cleared by centrifugation at 12.000 x g for 15 min to remove debris. In order to validate the differential expression of mass spectrometry-identified proteins, Huh7 cells were lysed in RIPA buffer. Protein concentration of the supernatant was measured according to Bradford method (Bio-Rad). Proteins were separated on 10-12% polyacrylamide gels by SDS-PAGE and then blotted on Protran nitro-cellulose membranes (Schleicher&Schuell Bioscience Gmbh, Dassel, Germany). Filters were blocked with PBS containing 10% non-fat dry milk and 0.1% Tween-20, overnight, and then incubated for 2-12 h with the optimal diluition of the primary antibody. Anti-rabbit or anti-mouse IgG horseradish peroxidase conjugated were used as secondary antibodies; bands were visualised by autoradiography of ECL reaction (Amersham International, Amersham, UK). -tubulin or GAPDH were used to normalise for equal amounts of proteins separated on the gels and to calculate the relative induction ratios. Quantitative analyses were performed on protein samples giving signals in the linear range of the ECL assay. Densitometry of auto-radiographs was performed by the Image J program; values obtained were the mean ± SD of three independent experiments. Statistical analysis was performed using the Student t-test (n=6-9).
Immuno Electron Microscopy analysis
For cryo-sectioning, Huh7 cells were fixed with 2% paraformaldehyde and 0.2% glutaraldehyde in PBS for 2 h at room temperature, washed with PBS containing 20 mM glycine, scraped off the dish, centrifuged and embedded in PBS-12% gelatin.
~ 13 ~
Small blocks of embedded cells were incubated overnight with 2.3 M sucrose at 4°C, mounted on aluminium pins and frozen in liquid nitrogen. 60 nm ultrathin cryo-sections were cut at -120°C, using a cryo-ultramicrotome (Leica-Ultracut EM FCS), and picked up with 1% methylcellulose in 1.15 M sucrose. Cryosections were then incubated with primary antibodies and revealed with protein A gold.
Cell fractionation analysis by discontinuous sucrose gradient
Huh7 cells (7-10 x 107) were homogenised by 10 strokes in a Wheaton glass homogeniser in a buffer containing HEPES/KOH pH 7.3 20 mM, sucrose 120 mM. Post Nuclear Supernatant (PNS) was obtained by centrifugation at 500 x g for 5 min in a micro centrifuge and loaded on the top of a discontinuous sucrose gradient (15, 20, 25, 30, 35, 40, 45, % w/v) made up in the same buffer. The gradient was spun in a SW 50.1 rotor for 1 h at 43000 rpm in a Beckman ultracentrifuge and 13 fractions were collected from the bottom of the tube with a peristaltic pump. Fractions were TCA precipitated and proteins were separated by SDS-PAGE, transferred to ECL membranes and subjected to Western blot analysis. Densitometry of auto-radiographs was performed by the NIH image program and values obtained are representative of three independent experiments.
Cell transfection and analysis of ts045G protein transport
Actively growing Huh7 cells were transfected with 2 µg of the expression vector encoding a GFP variant of the temperature sensitive mutant ts045 of the VSV G protein (ts45G) (Presley et al., 1997) by using Fugene 6.0 according to the manufacturer instruction (Roche). After 4 h cells were incubated 16 h at 39°C to obtain complete retention of the chimeric protein within the ER. Cells were moved to the permissive temperature (32°C) and the protein progression through the secretory pathway has been evaluated at 15 min at 32° by fluorescence analysis. In the ER stress experiments cells were pre-incubated for 5 min with 300 nM TG prior to shift the cells at 32°C.
Trimerization Assay
Actively growing Huh7 cells were transfected with the expression vector encoding the ts045G protein. 4 h after transfection, cells were incubated at 39°C for 16 h and then moved to the permissive temperature of 32°C for 4 min in presence or not of 300 nM TG. After the temperature-shift cells were transferred on ice and incubated for 30 min in ice-cold MNT Buffer at pH 5.8 containing 20 mM MES, 30 mM Tris-HCl, 100 mM NaCl and 1% Triton X-100 (Doms et al., 1987). Lysates were collected by scraping, sheared through a 26-g needle and separated from nuclei by centrifugation. The glucose gradient (40-20%) was made at 4° in MNT buffer containing 0.1% Triton X-100 at pH 5.8 and layered into a centrifuge tube. The lysate was added to an equal volume of 6% part of gradient, loaded on the gradient and ultracentrifuged at 45000 RPM (SW50 rotor, Beckman) for 16 h at 4°C. Fifteen fractions of 300 µl were harvested from the top of the gradient (Meunier et al., 2002). The pellet formed to the bottom of the tubes was solubilised in the gel loading buffer by incubation at 37°C for 1 h with shaking. Proteins in each fraction were TCA-precipitated, separated by SDS-PAGE, transferred to ECL-membranes and revealed with rabbit polyclonal anti-GFP antibody. Densitometry of auto-radiographs was performed by the NIH image program. Values obtained are representative of three independent experiments.
~ 14 ~
Transfection and FRAP analysis
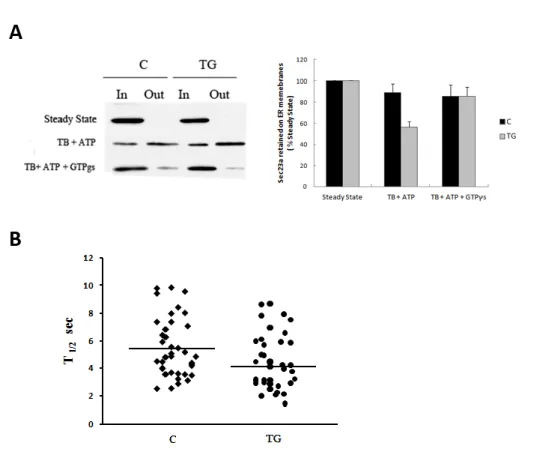
Huh7 cells were grown on live cell dishes (MatTek, Ashland, MA) and transfected with 2 µg of GFP-Sec16 or GFP-Sec23a plasmid by using Fugene 6 (Roche). 24 h after transfection, the cells were imaged as previously described (Hughes et al., 2009) at 37°C with the Zeiss LSM 510 META scanning confocal microscope enclosed in a heated box in DMEM, supplemented with 30 mM HEPES, pH 7.4 and 10% FCS. For quantitative FRAP measurements a 63x 1.4 NA Plan-Apochromat objective was used. The bleaching was performed on individual Sec16 or Sec23 positive spots with five iterations of the 488 laser at 100% AOTF power. Their post-bleaching images were collected for 90 seconds with a scan rate of 1 frame every 1 second and twofold line averaging. Fluorescence recovery in the bleached region during the time series was quantified using Zeiss LSM 510 FRAP Wizard and exported for analysis to Microsoft excel. Recycling kinetics were obtained by curve fitting to a one phase exponential f(t)=A×(1–e–kt) + B, where, A is the mobile fraction, B is the fluorescence directly after photobleaching (%), and k is the rate of fluorescence recovery from which t½ is determined [t½=ln(2)/k].. Statistical significance was determined using standard deviation and the Student's unpaired t-test.
Streptolysin O assay
The Streptolysin O (SLO) toxin was preactivated for 5 min at 37°C in SLO buffer (SB) containing 20 mM Hepes-KOH pH 7.2, 110 mM KOAc, 2 mM Mg(OAc)2, 1mM DTT and SLO at a final concentration of 0,8 U/ml. Huh7 cells were seeded on glass coverslips, washed twice with SB and incubated 10 min on ice with the SB containing active SLO to allow the binding of the toxin to the cell membrane. Cells were washed twice at 4°C with Transport Buffer (TB) containing 25 mM HEPES KOH, 2.5 mM Mg(OAc)2, 110 mM KOAc, 5 mM EGTA, 1.8 mM CaCl2. To complete pore formation cells were incubated for 15 min at 37°C. When indicated, TB was supplemented with an ATP regeneration system containing 100 mM ATP, 500 mM Phosphocreatine, 1000 U/ml Creatine phosphokinase (Sigma-Aldrich) or TB supplemented with the same buffer containing a non-hydrolysable form of GTP (GTPʏs; Sigma-Aldrich). For the immunofluorescence analysis of SLO-treated cells, cells were fixed 10 min in PBS-4% paraformaldehyde, incubated 30 min in PBS containing 0.5% BSA and 50 mM NH4Cl without saponin and then stained for GM130 in order to label only SLO permeabilized cells. After GM130 staining, cells were permeabilized with PBS-Saponin 1% and then stained for the specific primary antibody (Sec 31 or Sec 16). Images were collected as previously described by LSM 510 confocal microscopy. The fluorescence intensity of Sec 31 or Sec 16 was measured in the region of interest of SLO-permeabilized cells; this value was normalized for the fluorescence intensity obtained by the Golgi structural protein GM130 measured in a equal area of the cell. For MEF cells, the SLO assay was performed as for Huh7 cells except that SLO concentration in SB was 0,4 U/ml, the time of incubation on ice with SLO was 6 min and the incubation at 37°C necessary for pore formation was performed for 20 min. In the Western Blotting analysis of SLO-permeabilized cells, the cytosolic fraction of proteins recovered after cell permeabilization in the TBs was subjected to TCA-precipitation; instead the membrane retained fraction of proteins was obtained after lysis of the adherent cells. Then, the cytosolic and membrane fractions (referred as Out and In respectively) were subjected to SDS-PAGE and immunoblotting with the specific antibodies. GAPDH protein was monitored as marker of cytosolic proteins and used to normalize for the rate of SLO-permeabilization. After densitometry of auto-radiographs, the percent of the protein released in the cytosol was calculated as
~ 15 ~
the percent of sum of In and Out mean values and then normalized for the corresponded Out fold of GAPDH release in the cytosol.
3xFlag-Sec23a and HA-Ubiquitin Co-Immunoprecipitation
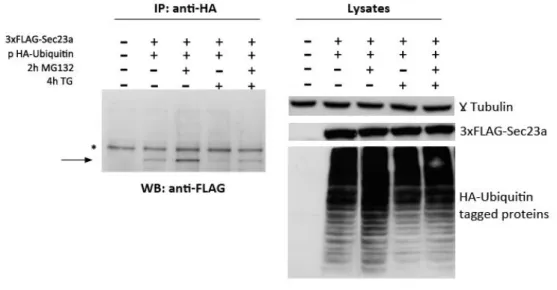
10 cm dish-cultured HuH7 cells were co-transfected with 4 µg of either the p3xFlag-Sec23a or the p3XFlag empty vector plus 4 µg of the pcDNA3/HA-Ubiquitin expression vector. At 48 hours, cells were pre-treated for 2 h with 10 µM MG132 to inhibit proteasomal activity and then either co-stimulated or not with 300 nM TG for the indicated time before to be harvested in B buffer 1% Triton X-100 complemented by protease inhibitor mix (Roche). Equal amounts of cell extracts were immunoprecipitated by the anti-HA mouse antibody and the co-immunoprecipitated 3xFlag-Sec23a revealed after SDS-PAGE by the anti-Flag monoclonal antibody.
Identification of the Sec23a ubiquitination sites
Actively growing Huh7 cells were transfected with 8 µg of 3X-FLAG-Sec23a and 48 h after transfection were lysed in B-Buffer 1% Triton. Lysates were immunoprecipitated by the anti-FLAG resin (Sigma-Aldrich), subjected to SDS-PAGE and revealed by comassie colloidal staining. The gel band strongly enriched by FLAG modified beads was cut out and subjected to in situ protein digestion as described in Shevchenko protocol. Briefly, gel slices were reduced and alkylated using 1,4-dithiothreitol (10 mM) and iodoacetamide (54 mM) respectively, then washed and rehydrated in trypsin solution (10 ng/μl) on ice for 1h. After the addition of 30 μl ammonium bicarbonate (10 mM, pH 7.5), samples were digested overnight at 37 °C. The supernatants were collected and peptides were extracted by the gel slices using 100% CH3CN. Finally, the supernatant was collected and both were combined. All peptides sample were dried out and dissolved in 10% FA before mass spectrometry analysis. 5 μl of the obtained peptide mixture were injected onto a nano Acquity LC system (Waters Corp. Manchester, United Kingdom). The peptides were separated using a 1.7 µm BEH C-18 column (Waters Corp. Manchester, United Kingdom) at a flow rate of 400 nl/min. Peptide elution was achieved with a linear gradient from 15 to 50% (solution A: 95% H2O, 5% CH3CN, 0.1% FA; solution B: 95% ACN, 5% H2O, 0.1% FA) in 55 min. MS and MS/MS data were acquired using a Q-TOF Premier mass spectrometer (Waters Corp., Micromass, Manchester, United Kingdom). Five most intense doubly and triply charged peptide-ions were automatically chosen by the MassLynx software and fragmented. After mass spectrometric measurements, data were automatically processed by ProteinLynx software to generate peak lists for protein identifications. Database searches were carried out with MASCOT server. The SwissProt database (release 2010_11 of 02 Nov 10, 522019 sequences, 184241293 residues) was searched, allowing 2 missed cleavages, carbamidomethyl (C) as fixed modification o and oxidation (M) and phosphorylation (ST) as variable modifications. The peptide tolerance was set to 80 ppm and the MS/MS tolerance to 0.8 Da.
RNA extraction and microRNA Microarray
10 cm dishes of actively growing Huh7 cells were treated 8h with 300 nM TG, then total RNA was extracted from control and TG cells using TRIZOL reagent (invitrogen) according to supplier’s protocol. Three samples of control (A1, A2, A3) and TG-treated (B1, B2, B3) RNA were analyzed by LC Sciences (www.lcsciences.com) for microRNA microarray. The service provided RNA quality control, microRNA
~ 16 ~
enrichment and labelling according to the colour reversal strategy, microRNA detection trough the hybridization to a µParaflo® microfluidics chip and finally data extraction and analysis. The microarray was performed in triplicate on three chips: on the first chip sample A1 is labeled with Cy3 and sample B1 with Cy5, on the second chip sample A2 is labeled with Cy5 and B2 with Cy3, on the third chip A3 is labeled with Cy3 and B3 with Cy5. 640 Human microRNAs were analyzed according to the Sanger miRBase release 11.0. The microarray images were carefully scanned and analysed trough background subtraction, normalization and p-value calculation to produce a list of statistically-differentially expressed transcripts.
Northern Blot analysis
Northern blot analysis was carried out on 25 µg of total RNA. All RNA samples were dissolved in loading buffer (0.05% bromophenol blue, 0.05% cyanol, 5% Ficoll type 400, 80% formamide and 7M Urea), boiled for 5 min at 95°C and fractionated on a denaturing 15% polyacrylamide gel containing 8 M urea for 90 min at 150 V. Then the RNA was transferred onto Nylon membranes (Hybond N+, Amersham/GE Healthcare) by capillary method. The membrane was prehybridized in 0.5% SDS, 5x SSC, 5x Denhardt’s solution, and 20 μg/mL sheared, denatured, salmon sperm DNA at 42°C for 2h. We used miRCURY™ LNA probes (Locked Detection Probes, purchased from Exiqon: www.exiqon.com ) for detection of miR 29-b1* and miR 663. For radiolabeling of the miRCURY™ probes, 10 pmol of probe was combined with one µl of ʏ32
P-ATP and T4 polynucleoitde kinase according to standard protocol. The labelled and denaturated probes were added to membrane in the prehybridization buffer and the hybridization was carried out overnight at 42°C. After hybridization the membranes were washed at low stringency in 2x SSC, 1% SDS at 42°C twice for five minutes and exposed by autoradiography. The signals were quantified by Image-J software analysis.
Bioinformatics prediction of microRNA targets
The search of microRNA targets was performed through the comparative assessment of three targets prediction programs: Miranda (www.microrna.org), TargetScan (www.targetscan.org) and PicTar (www.pictar.org). The three lists of the putative
targets were matched by MatchMiner program
(www.discover.nci.nih.gov/matchminer/index.jsp) to obtain a final list of overlapping putative targets. The ontological analysis of the matched targets was performed by using the Functional Annotation Tool of DAVID (Database for Annotation, Visualization and Integrated Discovery).
2D-DIGE analysis
.
Huh7 cells were lysed in B-Buffer containing 1% Triton as previously described. Samples obtained from lysis of three different preparations of control and TG-treated Huh7 cells were precipitated in acetone/methanol (8:1, v:v), for 16 h, at -20 °C, and recovered by centrifugation at 16,000 x g for 30 min, at 4 °C. Proteins were solubilized in 7 M urea, 2 M thiourea, 4% CHAPS, 30 mM Tris–HCl. Protein concentration was determined using the Bradford method (Bio-Rad Laboratories, Hercules, CA). Before labelling, the pH of the samples was adjusted to a value of 8.5. Each labelling reaction was performed with 50 µg of the protein extracts, in a 10 µl volume, in the presence of 400 pmol of Cy2-, Cy3- or Cy5-dyes (GE Healthcare, Little
~ 17 ~
Chalfont, Buckinghamshire, UK). A dye-swapping strategy was used; thus two Huh7 control lysates were labelled with Cy3, while the third was labelled with Cy5, In a complementary manner, two TG-treated Huh7 lysates were labelled with Cy5, and the third was labelled with Cy3. Three mixtures of the six samples (50 µg each) were labelled with Cy2 dye, as the internal standard required by the 2D-DIGE protocol. The labelling reactions were performed in the dark for 30 min, at 0 °C, and were stopped by addition of 1 mM lysine. Sample mixtures, including appropriate Cy3- and Cy5-labeled pairs and a Cy2-Cy5-labeled control, were generated and supplemented with 1% IPG buffer, pH 3-10 NL (GE Healthcare, Little Chalfont, Buckinghamshire, UK), 1.4% DeStreak reagent (GE Healthcare, Little Chalfont, Buckinghamshire, UK) and 0.2% DTT (w/v) to a final volume of 450 µl in 7 M urea, 2 M thiourea, and 4% CHAPS. The mixtures (150 µg of total protein content) were used for passive hydration of immobilized pH gradient IPG gel strips (24 cm, pH 3-10 NL) for 16 h, at 20 °C, in the dark. Isoelectric focusing (IEF) was carried out with a IPGphor II apparatus (GE Healthcare, Little Chalfont, Buckinghamshire, UK) up to 75,000 V/h, at 20 °C (current limit set to 50 µA per strip). The strips were equilibrated in 6 M urea, 2% SDS, 20% glycerol, and 0.375 M Tris–HCl (pH 8.8), for 15 min, in the dark, in the presence of 0.5% (w:v) DTT, and then in the presence of 4.5% (w:v) iodacetamide in the same buffer, for additional 15 min. Equilibrated IPG strips were transferred onto 12% polyacrilamide gels, within low-fluorescence glass plates (ETTAN-DALT 6 system, GE Healthcare, Little Chalfont, Buckinghamshire, UK). The second-dimension SDS-PAGE was performed using a Peltier-cooled DALT II electrophoresis unit (GE Healthcare, Little Chalfont, Buckinghamshire, UK) at 1.5 W/gel, for 16 h. Gels were scanned with a Typhoon 9400 variable mode imager (GE Healthcare, Little Chalfont, Buckinghamshire, UK) using appropriate excitation/emission wavelengths for Cy2 (488/520 nm), Cy3 (532/580 nm), and Cy5 (633/670 nm). Images were captured in the Image-Quant software (GE Healthcare, Little Chalfont, Buckinghamshire, UK) and analyzed using the DeCyder 6.0 software (GE Healthcare, Little Chalfont, Buckinghamshire, UK). A DeCyder differential in-gel-analysis (DIA) module was used for spot detection and pairwise comparison of each sample (Cy3 and Cy5) to the Cy2 mixed standard present in each gel. The DeCyder biological variation analysis (BVA) module was then used to simultaneously match all of the protein-spot maps from the gels, and to calculate average abundance ratios and statistical parameters across triplicate samples (Student’s t-test).
For preparative protein separations, 600 µg of unlabeled protein samples from control and TG-treated Huh7 cell lysates were used to hydrate passively two 24 cm strips for first dimension pH 3-10 NL IPG strips (GE Healthcare, Little Chalfont, Buckinghamshire, UK). The first and second dimension runs were carried out as previously described for the analytical separations. After 2-DE, gels were fixed and stained with SyproRuby fluorescent staining (Invitrogen, Carlsbad, CA). After spot matching with the master gel from the analytical step in the BVA module of DeCyder software, a pick list was generated for spot picking by a robotic picker (Ettan spot picker, GE Healthcare, Little Chalfont, Buckinghamshire, UK).
For protein identification, picked gel spots were minced and washed with water. Proteins were reduced, S-alkylated, and in-gel digested with trypsin, as previously reported (Caratu et al., 2007). Digest samples were desalted and concentrated on microC18 ZipTips (Millipore Corp., Bedford, MA) using acetonitrile as eluent before MALDI-TOF-MS analysis. Peptide mixtures were loaded on the MALDI target together with α-cyano-4-hydroxycinnamic acid as matrix, by using the dried droplet technique, and analyzed in a Voyager-DE PRO mass spectrometer (Applied
~ 18 ~
Biosystems, Inc., Foster City, CA). Spectra were acquired in reflectron mode; internal mass calibration was performed with peptides derived from trypsin autoproteolysis. The MASCOT software package was used to identify unambiguously spots from the SwissProt human sequence database by peptide mass fingerprint experiments (Perkins et al., 1999).Candidates with MASCOT scores > 62 (corresponding to p<0.05 for a significant identification) were further evaluated by comparison with molecular mass and pI experimental values obtained from 2-DE. The occurrence of protein mixtures was excluded by sequential searches for additional protein components using unmatched peptide masses. Protein identification was confirmed by performing PSD fragment ion spectral analysis of the most abundant mass signal within each MALDI-TOF-MS spectrum.
~ 19 ~
Scientific background, rationale and aims
The exit from ER and the vesicular transport of newly synthesized proteins is indispensable to ensure the physiological level of secretion for hormones, neurotransmitters and proteins of the extracellular matrix. Noteworthy, dysfunctions of the molecular components of the export and transport machinery strongly impairs the proper organization and function of cellular organelles and the maintenance of cell polarity (Boyadjiev et al., 2006; Jones et al., 2003; Merte et al., 2010; Schwarz et al., 2009). Given its central function, it is conceivable that the exit from the ER could be carefully monitored by the quality control system and be one of the target of the UPR (Farhan et al., 2008; Sato et al., 2002; Travers et al., 2000). Indeed, several proteins involved in the vesicular transport between the ER and the Golgi complex are under the UPR control. In previous works, we and others demonstrated that the cargo receptor proteins ERGIC-53, MCFD2 and VIP36 are regulated by UPR (Nyfeler et al., 2003; Renna et al., 2007; Spatuzza et al., 2004).
Given these considerations, we analyzed the molecular mechanisms controlling the export and the transport of secretory proteins from the ER to the cis-Golgi in the contest of ER stress. The experimental system is composed of Huh7 human hepatoma cells, in which the ER stress is induced by thapsigargin (TG), dithiothreitol (DTT), nitric oxide (NO) or MG132.
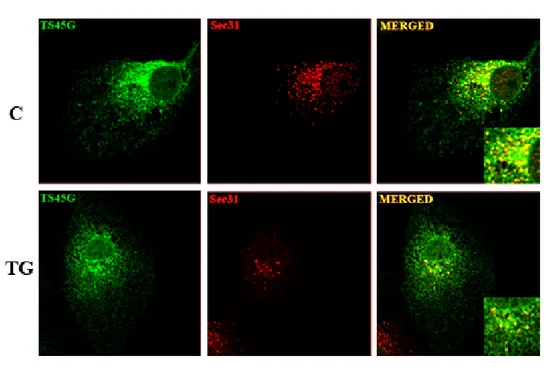
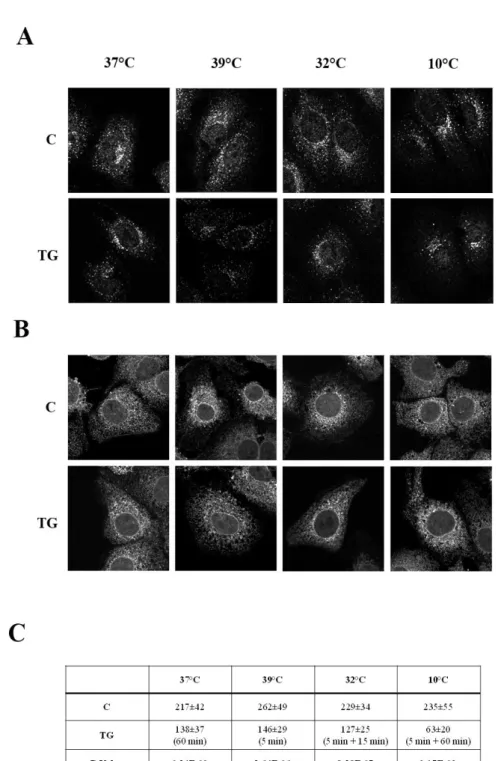
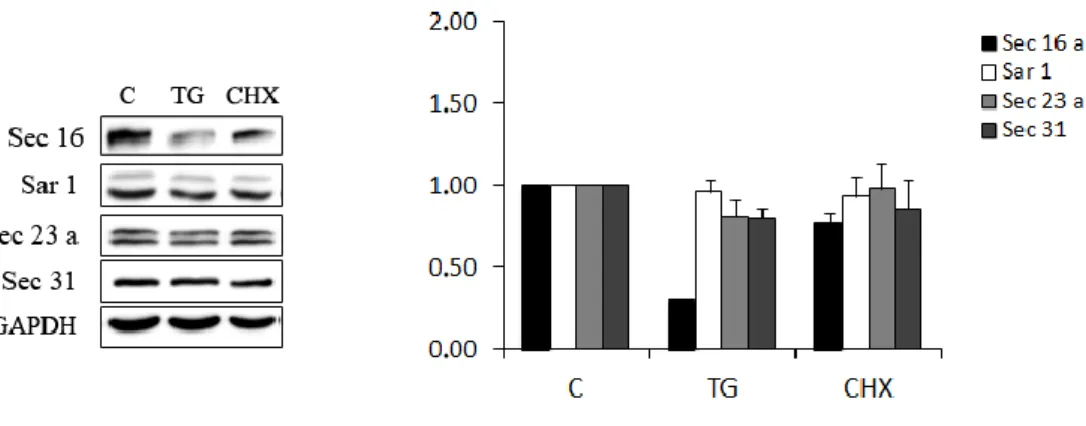
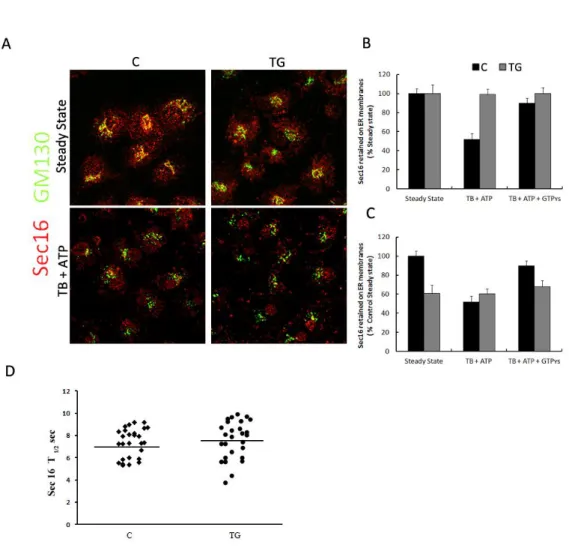
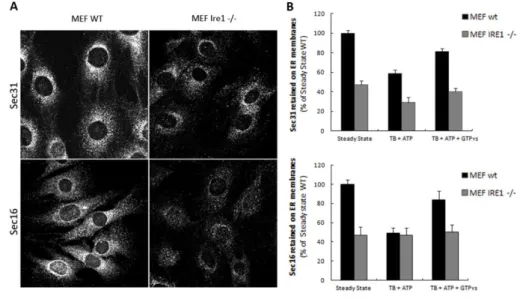
In this contest, we first investigated the effect of ER stress on the morphology and the activity of the secretory pathway at the ER–Golgi boundary. In particular we explored the effect of the ER Stress on the maintenance of the architecture of ERGIC and cis-Golgi by analyzing the distribution of ERGIC-53 and GM130. Moreover, we studied the rate of ER-to-Golgi transport by the use of the temperature sensitive mutant of the G protein of the Vesicular Stomatitis Virus fused to GFP (VSV G ts045). Since the anterograde transport from the ER is mediated by COPII coated vesicles, we analyzed the effect of the ER stress on COPII vesicles assembling at ER Exit Sites. We found that ER Stress rapidly targets the formation of the COPII vesicles. These results prompted us to identify the molecular components of COPII which are sensitive to ER Stress. To this aim, we analyzed the protein expression levels, the distribution and the kinetics of binding to ER membrane of Sec16a, Sec23a and Sec31 that represent respectively the scaffold, the inner and the outer layer of COPII coats. We found that ER Stress changes COPII coats assembling by affecting Sec16 expression and the Sec23a binding to ER Exit Sites.
~ 20 ~
Results
ER stress modifies the subcellular localization of ERGIC-53 and GM130 proteins
To analyze the effect of ER stress on post-ER compartments we examined the effect of thapsigargin (TG) and nitric oxide (NO) exposure on the intracellular localisation of ERGIC-53 and GM130 that are respectively markers of ERGIC (ER Golgi Intermediate Compartment) and cis-Golgi. The cargo receptor ERGIC-53 recycles between the ERGIC and the ER to export from the ER a group of N-glycoproteins (Anelli et al., 2007; Appenzeller et al., 1999; Nyfeler et al., 2008). GM130 is a member of the family of coiled-coil golgins, (Linstedt and Hauri, 1993) and continuously cycles between the ERGIC and the cis-Golgi compartments (Barr et al., 1998). Confocal microscopy showed that in the control cells (Fig. 1: C panels) endogenous ERGIC-53 protein was visible in spots dispersed throughout the cytoplasm and concentrated in the perinuclear region of the cell. In non-stressed cells, a portion of ERGIC-53 colocalizes with the cis-Golgi protein GM130 in the perinuclear area (Fig. 1: C panels, merged picture and insert). In response to the ER stress induced by either 300 nM TG or 1 mg/ml of the NO donor DETA NONOate for 2 h, both proteins were present in spots more dispersed throughout the cytoplasm (Fig. 1: TG and NO panels) indicating that the subcellular organisation of the ERGIC and cis-Golgi underwent significant changes during the ER stress response. In addition, endogenous ERGIC-53 and GM130 segregated in different membrane structures upon stress induced either by TG or NO (Fig. 1: NO and TG panels, merged pictures and inserts). These observations were confirmed by immunoelectron microscopical analysis, (Fig. 2) which revealed that in the ER stressed cells ERGIC-53 and GM130 proteins located in distinct vesicles. Furthermore, in all the sections prepared from ER stressed cells, the Golgi stacks were no longer visible indicating that, similarly to the ERGIC, the ultrastructural organisation of the Golgi complex was severely compromised by either the TG or the NO treatment (Figure 2: B and C panels, respectively).
ERGIC-53 and GM130 localise in lighter density vesicles upon ER stress
To further describe the effect of ER stress on post ER structures of the secretory pathway we analysed by sucrose gradient the sedimentation profile of ERGIC-53 and GM130. To this end, the postnuclear supernatant fraction of uninduced or ER stress induced cells was loaded on a sucrose discontinuous gradient (Spatuzza et al., 2004). In the thirteen fractions obtained, ERGIC-53 and GM130 were revealed by Western Blotting (WB). WB analysis showed that in normal conditions ERGIC-53 was enriched in fractions 5-7 and GM130 in fractions 3-7 (Fig. 3). 2 h incubation with 300 nM TG or 1 mg/ml of the NO donor DETA NONOate changed the distribution of ERGIC-53 to fractions 5-10 and of GM130 to 3-13 (Fig. 3) suggesting that ER stress induced the shift of both proteins to lighter density vesicles. We also analyzed the sedimentation profile of calreticulin and found that its distribution was clearly not influenced by ER stress (Fig. 3) indicating that the distribution within the ER of calreticulin was not affected by ER stress. Since ERGIC-53 and GM130 are both mobile proteins, these results could suggest that ER stress alters the dynamic of their recycling in the retrograde and/or anterograde direction and/or the structure of ERGIC and cis-Golgi derived vesicles.
~ 21 ~
________________________________________________________________________ Fig. 1 Effect of ER stress on the distribution of protein markers of the early secretory
pathway. Huh7 cells seeded on glass coverslips were either left untreated (C) or subjected to ER stress for 2 h with 300 nM thapsigargin (TG) or 1 mg/ml detanonoate (NO) fixed and processed for immunofluorescence analysis with the anti-ERGIC-53 and GM130 antibodies. Confocal analysis was then performed as detailed in the materials and methods section.
~ 22 ~
___________________________________________________________________________ Fig. 2 Ultrastructural analysis of the effect of the ER stress induced by thapsigargin
(TG) and detanonoate (NO) on the ERGIC and the Golgi complex. Golgi and peri-Golgi areas of control (A) or 2 h TG- (B) or nitric oxide-treated (C) Huh7 cells display immuno-staining for anti-ERGIC-53 (10 nm) and anti-GM130 antibody (15 nm). The two antigens do not co-localize in the same vesicles. Insets display enlarged views of the Golgi complex included in the boxed areas. The morphology of the Golgi complex is modified in response to ER stress and appears fragmented (e.g., compare A vs. B and C). Bar: A = 321 nm; A inset = 284 nm; B = 367 nm; B inset = 249 nm; C = 367 nm; C inset = 194 nm
___________________________________________________________________________ Fig. 3 Cell fractionation analysis of the intracellular distribution of ERGIC-53, GM130
and CLR in response to ER stress. (A-C) Control or ER stress-induced Huh7 cells were homogenised by a Wheaton cell cracker and the post nuclear supernatant fraction loaded on the top of a discontinuous sucrose gradient (Erra et al., 1999; Spatuzza et al., 2004). After ultracentrifugation, 13 fractions were collected, TCA-precipitated and analysed by immunoblotting with the indicated antibodies. The graphs on the right side of the panels report the relative distribution of the proteins along the gradient. Values obtained are representative of three independent experiments.
~ 23 ~
ER stress impairs the reconstitution of ERGIC and cis-Golgi after Brefeldin A (BFA) treatment
To test whether ER stress could interfere with the formation of the ERGIC and of the cis-Golgi complex we performed BFA wash-out experiments. BFA treatment induces breakdown of the Golgi complex, redistribution of Golgi proteins into the ER and accumulation within the ER of newly synthesized proteins (Klausner et al., 1992). As expected, either ERGIC-53 or GM130 relocalised to peripheral structures (Figure 4, 1 h BFA), known as the ERGIC remnants, which are close to the ERES (Ward et al., 2001). Upon removal of BFA, both ERGIC-53 and GM130 progressively gained their ERGIC and cis-Golgi pattern respectively, reaching the optimal recovery at 60 min (Figure 4: wash out, upper panel). Interestingly, when BFA wash out was performed in the presence of 300 nM TG for the times indicated, ERGIC-53 and GM130 were unable to recover the original intracellular pattern (Figure 4: wash out, lower panel). This result indicates that ER stress interferes with the reconstitution after BFA of both ERGIC and Golgi complex. This suggests that the vesicular transport from the ER to the Golgi complex might be altered by ER stress preventing the proper delivery of proteins required for the maintenance of the architecture of post-ER compartment or for the process of membranes homotypic fusion.
___________________________________________________________________________ Fig. 4 Time course analysis of ERGIC-53 and GM130 localisation during BFA
wash-out. (A) Huh7 seeded on glass coverslips were untreated (C) or treated for 1 h with 5 µg/ml of Brefeldin A (BFA). (B) Following BFA treatment, the cells were washed-out and incubated in the presence (TG) or in the absence (C) of 300 nM TG for the times indicated, and then processed for the immunofluorescence analysis with anti-ERGIC-53 or anti-GM130 antibodies.
~ 24 ~
ER stress rapidly delays the anterograde transport of the VSV G ts045G reporter glycoprotein
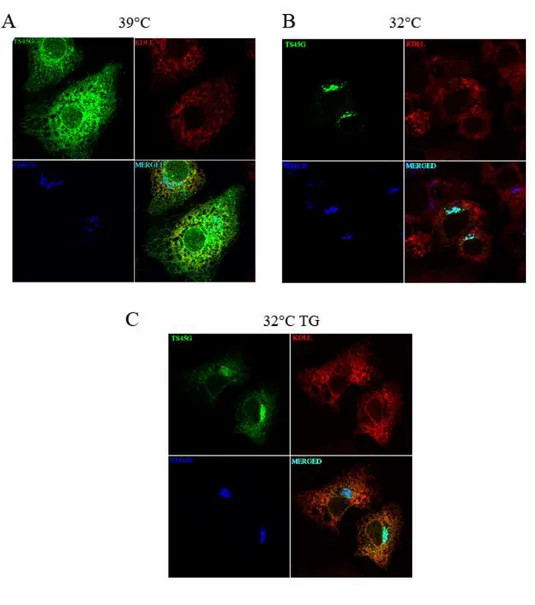
To test whether ER stress could interfere with the rate of the ER to Golgi transport, we analyzed the effect of ER stress on the rate of cargo glycoproteins transport from the ER to the Golgi complex, using the ts045 conditional mutant of the VSV G protein fused to the reporter protein GFP (ts045G) as reporter for transmembrane-type proteins. This viral secretory protein is unable to correctly fold when expressed at not permissive temperature (39°C) and is therefore trapped in the ER by quality control system. Upon shifting the temperature to 32°C, the protein rapidly folds and moves toward Golgi compartment until the reaching of plasma membrane (Presley et al., 1997). The ts045G protein was used in transient transfections to compare the rate of transport to the Golgi apparatus in normal and ER stressed cells (Fig. 5). The cells transfected with the fusion protein were maintained at 39°C for 16 h to induce ts045G unfolding and retention within the ER (Fig. 5A; ts045G green panel). Upon shifting to 32°C, ts045G rapidly moved forward the secretory pathway to reach the Golgi complex within 10 min (Fig. 5B, green panel). Fluorescence quantification showed that 67,412,5% of total ts045G reached the Golgi area while the remaining 32,612,5% was retained within the ER (Fig. 5B and 6). Instead, when the shift to 32°C was performed in the presence of 300 nM TG for 15 min the amount of ts045G protein in the Golgi area drastically declined (36,44,2%, Fig. 5C and Fig. 6), indicating that the induction of ER stress rapidly reduces the transport of the reporter protein from the ER to the Golgi complex. In all the experimental conditions either the membrane network of the ER, revealed by an anti-KDEL antibody, which stains ER resident proteins bearing KDEL retention signal (i.e. GRP78/BiP) (Fig. 5A; KDEL panel), or the cis-Golgi, stained by the anti-GM130 antibody (Fig. 5A; GM130 blue panel), appeared unmodified, suggesting that the ER stress did not alter the ER and the Golgi complex organization. One of the possible hypothesis for the impairment of the ER to Golgi transport could be the reduction of the amount of protein competent for the export from ER. It’s known in literature that trimerization is a prerequisite for the ER to Golgi transport of the ts045 variant of the VSV G protein (Doms et al., 1987), so to understand whether the reduced transport to the Golgi complex was due to a defective oligomerization of the reporter protein induced by the ER stress, we performed velocity gradient analyses to evaluate the rate of oligomerization of the ts045G protein (Fig. 7) (Meunier et al., 2002). Results showed no significant decrease in the amount of total ts045G reporter recovered from the cell extracts obtained from the uninduced and the induced cells, indicating that in our experimental condition there was no decrease of the reporter protein due to induced ER stress dependant degradation. More interestingly, the velocity gradient analysis showed that the cells shifted for 4 min to the permissive temperature (32°C) showed the same rate of conversion to the trimeric form of the reporter ts045G protein either in the presence or in the absence of 300 nM TG. This finding indicated that incubation with TG did not alter the oligomerization of the reporter protein, thus suggesting that the reduced rate of transport was not due to a rapid decrease of the amount of the cargo protein competent for the export step.
~ 25 ~
___________________________________________________________________________
Fig. 5 Effect of ER stress on the anterograde transport of VSV ts045G glycoprotein. (A) Huh7 seeded on glass coverslips were transiently transfected with the ts045G expression vector and kept at the non permissive temperature (39°C) from 12 to 24 h post-transfection. (B) and (C) Cells transfected as in (A) were shifted at the permissive temperature (32°C) for 10 min in the absence (B) or in the presence (C) of 300 nM TG and then fixed, stained with the anti-KDEL (anti-KDEL), the anti-GM130 (GM130) and the anti-GFP (ts45G)
antibodies and subjected to confocal immunofluorescence analysis. TG was added at 39°C 5 min before the shift to 32°C only to the cells shown in C.
~ 26 ~
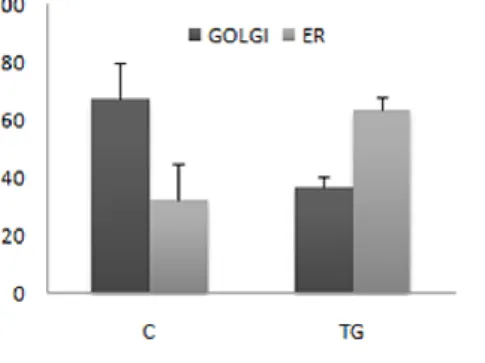
___________________________________________________________________________ Fig. 6 Quantitative analysis of the effect of ER stress on the ER-to-Golgi transport of
VSV-G ts045G glycoprotein. Diagrams represent the quantification of the mean intensity of the ts045G fluorescence in the Golgi or in the ER area obtained by using a laser scanning microscope (LSM 510; Carl Zeiss MicroImaging, Inc.). Fluorescence intensities were measured on selected regions corresponding to the ER or to the Golgi complex area of untreated (C) or TG treated cells in a single z-plane through the cell volume (from a range of 1–3 µm starting from the top of the cell). 100% was considered the sum of ER plus Golgi area fluorescence. Results represent the mean of three experiments performed in triplicate.
___________________________________________________________________________
Fig. 7 Velocity gradient centrifugation to determine the trimerization rate of the
ts045G protein. Protein extracts were prepared from Huh7 cells transiently transfected with the ts045G expression vector. Lysates were ran through 20-40% glycerol gradients. Fractions of 300 µl were collected from the top (fraction 1) to the bottom (fraction 14) of the gradients. Proteins were precipitated with TCA and detected by western blotting using anti-GFP antibody. The position of the molecular mass markers is indicated.