Suggested citation: EFSA Panel on Plant Health (PLH); Scientific opinion on a quantitative pathway analysis of the likelihood of Tilletia indica M. introduction into EU with importation of US wheat. EFSA Journal 2010; 8(6):1621. [88 pp.]. doi:10.2903/j.efsa.2010.1621. Available online: www.efsa.europa.eu
SCIENTIFIC OPINION
Scientific opinion on a quantitative pathway analysis of the likelihood of
Tilletia indica M. introduction into EU with importation of US wheat
1 EFSA Panel on Plant Health (PLH)2, 3European Food Safety Authority (EFSA), Parma, Italy
ABSTRACT
The European Commission requested EFSA to provide a scientific opinion on the USDA APHIS quantitative pathway analysis on likelihood of Karnal bunt introduction with importation of US wheat for grain into EU and desert durum wheat for grain into Italy. EFSA was also requested to indicate whether the US bunted kernel standard would provide equivalent protection against introduction of Tilletia indica into EU, compared to the existing EU import requirement. The Panel on Plant Health reviewed pathway scenarios, model and parameters and found several shortcomings regarding model equations and parameter values, particularly a lack of scientific evidence for the infection threshold. Simulations were computed, for importations of US wheat into EU and desert durum wheat into Italy, based on original model and an updated model with revised parameter values. Model output was teliospores number per hectare on soil surface of each EU country. Simulated teliospores numbers entering EU were lower with the updated than with the original model. These results showed a high uncertainty, underestimated with the original model, over the number of teliospores entering each EU country. Sensitivity analysis showed several key parameters (proportion of bunted kernels in Arizona regulated counties, number of Arizona positive hectares and number of teliospores per bunted kernel) strongly influencing number of teliospores entering the EU. In addition, high sensitivity indices were obtained with the updated wheat model for several parameters related to EU country characteristics. Further research is needed to refine parameter values, to reduce uncertainty and to determine relationship between teliospores number on soil surface and number of bunted kernels resulting from infection of a wheat plant. The Panel concluded that the US bunted kernel standard does not provide a level of protection equivalent to EU requirements and that such level of protection could only be warranted by measures which include testing at harvest and before shipment to detect T. indica teliospores.
KEY WORDS
Wheat, durum wheat, desert durum, grain, import, mill, pathway, Karnal bunt, Tilletia indica, teliospores, model, stochastic, probabilistic.
1 On request from the European Commission, Question No EFSA-Q-2009-00760, adopted on 11 May 2010.
2 Panel members: Richard Baker, Thierry Candresse, Erzsébet Dormannsné Simon, Gianni Gilioli, Jean-Claude Grégoire, Michael John Jeger, Olia Evtimova Karadjova, Gábor Lövei, David Makowski, Charles Manceau, Maria Navajas, Angelo Porta Puglia, Trond Rafoss, Vittorio Rossi, Jan Schans, Gritta Schrader, Gregor Urek, Johan Coert van Lenteren, Irene Vloutoglou, Stephan Winter and Marina Zlotina. One member of the Panel did not participate in the discussion on the subject referred to above because of potential conflicts of interest identified in accordance with the EFSA policy on declarations of interests. Correspondence: [email protected]
3 Acknowledgement: The Panel wishes to thank: the members of the Working Group on Tilletia indica for the preparatory work for this opinion: Michael John Jeger, Gábor Lövei, David Makowski, Angelo Porta Puglia, Trond Rafoss and Irene Vloutoglou; the hearing expert Guillermo Fuentes Dávila for the presentations on biological and epidemiological aspects of Karnal bunt; the hearing experts Filippo Bertuzzi, Luigi Pianu and Roberto Ranieri for the presentation on the wheat pathway and the Italian durum wheat milling industry; and EFSA’s staff members Olaf Mosbach-Schulz, Giuseppe Stancanelli and Tilemachos Goumperis for the support provided to this EFSA scientific output.
SUMMARY
Following a request from the European Commission, the Panel on Plant Health was asked to deliver a scientific opinion on a quantitative pathway analysis titled "Likelihood of Karnal bunt, (Tilletia indica M.), introduction as a result of the importation of United States (US) wheat for grain into the European Union and desert durum wheat for grain into Italy", made by the Animal and Plant Health Inspection Service of the United States Department of Agriculture (USDA APHIS). The analysis claimed that T. indica has an extremely low introduction potential in the European Union (EU) via the grain for consumption pathway.
The Panel was also requested to indicate whether or not the US bunted kernel standard, as used in the USDA APHIS quantitative pathway analysis, would provide an equivalent protection against the introduction of T. indica into the EU, compared to the existing EU import requirement. The US bunted kernel standard corresponds to the procedure described in the USDA APHIS Karnal bunt manual. The existing EU import requirements are listed in Annex I (A) (I) and in Annex IV, Part A, Section I of the Council Directive 2000/29/EC.
With regard to the scientific opinion on the USDA APHIS quantitative pathway analysis, the Panel followed a tiered approach, reviewing the pathway scenarios, the model and the parameters. Results of simulations and sensitivity analysis were also analysed by the Panel for both the importation of US wheat for grain into the EU and desert durum wheat for grain into Italy. The Panel found several shortcomings with respect to the model equations and parameter values:
• the entry of T. indica in Europe was considered by USDA APHIS to be uniform within a country. A mean value of teliospores on the soil surface was computed per hectare of wheat production. No consideration was given to literature on spatial aggregation of teliospores, in which some areas show values much higher and other areas much lower than the mean.
• the pathway analysis took into account overwintering survival of teliospores, which might add to the pool of teliospores the next season, but did not take into account teliospores produced in situ through the infection process and which might subsequently be air-dispersed.
• the pathway analysis did not consider the possibility that a single infected consignment could reach a specific location in Europe.
• the pathway analysis assumed that 150000 teliospores on the soil surface per hectare were required for introduction. This was based on a supposed inoculum threshold of 15 teliospores/m2 for 1 bunted kernel/m2 which was then scaled up by the factor 105 to give a threshold per hectare.
• there is no evidence for the existence of an infection threshold. The value given was based on a misunderstanding of a theoretical paper. There are no experimental data which support the existence of an infection threshold. One teliospore on germination can produce more than a hundred primary sporidia, which in turn produce secondary sporidia which infect the plant. Both mating types are produced from a single teliospore and hence new teliospores can be formed resulting in bunted kernels.
• several parameters of the model were inaccurately estimated. The Panel analyzed two series of simulations:
i) simulations computed with the original USDA APHIS model for both the importation of US wheat for grain into the EU and the importation of desert durum wheat for grain into Italy,
ii) simulations computed with an updated version of the model based on the same equations but with parameter values modified according to the available literature and data.
These simulations were run for both the importation of US wheat for grain into the EU and the importation of desert durum wheat for grain into Italy. Both models were used to compute the number of teliospores per hectare on the soil surface of each country of the EU. In both models, it was assumed that the US bunted kernel standard was implemented to detect the presence of the disease in wheat grains produced in regulated counties. Simulated numbers of teliospores entering into the EU were lower with the updated version of the model than with the original version. However, both models showed that teliospores from T. indica could enter into EU and, consequently, that the US bunted kernel standard cannot be used alone to certify that grains exported from regulated counties are free from T. indica. These results showed that there is high uncertainty about the exact number of teliospores entering in each EU country and about the possibility of infection of European wheat from these teliospores due to lack of knowledge about key parameters and between year variability of wheat production and positive hectares in regulated counties. The uncertainty was underestimated with the original model.
The sensitivity analysis carried out by the Panel showed that several key parameters strongly influence the simulated number of teliospores entering into the EU. With all the four tested models, the most influential parameter was the proportion of kernels that are bunted in regulated counties of Arizona. The number of positive hectares in Arizona and the number of teliospores per bunted kernel were also systematically found among the parameters with the highest sensitivity indices. In addition to these three parameters, high sensitivity indices were obtained with the wheat for grain updated model for several parameters related to EU member state characteristics (probabilities of spilled teliospores being dispersed to wheat production areas, probability of teliospores released during milling being dispersed to wheat production areas, probability that wheat exported to EU member states is in a class grown in the US regulated areas, probability of manure being dispersed to wheat production area). Further research is needed to refine these parameter values and reduce the uncertainty about the simulated number of teliospores entering the EU. Further research is also needed to determine the relationship between teliospores number on the soil surface and the number of bunted kernels that result from infection of a wheat plant.
The USDA APHIS claimed that the probabilistic quantitative pathway analysis indicates that “the US bunted kernel standard adequately prevents the export of epidemiological significant levels of T. indica in US grain”. The Panel concluded that this claim could not be substantiated for the following reasons:
• epidemiological significance can only be judged in terms of the introduction potential of the organism into the EU territories.
• the quantitative pathway analysis (the original model and the updated versions considered in this opinion) predicted that teliospores enter the EU territories via the grain for consumption pathway. • the numbers of teliospores on the soil surface could be converted to bunted kernels per hectare (using the USDA APHIS threshold assumption) but the numbers obtained would be very small in relation to the number of kernels produced per hectare of wheat. This would place major sampling constraints on observing the disease in the field.
• introduction depends on entry and establishment. The quantitative pathway analysis predicted that entry would occur but cannot be used to predict whether the organism will establish.
Therefore whether introduction is epidemiologically non-significant or is not could not be judged from the quantitative pathway analysis alone. More sophisticated epidemiological data collection and analysis would be required to make this judgement.
With regard to whether or not the US bunted kernel standard would provide an equivalent protection against the introduction of T. indica into the EU, compared to the existing EU import requirement, the Panel concluded that the US bunted kernel standard does not provide an equivalent level of protection to the EU requirements for the following reasons:
• the EU requires absence of the organism on grain, while the US bunted kernel standard tests for disease symptoms on grain (i.e. for bunted kernels). In the US bunted kernel standard, the presence of teliospores is tested only on the suspect bunted kernels in order to confirm the identification of the pathogen.
• the results of the simulations showed that, by applying the US bunted kernel standard, teliospores may enter the EU with grain imports.
• the US bunted kernel standard can detect diseased grain (bunted kernels) but not healthy grain carrying on its surface teliospores of the organism as contaminants.
• the US bunted kernel standard includes only one time of sampling and testing, at harvest, whereas the current EU requirements require one additional sampling and testing to be made before shipment.
Therefore, the Panel concluded that a level of protection comparable to the present EU requirement could only be warranted by measures which include testing at harvest and before shipment to detect teliospores both infecting and contaminating grain imported into the EU.
TABLE OF CONTENTS
Abstract ... 1
Summary ... 2
Table of contents ... 5
Background as provided by the European Commission ... 6
Terms of reference as provided by the European Commission ... 7
Assessment ... 8
1. Introduction ... 8
1.1. Karnal bunt: history and distribution ... 8
1.2. Karnal bunt epidemiology ... 8
1.3. Wheat production in the US states where Karnal bunt has been detected ... 9
1.4. European Union wheat grain production, import and milling ... 10
1.5. Structure of the opinion ... 10
2. Review of the USDA APHIS quantitative pathway analysis ... 10
2.1. Methods for evaluation of the USDA APHIS document ... 11
2.2. Results of the evaluation of the USDA APHIS document ... 14
2.2.1. Scenario considered by the USDA APHIS quantitative pathway analysis ... 14
2.2.2. Model assumptions, dependency (interaction of input parameters) and structure ... 16
2.2.3. Parameters of the USDA APHIS wheat model ... 27
2.2.4. Parameters of the USDA APHIS desert durum wheat model ... 35
2.2.5. Model outputs obtained with the USDA APHIS model ... 36
2.2.6. Definition of parameters values and distributions for updated wheat and desert durum model 41 2.2.7. Outputs of the updated USDA APHIS wheat and desert durum wheat grain models ... 55
2.3. Conclusions on the USDA APHIS quantitative pathway analysis ... 62
2.3.1. Model structure and parameter values ... 62
2.3.2. Model outputs ... 62
2.3.3. USDA APHIS quantitative pathway analysis conclusion ... 63
3. Level of protection provided by the US bunted kernel standard and the EU requirements ... 64
3.1. Introduction ... 64
3.2. Diagnosis of Karnal bunt ... 64
3.3. Detection of T. indica teliospores ... 65
3.4. Description of the EU requirements and the US bunted kernel standard... 66
3.5. Conclusion on the level of protection provided by the US bunted kernel standard and by the existing EU requirements ... 69
4. Conclusions ... 71
Documentation provided to EFSA ... 73
References ... 73
Appendices ... 81
A. EU wheat production and import from eurostat databases ... 81
BACKGROUND AS PROVIDED BY THE EUROPEAN COMMISSION4
The current Community plant health regime is established by Council Directive 2000/29/EC on protective measures against the introduction into the Community of organisms harmful to plants or plant products and against their spread within the Community (OJ L 169, 10.7.2000, p.1).
The Directive lays down, amongst others, the technical phytosanitary provisions to be met by plants and plant products and the control checks to be carried out at the place of origin on plants and plant products destined for the Community or to be moved within the Community, the list of harmful organisms whose introduction into or spread within the EU is prohibited and the control measures to be carried out at the outer border of the Community on arrival of plants and plant products.
In addition, the Directive provides that derogations may be granted with regard to requirements referred to in Annex IV, Part A, Section I. In such cases, the derogation has to set out specific alternative requirements to prohibit the introduction and spread of harmful organisms. The phytosanitary risk must be assessed on the basis of available scientific and technical information; where this is not possible it shall be supplemented by additional enquiries or investigations.
Tilletia indica Mitra is listed in the Annex I (A) (I) of Council Directive 2000/29/EC as a harmful organism of which introduction into or spread within the EU is prohibited. In addition, according to point 54 of Annex IV, Part A, Section I of the Council Directive 2000/29/EC, grain of the genera Triticum, Secale and × Triticosecale originating in the USA, must be accompanied by a phytosanitary certificate indicating that certain special requirements regarding the freedom from T. indica are fulfilled.
These requirements provide that the grain should originate either from a pest free area (PFA) where the organism is known not to occur or, if this is not feasible, from a place of production which is free from T. indica. The same requirement provides that the place of production freedom should be demonstrated by the absence of symptoms on plants during their last complete cycle of vegetation and the confirmed absence of the organism in the grain after appropriate sampling and testing at both time of harvest and before shipment. The compliance to one of these requirements i.e. origin from a PFA or the place of production freedom should be stated to the phytosanitary certificate accompanying the consignment.
Failing to confirm the complete absence of T. indica in certain areas of the US and pleading substantial and technical difficulties for the fulfilment of the freedom at harvest and prior to shipment requirement, the USDA developed a bunted kernel standard which supports that the absence of bunted kernel visual symptoms during the complete cycle of vegetation, could alone justify an epidemiologically non-significant, hence phytosanitary acceptable introduction potential of the organism.
For this reason the USDA submitted in 2009 a Quantitative Pathway Analysis with title "Likelihood of Karnal Bunt (Tilletia indica M.), introduction as a result of the importation of US wheat for grain into the EU and desert durum wheat for grain into Italy", supporting that T. indica has extremely low introduction potential in the EU via the grain for consumption pathway. The request is supported by a probabilistic model indicating that the US bunted kernel standard adequately prevents the export of epidemiologically significant levels of T. indica in US grain.
The Committee discussed the information provided and concluded that the technical justification included, moves to the opposite direction to the conclusions of an EU pest risk analysis (PRA) which was produced in 2006 (http://karnalpublic.pestrisk.net/). The PRA showed that the pathogen has the potential to enter into the EU if no appropriate preventive measures are implemented. In addition, the
4
same PRA indicated that there is a considerable risk of Karnal Bunt establishment, which could have a serious impact for the wheat producing areas of the Community.
A scientific evaluation of the U.S. Quantitative Pathway Analysis is therefore needed.
TERMS OF REFERENCE AS PROVIDED BY THE EUROPEAN COMMISSION
EFSA is requested, pursuant to Article 29(1) and Article 22(5) of Regulation (EC) No 178/2002, to provide a scientific opinion on the Quantitative Pathway Analysis titled "Likelihood of Karnal Bunt, (T. indica M.), introduction as a result of the importation of US wheat for grain into the EU and desert durum wheat for grain into Italy", supporting that T. indica has extremely low introduction potential in the EU via the grain for consumption pathway.
EFSA is also requested to indicate whether or not the US bunted kernel standard would provide an equivalent protection against the introduction of T. indica into the EU, compared to the existing EU import requirement described above.
ASSESSMENT
1. Introduction
1.1. Karnal bunt: history and distribution
T. indica was first found in 1930 at Karnal, Haryana, in northern India (Mitra, 1931). It occurs in the northern part of India in the states of Delhi, Himalchel Pradesh, Madhya Pradesh, Jammu and Kashmir, West Bengal, Gujarat, Uttar Pradesh, Punjab, Rajasthan and Haryana. The pathogen has also been recorded in other Asian countries, including Pakistan, Afghanistan, Iraq, Nepal (Warham, 1986) and Iran (Torabi et al., 1996). T. indica was not identified outside Asia until 1972, when it was reported from the state of Sonora in northern Mexico (Durán, 1972; Sansford, 1998). At that time, the disease was restricted to the Yaqui and Mayo valleys in Sonora and was found in only trace amounts in farmers’ fields (Rush et al., 2005). However, in the early 1980s, disease surveys in these valleys found Karnal bunt on 64 % of the farms (Rush et al., 2005). Karnal bunt was found in a seed sample in Arizona in early 1996 (Ykema et al. 1996), and subsequently bunted grains were detected in Arizona, California, New Mexico and Texas. As a result, the United States Department of Agriculture, Animal and Plant Health Inspection Service (hereinafter referred to as USDA APHIS), began surveying wheat producing areas in 1996 to determine the extent of Karnal bunt in the United States5 (Ykema et al.,1996; Rush et al., 2005). Until now Karnal bunt disease of wheat has been detected in the US in counties of Arizona, California and Texas (Rush et al., 2005; USDA APHIS, 2008). T. indica was first reported from Brazil in 1993 in the southern part of the Rio Grande do Sul and efforts were made to eradicate it (Da Luz et al., 1993). However, no further information on its current status in Brazil has been found (Sansford et al., 2007). The first report of T. indica in South Africa was made in 2000 in the northern Cape Province (Crous et al., 2001) where it is thought to have been subject to eradication. However, since then it was found to have spread to a number of new areas in this country (Naudé, 2002).
1.2. Karnal bunt epidemiology
T. indica survives in the form of teliospores produced within sori on kernels by a teliosporogenous mycelium. Teliospores of T. indica are very resistant to adverse environmental conditions and have been reported to persist in soil for several years (Smiley, 1997; Chib et al., 1990; Krishna and Singh, 1983; Rattan and Aujla, 1990). Experimental results from the EC Fifth Framework Project QLK5-1999-01554: “Risks associated with Tilletia indica, the newly-listed EU quarantine pathogen, the cause of Karnal bunt of wheat” have shown that teliospores may survive for at least 3 years in soils in three locations in the European Union6 (United Kingdom, Italy and Norway) at 5, 10 and 20 cm depths. Germinating teliospores produce promycelia (Mitra, 1931, Krishna and Singh, 1983, Warham, 1986) bearing primary sporidia in large numbers, with some variation according to the authors: 32-128 (Mitra, 1931), 26-171 (Holton, 1949), 50-140 or more (Durán, 1972). Primary sporidia germinate to produce hyphae or sterigmata on which secondary sporidia are formed and forcibly discharged (Agarwal et al., 1993; Warham, 1986). Secondary sporidia produce hyphae or other sporidia by repetition (Fuentes-Dávila et al., 2002).
Sporidia may land on and infect susceptible hosts during a period of favourable environmental conditions. European wheat cultivars are susceptible to infection and further disease development under European climatic conditions (Riccioni et al., 2008). Data indicate that the potential geographic range for Karnal bunt is restricted less by physical requirements for survival of T. indica teliospores than by synchronisation of wheat heading with climatic conditions favourable for teliospore germination, secondary sporidial multiplication, host penetration and infection (Smiley, 1997). Humidity at the time of heading appears to be the most important environmental factor for Karnal bunt occurrence (Aujla et al., 1977; Singh and Prasad, 1978; Warham and Flores, 1988). The above
5
Hereinafter referred to as US.
6
mentioned research project (Sansford et al., 2006) studied the establishment potential of T. indica in the EU territory by adopting an approach combining a pathogen model with crop phenology models. This combined modelling approach was deployed to identify if overlap occurs between the susceptible phenological stage of wheat and the meteorological conditions suitable for T. indica infection and disease development. The results from the study was that there is a substantial risk of infection by T. indica in most years in the EU for both durum and bread wheat. The risk is not greatly influenced by the management of the crops in terms of sowing date or maturity class. Climatic variation at the continental European scale is a strong determinant of the risk of establishment of T. indica. Northern regions may on occasion be too cold and western regions too moist to favour infection and disease development. However, using historic meteorological data on a year by year basis, there were always years and locations in Europe shown to be favourable to infection and disease development.
There is no information available in the literature either on the minimum density of teliospores in soil or on the number of sporidia at the infection court that are necessary for the Karnal bunt symptoms on wheat plants, or whether such thresholds exist. According to Rush et al. (2005), the relationship between inoculum density and disease incidence has yet to be elucidated. Studies in Arizona attempting to determine the minimum teliospore threshold required for infection have been unsuccessful to date because of the lack of suitable environmental conditions, even in the presence of a misting system (Rush et al., 2005).
Disease severity on individual kernels varies from small points of infection at the embryonic end (tip-infection; according to Nagarajan, 2001, this is a type 1 sorus) to complete transformation of the kernel into a sorus (sorus type 4) (Cunfer et al., 1997; Fuentes-Dávila, 1997; Nagarajan, 2001). The weight of infected grain is directly related to the severity of infection. As the amount of infection increases, the grain weight correspondingly decreases (Bedi and Meeta, 1981; Bedi et al., 1981; Rai and Singh, 1982). The difference in weight between heavily and slightly infected grains can be about 50 % (Bhat et al., 1980). Similarly Bansal et al. (1984a, in Warham, 1986) found that an increase in disease severity proportionately decreased the 1,000 grain weight of four different wheat cultivars. At low disease severities, losses were greatest in the cultivar with the smallest grains. T. indica reduces flour quality in terms of colour, odour and palatability. There appears to be some controversy on the level of infection that affects flour quality. According to Vimal Mehdi et al. (1973), 1-3 % infected kernels may be sufficient to render wheat grain unacceptable for human consumption. Other researchers, however, tend to agree that with 3 % or less infected kernels the quality characteristics such as appearance and palatability for bread are unaffected (Sekhon et al., 1980). Grain with 5 % infected kernels can be used to produce satisfactory products if they are first washed, whereas if they are washed and steeped, samples with 10 % infected grains can be used to produce acceptable products (Sekhon et al., 1981). According to Peña et al. (1992), in general, levels of infection of up to 9 % do not influence negatively the milling and baking quality characteristics of wheat. In addition, flour and bread samples are organoleptically acceptable at 1-3 % infection level, respectively. The same authors concluded that washing prior to milling make it possible to produce flour and bread having acceptable organoleptic characteristics from wheat lots with up to 6 % infection.
1.3. Wheat production in the US states where Karnal bunt has been detected
Karnal bunt disease of wheat has been reported in US in counties of Arizona, California and Texas. There was an initial report also from New Mexico counties where Karnal bunt infested seed was used for planting, but subsequently symptoms of the disease have never been observed in this state (Rush et al., 2005).
In 2009, Arizona, California and Texas together accounted for approximately 6 % of the total US wheat harvested area and 5 % of total US wheat production. Among these three states, Texas is the major producer with 4.9 % of the total US wheat harvested areas and 2.8 % of total US wheat production. The states of Arizona and California, respectively, accounted for 5 % and 7 % of total US durum wheat harvested area and for 11 % and 16 % of total US durum wheat production in 2009 (USDA NASS, online). A large proportion of the durum wheat grown in these states is "DesertDurum®", a registered brand name for durum wheat grown in Arizona and California. Desert
durum wheat is produced under irrigation in the desert valleys and lowlands of Arizona and California, in regions of high temperatures (May-June temperatures average 32 °C) and low rainfall (annual precipitation averages less than 200 mm). Desert durum wheat is planted in December through February and harvested in May and June with an average grain moisture content of 6-7 %. Due to its low moisture, large uniform kernels and high gluten strength, Desert durum wheat is appreciated by millers and pasta manufacturers (DesertDurum®.com, online; Posner et al., 2006). Desert durum wheat is usually delivered "identity preserved" to US domestic and export markets. The identity preservation system allows buyers to purchase grain of varieties having intrinsic quality parameters specific to their needs. Annual production requirements are contracted in advance to growers using certified seed, and then stored by identity for season-long shipment at the buyer's schedule. Desert durum is handled by a limited number of grain merchandisers (four in Arizona and four in California) and mostly shipped from US ports on the Gulf of Mexico (DesertDurum®.com, online). In most years, more than 60 % of the total production of desert durum wheat is exported, Italy being the main importer country (Arizona Grain Research and Promotion Council, 2005, 2006, 2008).
1.4. European Union wheat grain production, import and milling
Harvested production, area of production (Eurostat, online a) and imported quantities (Eurostat, online b) for common wheat (or bread wheat, Triticum aestivum L.) are shown (together with spelt) for the EU Member States in tables 24, 26 and 28 in Appendix A of this opinion. The highest harvested productions of common wheat are reported for France, Germany and United Kingdom (table 24) and the highest areas of production for France, Germany and Poland (table 28). Among EU member states, the main importers of common wheat and spelt in the EU are Spain, Italy and United Kingdom (table 26). The European flour milling industry, with more than 3000 milling companies processes annually about 45 million tonnes of wheat and rye, mostly from intra-EU origins and partly (about 2.5 million tonnes of hard red spring wheat) from third countries such as US and Canada (GAM, 2008; European Flour Millers, online).
The production of durum wheat (Triticum durum), used for production of pasta, couscous and bread in the European Union, varied in the period 2000-2009 between 8 and 12 million tonnes, with Italy, France, Spain and Greece being the top producers in terms of harvested production and area of production (table 25 and table 29). The importation of durum wheat grain varied in the same period between 1 and 2 million tonnes per year, with Italy being the main importer of durum wheat (Table 27). The EU durum wheat semolina industry is based on 210 mills, about 160 of which are located in Italy; these mills process 7.5 million tonnes of durum wheat yearly for the production of more than 5 million tonnes of durum wheat semolina, essentially for use by the pasta industry (Italmopa, online; Semouliers, online).
1.5. Structure of the opinion
Following this introduction, the scientific opinion is structured in two main parts.
Section 2 answers the first question of the terms of reference, i.e. the evaluation of the USDA APHIS quantitative pathway analysis, is dealt with in Section 2.
The second question of the terms of reference, i.e. whether or not the US bunted kernel standard would provide an equivalent protection against the introduction of T. indica into the EU, compared to the existing EU import requirement, is dealt with in Section 3.
2. Review of the USDA APHIS quantitative pathway analysis
The USDA APHIS quantitative pathway analysis is based on two models, one for the wheat pathway (both common and durum wheat), and one for the desert durum wheat pathway. The methods used for evaluating the two models are presented in Section 2.1 and the results of the evaluation are presented in Section 2.2. Scenario, model assumptions and structure, parameter values are reviewed by the Panel in Sections 2.2.1, 2.2.2, 2.2.3, and 2.2.4. The outputs obtained with the original versions of the two models are presented and discussed in Section 2.2.5. Updated versions of the wheat and desert durum
models are then defined in Section 2.2.6 based on available data and literature, and the outputs of the two updated models are presented and discussed in Section 2.2.7. Finally, conclusions are presented in Section 2.3 based on both the original and updated versions of the wheat and desert durum models. A detailed description of the simulation results is presented in a separate technical report of EFSA (EFSA, 2010).
2.1. Methods for evaluation of the USDA APHIS document
Review of probabilistic models has been made by many authors, e.g. Morgan and Henrion (1990). Several problems are noted arising from the need for a complete documentation of the model and all data sources, the complexity of the model, its implementation, and the involvement of experts from several disciplines.
Morgan and Henrion (1990) describe the process as:
“For a complex policy model, a thorough review can be an extremely arduous and time consuming business, even if adequate documentation exists. Such review is far from standard practice (von Hippel, 1981).(...) There is increasing interest in the problems and practice of model assessment (NBS, 1980). It has been suggested (GAO, 1979) that model assessment should include examination of all data, assumptions, and computer code, with additional runs of the model to examine sensitivities. Models are often assembled by a team of specialists from several different disciplines (e.g., economists, natural scientists, engineers, statisticians, computer specialists, etc.). It is unrealistic to expect a reviewer to be able to perform a complete assessment, unpaid and single-handed. In the case of large models, a proper external assessment will require a multidisciplinary team, and a significant budget. (...) Many practitioners in policy analysis have argued that peer reviewed publication is not appropriate to the field, an argument sometimes made even in the case of modest analyses that do not involve large complex models. The claim is that peer review is not feasible because of the time urgent nature of the work.” (ibidem, chapter 3.2.4).
Nevertheless a thorough review is recommended to establish an appropriate degree of confidence in the results and the decisions that follow in view of the identified uncertainties and data gaps.
Whereas guidance on systematic review of probabilistic models is missing, the “Project on the Harmonization of Approaches to the Assessment of Risk from Exposure to Chemicals (Harmonization Project)” of the International Programme on Chemical Safety (IPCS) and the World Health Organization (WHO) developed guidance on characterizing and communicating uncertainty in exposure assessment (WHO/ICPS, 2008). Here it is recommended: “The results of the assessment should be subject to an evaluation process that may include peer review, model comparison, quality assurance, or comparison to relevant data or independent observations.” (ibidem, Recommendation 8)
The WHO/IPCS (2008) report describes existing concepts for a systematic assessment of uncertainties and proposes a harmonized approach for a qualitative analysis. In this document the structure will be used as guidance for a systematic evaluation of an existing report.
“The objective of qualitative characterization of uncertainty includes transparency in identifying key sources of uncertainty as an aid to risk managers who may need to make decisions in the absence of extensive data sets for substances with limited information - a prerequisite to quantification of uncertainty for substances with more extensive data.
The aim of qualitative characterization of uncertainty is to provide a conceptual basis for the systematic assessment of uncertainty in decision support processes such as exposure assessment. It focuses on uncertainty perceived from the point of view of assessors providing information to support policy decisions - that is, uncertainty regarding the analytical outcomes and conclusions of the exposure assessment.” (WHO/IPCS, 2008, p.38)
This approach exceeds in some respects the proposal for a qualitative analysis (Tier 1) formulated in a previous EFSA Guidance on “Uncertainties in Dietary Exposure Assessment” (EFSA, 2006); but the PLH Panel selected the WHO/IPCS approach due to the specific terms of references, which ask for a qualitative and as well a quantitative review of the existing quantitative, probabilistic pathway model. The necessity to review all quantitative elements requires also a more detailed qualitative analysis of the model.
The WHO/IPCS approach consists of two basic steps:
1. the specification of all sources of uncertainty, and 2. the qualitative characterization.
The Panel added the review of the quantitative characterization in the second step.
The specification of sources of uncertainty focuses on the main classes of uncertainty: scenario uncertainty, model uncertainty and parameter uncertainty. The relating parts of the exposure assessment: scenario definition, model definition and parameter definition can also be seen as a tiered approach in the modelling procedure. Each step defines a further refinement of specifications, including additional gaps in information and uncertainties.
The first tier of the evaluation procedure analyses the definition of the general scenario. Uncertainties are discussed in terms of:
• Basic source : scenario
o Source and target population of the agent, exposure pathways o Exposure routes, events
o Spatial and temporal resolution, microenvironment
o Variation in agent, exposed population, time and space, activities o Risk management options
The second tier looks on the definition of the model. This includes uncertainties in the “conceptual model”, which connect the selected scenario with the concrete quantitative computations.
• Basic source : model
o Model assumptions, structure and dependencies o Model complexity and equation
o Extra- and interpolation by the model o Model implementation (software)
The third tier assesses the quantitative parameters and describes their parameter uncertainties: • Basic source : parameters
o Data sources, correlation and precision
o Data quality, use substitutions or expert judgement o Selection or estimation of concrete values or distributions o Division in variation and uncertainties
For all identified sources of uncertainty the qualitative evaluation 1. discusses the level of uncertainty;
2. qualitatively evaluates the appraisal of the knowledge base of each major source;
3. determines the controversial sources of uncertainty and qualitatively evaluates the subjectivity of choices in each controversial source.
The level of uncertainty describes the overall impact of the uncertainty on the output of the model. In a quantitative analysis this can be done by a sensitivity analysis, as performed in this report.
Table 1: The appraisal of the knowledge base focuses on the adequacy of the available knowledge base for the assessment (WHO/IPCS, 2008, Table 2)
Criteria Approaches and considerations
Accuracy 1) establishing the knowledge base needed to obtain answers of the required quality 2) signalling controversies with respect to the knowledge base
3) identifying the most important bottlenecks in the available knowledge 4) determining the impact of these bottlenecks on the quality of the results 5) assessing the assumptions covering the knowledge gaps
Reliability 1) criticizing the knowledge base severely on factual and methodological grounds 2) identifying the scientific status of the knowledge base
3) determining the quality soundness of the knowledge base
4) assessing the appropriateness of judgemental estimates of level of confidence Plausibility 1) determining the completeness of the knowledge base
2) acknowledging ignorance when applicable
3) analysing the possibility of changes in underlying processes over time 4) considering well established observations
Scientific consistency
1) assessing the consistency of scientific support 2) assessing the maturity of the underlying science 3) assessing the scientific limitations
4) analysing the degree to which understanding is based on fundamental concepts tested in other areas
Robustness 1) assessing the predictability of the values and of the results 2) assessing the dependency relationships
The subjectivity of choices delivers insight into the decision process of the assessors. Table 2: Subjectivity of choice (WHO/IPCS, 2008, Table 3)
Criteria Approaches and considerations Choice space 1. spanning alternative choices Intersubjectivity among peers and
among stakeholders
2. specifying the similarity of choices among peers and among stakeholders
3. specifying the controversy of choices among peers and among stakeholders
money, tools and time) on choices choices Sensitivity of choices to the analysts’
interests
5. assessing the sensitivity of the choices to the analysts’ interests
Influence of choices on results 6. determining the influence of the choices on the results
2.2. Results of the evaluation of the USDA APHIS document
In this Section, we review the scenario (2.2.1), model assumptions and structure (2.2.2), wheat model parameter values (2.2.3), and desert durum wheat model parameter values (2.2.4). Parameter values are presented and discussed submodel per submodel. Model outputs obtained with the original models are presented in 2.2.5.1 and the sensitivity of model outputs to parameter values is analyzed in 2.2.5.2. Updated versions of the models are then defined in 2.2.6.1 and 2.2.6.2 for the wheat model and for the desert durum wheat model respectively. Their outputs are presented in 2.2.7.1 and the sensitivity of these outputs to parameter values is analyzed in 2.2.7.2.
2.2.1. Scenario considered by the USDA APHIS quantitative pathway analysis The evaluation of the USDA APHIS document follows the tiered approach discussed on Section 2.1. The main tiers are the review of the pathway scenarios, the model and the parameters.
2.2.1.1. Pathways
Two pathway scenarios are considered in the USDA APHIS quantitative model:
- introduction of T. indica in each EU country from the importation of US wheat for grain - introduction of T. indica in Italy from the importation of US desert durum wheat for grain These pathways only consider the importation of wheat and desert durum wheat from US for the European and Italian milling industry. It is assumed that no grain would be diverted for seeds. It is also assumed that whole grain for feed would not present a pathway for T. indica introduction, considering that sample grade grain, e.g. low quality wheat grain, is typically blended with other wheat to produce flour rather than being sent directly to feedlots. No consideration is given to the pathway of grain for ethanol. This leads to uncertainty as this pathway is not discussed and data on its possible importance are not provided.
As the reason of the quantitative pathway analysis is to ask for a derogation for the importation of wheat and desert durum wheat for grain, other potential pathways of introduction are not considered in the USDA APHIS document (e.g., straw, machinery, and travelers which are considered as potential pathways of introduction of T. indica in Australia by Stansbury et al. (2002)).
2.2.1.2. Space scale
The areas of wheat production in the US considered in the model are:
‐ Karnal bunt regulated counties of Arizona, California and Texas, for the wheat for grain pathway (Table 3)
‐ Karnal bunt regulated counties of Arizona and California, for the desert durum wheat for grain pathway (Table 3)
The risk of T. indica introduction from the wheat for grain pathway is computed by the model for each EU country separately. The risk of T. indica introduction from the desert durum wheat pathway is computed for Italy only.
15 EFSA Journal 2010; 8(6):1621
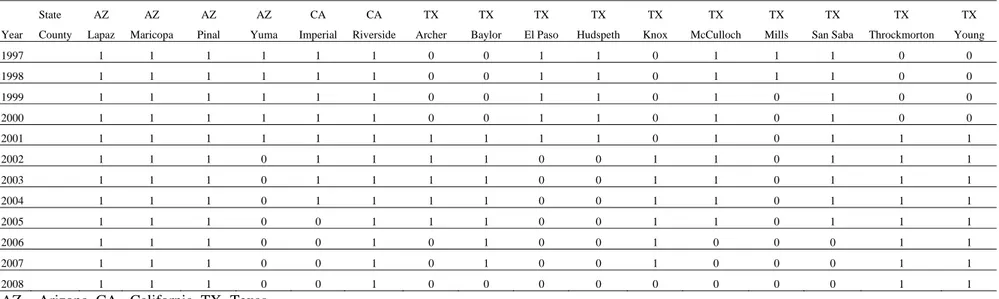
Table 3: Karnal bunt regulated counties of Arizona, California and Texas (1 = regulated; 0= non regulated) 1997-2008 (from USDA APHIS Central Federal Registry Ch. III Subpart –Karnal bunt 301.89 editions 1997-2009)
State AZ AZ AZ AZ CA CA TX TX TX TX TX TX TX TX TX TX
Year County Lapaz Maricopa Pinal Yuma Imperial Riverside Archer Baylor El Paso Hudspeth Knox McCulloch Mills San Saba Throckmorton Young
1997 1 1 1 1 1 1 0 0 1 1 0 1 1 1 0 0 1998 1 1 1 1 1 1 0 0 1 1 0 1 1 1 0 0 1999 1 1 1 1 1 1 0 0 1 1 0 1 0 1 0 0 2000 1 1 1 1 1 1 0 0 1 1 0 1 0 1 0 0 2001 1 1 1 1 1 1 1 1 1 1 0 1 0 1 1 1 2002 1 1 1 0 1 1 1 1 0 0 1 1 0 1 1 1 2003 1 1 1 0 1 1 1 1 0 0 1 1 0 1 1 1 2004 1 1 1 0 1 1 1 1 0 0 1 1 0 1 1 1 2005 1 1 1 0 0 1 1 1 0 0 1 1 0 1 1 1 2006 1 1 1 0 0 1 0 1 0 0 1 0 0 0 1 1 2007 1 1 1 0 0 1 0 1 0 0 1 0 0 0 1 1 2008 1 1 1 0 0 1 0 0 0 0 0 0 0 0 1 1
Within-country variability is not considered by the model and thus the level of risk is considered to be constant within each country
2.2.1.3. Time-frame
Teliospore accumulation is computed for each EU country over a five year period. Recent empirical data from different years are used to describe the actual situation and predict the effect of the application of the USDA APHIS bunted kernel standard (e.g., Rush et al., 2005; USDA APHIS, 2007).
2.2.1.4. Detection method
The detection method considered by the model corresponds to the USDA APHIS bunted kernel standard (e.g., Rush et al., 2005; USDA APHIS, 2007). The model thus assumes that every field in regulated counties is checked for the presence of bunted kernels by manual inspection in Arizona and California, and by using a high speed optical sorter in Texas. Under the scenario considered by the model, grains are not tested for the presence of the pathogen
2.2.1.5. Variation
Several sources of variation are taken into account by the model:
‐ Variability of the wheat production between counties and between years
‐ Variability of the proportion of the regulated counties that are positive for bunted kernels ‐ Proportion of bunted kernels in bunted kernel positive areas
‐ Bunted kernels exported to each EU country
‐ Total, agricultural land and wheat cultivated areas in each EU country and their variability across years
Several potential sources of variation are not taken into account by the original USDA APHIS model: ‐ wheat cultivars (e.g., potential yields, susceptibility to T. indica)
‐ characteristics of the condition of transportation between ships and storage units, and between storage units and mills (e.g., grain unload technique, distances)
‐ characteristics of the mills (e.g. size)
‐ variability of teliospore density between different sites located within a given EU country
2.2.2. Model assumptions, dependency (interaction of input parameters) and structure
The model follows the pathway of teliospores of T. indica from their appearance on infected fields of wheat production in the regulated counties in the US States of Arizona, California and Texas to their dispersal on wheat growing areas in European countries.
The starting point is the yield of wheat or durum wheat and its infestation with bunted kernels in the years 1997-2005. The end-point variable is the average number of viable teliospores per hectare of wheat production area with suitable temperatures for T. indica introduction. The calculation is made for each European country separately.
The risk (probability) of introduction is estimated by applying a minimal threshold value to the average teliospore density per hectare. The risk is calculated for the first year after applying the US bunted kernel standard and for the accumulated values in the following four years. Furthermore, the time needed for introduction is calculated by a negative binomial distribution.
A probabilistic approach is used to calculate the variation between years and the uncertainty of introduction, by calculating confidence limits for introduction under varying and uncertain conditions.
Figure 1: Grain pathway model (from USDA APHIS, 2008) Kernels from the regulated counties
Kernels from the positive area
Bunted kernels from the positive area
Bunted kernels exported to European Union Bunted kernels that escape detection by PPQ
Bunted kernels exported out of United States
Teliospores exported to European Union
Teliospores at grain storage
Teliospores at feedlots
Teliospores that survive cattle digestion Teliospores at feedlot storage Teliospores in millfeed
Teliospores at mills after milling Teliospores at mills
Teliospores spilled between port and grain storage
Teliospores spilled between grain storage and mill
Teliospores released during milling
Teliospores in flour (sub pathway ends)
Teliospores spilled between mill and feedlot storage
Teliospores spilled between feedlot storage and feedlot
Dead teliospores (sub pathway ends)
Teliospores dispersed to wheat production
area in manure
Teliospores per hectare wheat production area with suitable temperatures for introduction
Teliospores accumulation after two to five years
Submodel 1:
Submodel 2:
Submodel 5:
Submodel 3: Submodel 4:
The full model is divided into five separate sub models: 1. Grain export sub-pathway model
2. Wheat for flour sub-pathway model 3. Millfeed products sub-pathway model 4. Spillage sub-pathway model
5. T. indica introduction sub-pathway model
Each preceding model ends with the number of bunted kernels or teliospores and their probability to enter the next step. The number entering the proceeding step is determined by a binomial experiment giving additional variation of the outcome variable.
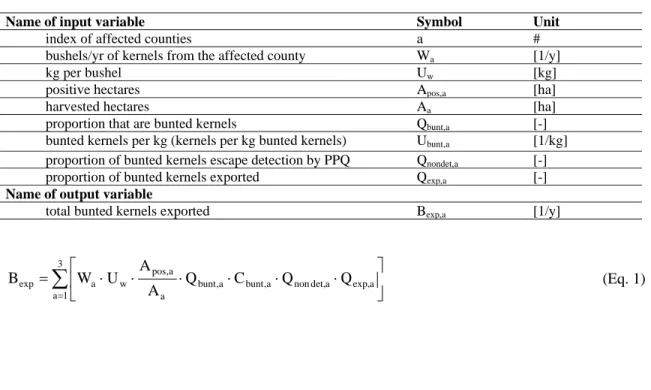
2.2.2.1. Submodel 1 – Grain export sub-pathway model The first submodel describes the total number of bunted kernels exported by the US.
This number is estimated by the yearly yield from the affected counties for each State (index a) separately, expressed in numbers of bushels per year (Wa), converted by weight (by a factor Uw) and number of kernels produced (factor Ubunt,a). The weight per bushel (Uw) is assumed to be constant. To obtain the number of bunted kernel per State several correction factors are applied. These are the ratio of positive and harvested hectares in the specific county (Apos,a/Aa), the proportion of bunted kernels on positive fields (Qbunt,a), the proportion of bunted kernels which escape detection (Qnondet,a) and the proportion of bunted kernels exported (Qexp,a). Intermediate calculations of numbers of kernels are rounded to the next integer.
The final number of exported bunted kernels (Bexp,a) is the sum of the numbers exported from Arizona, California and Texas for wheat or from Arizona and California for desert durum wheat.
All input variables were modelled by distributions to express their variation and/or uncertainty and assumed to be independent.
Table 4: Grain export sub-pathway (Steps 1 to 11)
Name of input variable Symbol Unit
index of affected counties a #
bushels/yr of kernels from the affected county Wa [1/y]
kg per bushel Uw [kg]
positive hectares Apos,a [ha]
harvested hectares Aa [ha]
proportion that are bunted kernels Qbunt,a [-]
bunted kernels per kg (kernels per kg bunted kernels) Ubunt,a [1/kg]
proportion of bunted kernels escape detection by PPQ Qnondet,a [-]
proportion of bunted kernels exported Qexp,a [-] Name of output variable
total bunted kernels exported Bexp,a [1/y]
∑
= ⎥⎦ ⎤ ⎢ ⎣ ⎡ ⋅ ⋅ ⋅ ⋅ ⋅ ⋅ = 3 1 a a exp, a det, non a , bunt a , bunt a a , pos w a exp Q C Q Q A A U W B (Eq. 1)2.2.2.2. Submodel 2 – Wheat for flour
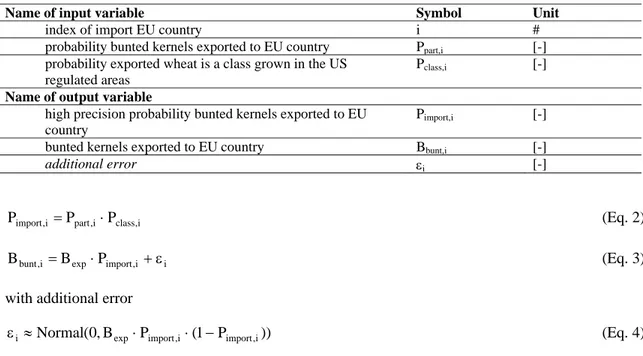
The first part of the second submodel calculates the number of bunted kernels exported to a specific country of the European Community (index i). As a simplification, Luxemburg is modelled in combination with Belgium.
As intermediate results, two probabilities were estimated. The probability that an exported kernel arrives at one specific EU country Ppart,i is estimated by the ratio of total amount of USA exported wheat to a specific country divided by the total amount of US exported wheat to the whole world. This calculation assumes that produced kernels of US export will be homogeneously distributed to all countries.
A second probability Pclass.i ,that an imported kernel in one Member State is of an affected wheat class, is estimated by the ratio of the total number of imported metric tons of this class divided by the total number of imported kernels of all classes. This calculation assumes that the kernels of affected classes are not traceable in the importing country.
Both probabilities are multiplied, which expresses the independency of each process. In summary, it means that each imported kernel has the same chance to be produced in the regulated US area and each produced kernel of the whole US production has the same chance to reach a specific European country. Economic relationships, such as the export of a specific variety (e.g. desert durum) or from a specific production area to a specific country or importer (e.g. Italian pasta producer), does not fit into this assumption. Therefore, a second scenario was defined by USDA APHIS resulting in specific parameters for the specific desert durum wheat pathway for Italy, while the model equations were not changed.
An error term εi adds variation which results from the individual distribution of the bunted kernels exported to each country, expressed through the asymptotic normal distribution of a binomial experiment.
Table 5: Wheat for flour sub-pathway (Steps 1 to 4)
Name of input variable Symbol Unit
index of import EU country i #
probability bunted kernels exported to EU country Ppart,i [-]
probability exported wheat is a class grown in the US regulated areas
Pclass,i [-]
Name of output variable
high precision probability bunted kernels exported to EU country
Pimport,i [-]
bunted kernels exported to EU country Bbunt,i [-]
additional error εi [-] i , class i , part i , import P P P = ⋅ (Eq. 2) i i , import exp i , bunt B P B = ⋅ +ε (Eq. 3)
with additional error
)) P 1 ( P B , 0 (
Normal exp import,i import,i
i ≈ ⋅ ⋅ −
ε (Eq. 4)
The result is rounded to the next full number and truncated below zero.
In the next step the number of bunted kernels Bbunt,I is converted to the number of released teliospores
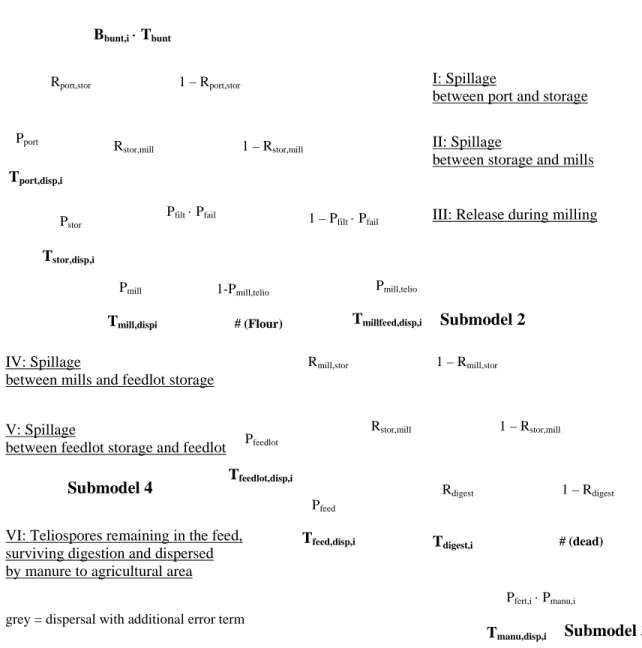
There are several routes included in the model as to how T. indica teliospores can reach European wheat fields:
I. Spillage between port and storage unit II. Spillage between storage and mills III. Release during milling
IV. Teliospores remaining in the feed and spilled between mills and feedlot storage V. Teliospores remaining in the feed spilled between feedlot storage and feedlot
VI. Teliospores remaining in the feed, surviving digestion and dispersed by manure to agricultural areas
Figure 2: Routes from import to wheat production area
1 – Rstor,mill
1 – Rdigest
# (dead)
I: Spillage
between port and storage
III: Release during milling II: Spillage
between storage and mills
Tmillfeed,disp,i 1 – Rmill,stor Rmill,stor Tfeedlot,disp,i Rstor,mill Tfeed,disp,i Rdigest Tdigest,i Pfert,i ⋅ Pmanu,i Tmanu,disp,i Pmill,telio 1-Pmill,telio # (Flour) 1 – Rport,stor Rport,stor Tport,disp,i 1 – Rstor,mill Rstor,mill Tstor,disp,i Bbunt,i⋅ Tbunt 1 – Pfilt ⋅ Pfail Pfilt ⋅ Pfail Pmill Tmill,dispi IV: Spillage
between mills and feedlot storage
V: Spillage
between feedlot storage and feedlot
VI: Teliospores remaining in the feed, surviving digestion and dispersed by manure to agricultural area
Pport
Pstor
Pfeedlot
Pfeed
grey = dispersal with additional error term
Submodel 2
Submodel 3 Submodel 4
The number of teliospores remaining in products for feed Tmillfeed,i (route VI) needs information on the loss between port and storage Rport,stor, between storage and mill Rstor,mill, the probability that teliospores are trapped by the filter system Pfilt, the probability that the filter system is not working Pfail and the proportion of milling products going to feed Ptelio,mill.
Table 6: Wheat for flour sub-pathway (Steps 5 to 15)
Name of input variable Symbol Unit
teliospores per bunted kernel Tbunt [-]
proportion of teliospores spilled from port to storage processing facility
Rport,stor [-]
proportion of teliospores spilled from storage to mill processing facility
Rstor,mill [-]
probability teliospores enter house filter Pfilt [-]
probability house filter fails Pfail [-]
probability teliospores in millfeed Ptelio,mill [-] Name of output variable
teliospores at mills after milling Tmill,i [-]
teliospores sent to millfeed Tmillfeed,i [-]
additional error εmillfeed,i [-]
) P P 1 ( ) R 1 ( ) R 1 ( T B
Tmill,i = bunt,i⋅ bunt⋅ − port,stor ⋅ − stor,mill ⋅ − filt⋅ fail (Eq. 5)
The error term εmillfeed,i adds variation which results from the individual distribution of the teliospores to the millfeed, expressed through the asymptotic normal distribution of a binomial experiment.
i , millfeed mill , telio i , mill i , millfeed T P T = ⋅ +ε (Eq. 6)
with additional error
)) P 1 ( P T , 0 (
Normal mill,i telio,mill telio,mill i
,
millfeed ≈ ⋅ ⋅ −
ε (Eq. 7)
The result is again rounded to the next full number and truncated below zero. 2.2.2.3. Submodel 3 – Millfeed products
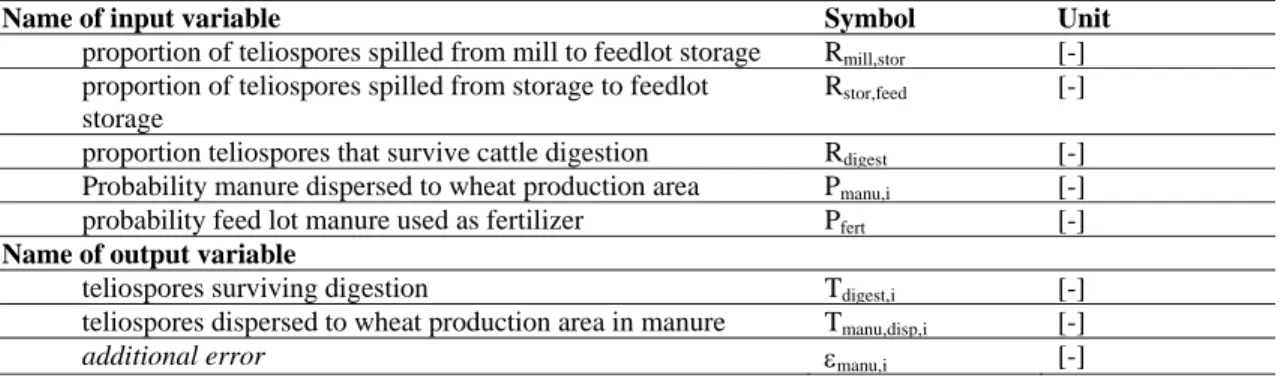
The teliospores in feed have to survive digestion Rdigest, must be spread via manure Pfert,i to reach an agricultural area, and then reach a wheat field with probability Pmanu,i. The last probability is estimated by the ratio of area used for wheat production divided through the total agricultural area of each country.
Table 7: Millfeed products sub-pathway (Steps 1 to 10)
Name of input variable Symbol Unit
proportion of teliospores spilled from mill to feedlot storage Rmill,stor [-]
proportion of teliospores spilled from storage to feedlot storage
Rstor,feed [-]
proportion teliospores that survive cattle digestion Rdigest [-]
Probability manure dispersed to wheat production area Pmanu,i [-]
probability feed lot manure used as fertilizer Pfert [-] Name of output variable
teliospores surviving digestion Tdigest,i [-]
teliospores dispersed to wheat production area in manure Tmanu,disp,i [-]
digest feed , stor stor , mill i , disp , millfeed i , digest T (1 R ) (1 R ) R T = ⋅ − ⋅ − ⋅ (Eq. 8)
The error term εmanu,i adds variation which results from the individual distribution of the teliospores to the wheat fields, expressed through the asymptotic normal distribution of a binomial experiment.
i , manu fert i , manu i , digest i , disp , manu T P P T = ⋅ ⋅ +ε (Eq. 9)
with additional error
)) P P 1 ( P P T , 0 (
Normal digest,i manu,i fert manu,i fert i
,
manu ≈ ⋅ ⋅ ⋅ − ⋅
ε (Eq. 10)
The result is rounded to the next full number and truncated below zero.
2.2.2.4. Submodel 4 - Spillage
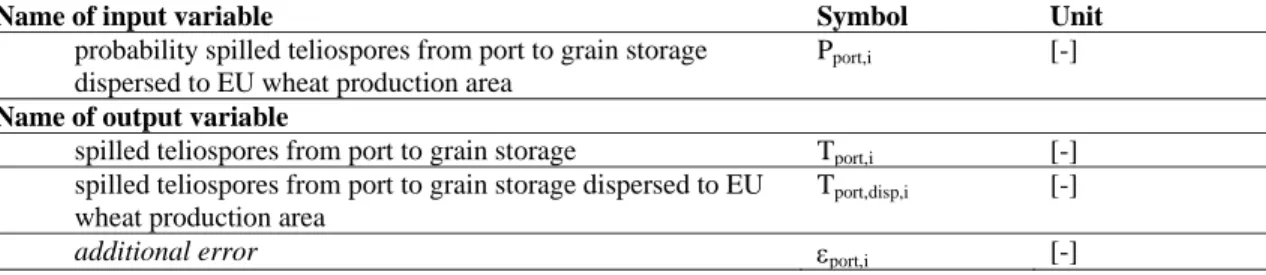
The pathways of spillage are each modelled in a similar way. To calculate the amount of spilled teliospores, the actual number before this step is needed, the proportion of teliospores spilled in this step, and the probability that spilled teliospores reach a wheat field. The last probability is estimated by the ratio of area used for wheat production divided through the total area of each country.
At the port all imported teliospores Bbunt,i⋅Tbunt are still present. The spilled part is Rport,stor and the probability to reach a wheat production area is Pport,i.
Table 8: Spillage sub-pathway (Steps 1 to 2: spills during grain transport)
Name of input variable Symbol Unit
probability spilled teliospores from port to grain storage dispersed to EU wheat production area
Pport,i [-]
Name of output variable
spilled teliospores from port to grain storage Tport,i [-]
spilled teliospores from port to grain storage dispersed to EU wheat production area
Tport,disp,i [-]
additional error εport,i [-]
stor , port bunt i , bunt i , port B T R T = ⋅ ⋅ (Eq. 11)
The error term εport,i adds variation which results from the individual distribution of the teliospores to the wheat fields, expressed through the asymptotic normal distribution of a binomial experiment.
i , port i , port i , port i , disp , port T P T ≈ ⋅ +ε (Eq. 12)
with additional error
)) P 1 ( P T , 0 (
Normal port,i port,i port,i i
,
port ≈ ⋅ ⋅ −
ε (Eq. 13)
Table 9: Spillage sub-pathway (Steps 1 to 2: spills during grain transport between grain storage and mills)
Name of input variable Symbol Unit
probability spilled teliospores between grain storage and mills dispersed to wheat production area
Pstor,i [-]
Name of output variable
spilled teliospores between grain storage and mills Tstor,i [-]
spilled teliospores between grain storage and millsdispersed to wheat production area
Tstor,disp,i [-]
additional error εstor,i [-]
At storage some teliospores Bbunt,i⋅Tbunt⋅(1-Rport,stor,i) are still present. The newly, spilled part is Rstor,mill and the probability to reach a wheat production area is Pstor,i. The last probability is estimated by the ratio of area used for wheat production divided through by the total agricultural area of each country.
mill , stor stor , port bunt i , bunt i , stor B T (1 R ) R T = ⋅ ⋅ − ⋅ (Eq. 14)
The error term εstor,i adds variation which results from the individual distribution of the teliospores to the wheat fields, expressed through the asymptotic normal distribution of a binomial experiment.
i , stor i , stor i , stor i , disp , stor T P T = ⋅ +ε (Eq. 15) )) P 1 ( P T , 0 (
Normal stor,i stor,i stor,i i
,
stor ≈ ⋅ ⋅ −
ε (Eq. 16)
The result is rounded to the next full number and truncated below zero.
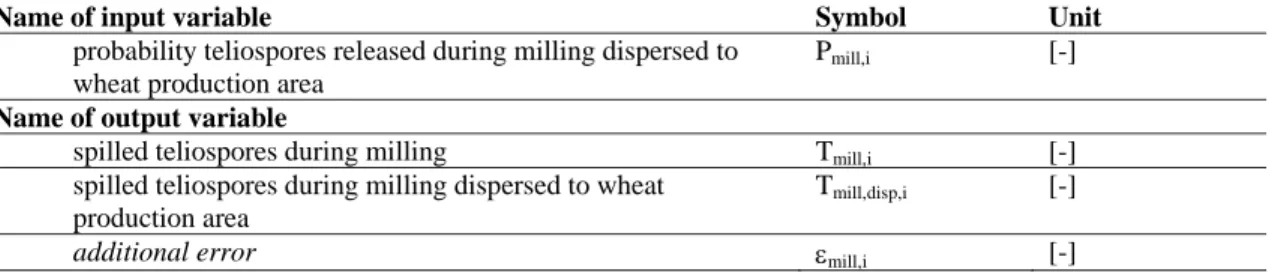
Table 10: Spillage sub-pathway (Steps 1 to 2: teliospores released during milling)
Name of input variable Symbol Unit
probability teliospores released during milling dispersed to wheat production area
Pmill,i [-]
Name of output variable
spilled teliospores during milling Tmill,i [-]
spilled teliospores during milling dispersed to wheat production area
Tmill,disp,i [-]
additional error εmill,i [-]
At the mill some teliospores Bbunt,i⋅Tbunt⋅(1-Rport,stor,i)⋅(1-Rstor,,mill,i) are still present. The newly, spilled part are the teliospores entering the filter system of the mill Pfilt, but which are not trapped Pfail, and the probability to reach a wheat production area Pmill,i. The last probability is estimated by the ratio of area used for wheat production divided through by the total agricultural area of each country.
fail filt mill , stor stor , port bunt i , bunt i , mill B T (1 R ) (1 R ) P P T = ⋅ ⋅ − ⋅ − ⋅ ⋅ (Eq. 17)
The error term εmill,i adds variation which results from the individual distribution of the teliospores to the wheat fields, expressed through the asymptotic normal distribution of a binomial experiment.
i , mill i , mill i , mill i , disp , mill T P T = ⋅ +ε
with additional error. (Eq. 18)
)) P 1 ( P T , 0 (
Normal mill,i mill,i mill,i i
,
mill ≈ ⋅ ⋅ −
The result is rounded to the next full number and truncated below zero.
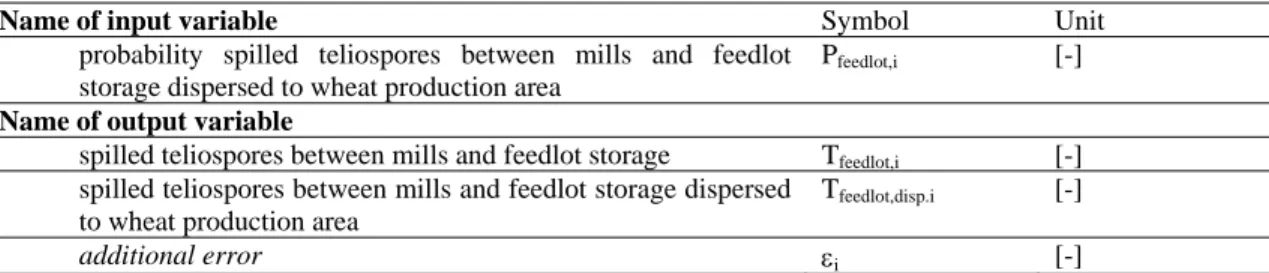
Table 11: Spillage sub-pathway (Steps 1 to 2: spills during millfeed transport between mills and feedlot storage)
Name of input variable Symbol Unit
probability spilled teliospores between mills and feedlot storage dispersed to wheat production area
Pfeedlot,i [-]
Name of output variable
spilled teliospores between mills and feedlot storage Tfeedlot,i [-]
spilled teliospores between mills and feedlot storage dispersed to wheat production area
Tfeedlot,disp.i [-]
additional error εi [-]
Only a part of the teliospores Pmill,telio reaches the millfeed. The model does not take the teliospores in the flour into account. But some teliospores Tmillfeed⋅(1-Rport,stor,i) are still present.
i , millfeed fail filt mill , stor stor , port bunt i , bunt i , disp , millfeed B T (1 R ) (1 R ) (1 P P ) T = ⋅ ⋅ − ⋅ − ⋅ − ⋅ +ε (Eq. 5/6)
The newly, spilled part between the mill and the feed storage is Rmill,stor and the probability to reach a wheat production area is Pfeedlot,i. The last probability is estimated by the ratio of area used for wheat production divided through by the total agricultural area of each country.
stor , mill i , disp , millfeed i , feedlot T R T = ⋅ (Eq. 20)
The error term εfeedlot,i adds variation which results from the individual distribution of the teliospores to the wheat fields, expressed through the asymptotic normal distribution of a binomial experiment.
i , feedlot i , feedlot i , feedlot i , disp , feedlot T P T = ⋅ +ε (Eq. 21)
with additional error
)) P 1 ( P T , 0 (
Normal feedlot,i feedlot,i feedlot,i i
,
feedlot ≈ ⋅ ⋅ −
ε (Eq. 22)
The result is rounded to the next full number and truncated below zero.
Table 12: Spillage sub-pathway (Steps 1 to 2: spills during millfeed transport between feedlot storage and feedlots)
Name of input variable Symbol Unit
probability spilled teliospores between feedlot storage and feedlots dispersed to wheat production area
Pfeed,i [-]
Name of output variable
teliospores at feedlots Tfeed,i [-]
spilled teliospores between feedlot storage and feedlots dispersed to wheat production area
Tfeed,disp,i [-]
additional error εi [-]
At feed storage some teliospores Tmillfeed,1⋅(1-Rmill,stor,i) are still present. The newly, spilled part is Rstor,feed and the probability to reach a wheat production area is Pfeed,i. The last probability is estimated by the ratio of area used for wheat production divided through by the total agricultural area of each country.
feed , stor stor , mill i , disp , millfeed i , feed T (1 R ) R T = ⋅ − ⋅ (Eq. 23)
The error term εfeed,i adds variation which results from the individual distribution of the teliospores to the wheat fields, expressed through the asymptotic normal distribution of a binomial experiment.
i , feed i , feed i , feed i , disp , feed T P T ≈ ⋅ +ε (Eq. 24)
with additional error
)) P 1 ( P T , 0 (
Normal feed,i feed,i feed,i i
,
feed = ⋅ ⋅ −
ε (Eq. 25)
The result is rounded to the next full number and truncated below zero.
All spillage is assumed to be homogeneously distributed to the whole country area. This model does not take into account the fact that spillage will occur mostly close to the main routes for transportation, around harbours, storage units and mills. Therefore regional variation in the numbers of spilled teliospores is not reflected in this model.
2.2.2.5. Submodel 5 - Introduction
All teliospores dispersed onto wheat production areas, coming from all pathways between port and feedlot or manures are summed and divided by the total wheat production area Awheat,i.
This submodel again does not take into account that spillage will occur mostly close to the main routes for transportation, around harbours, storage units and mills. Therefore again regional variation is not fully reflected in this submodel.
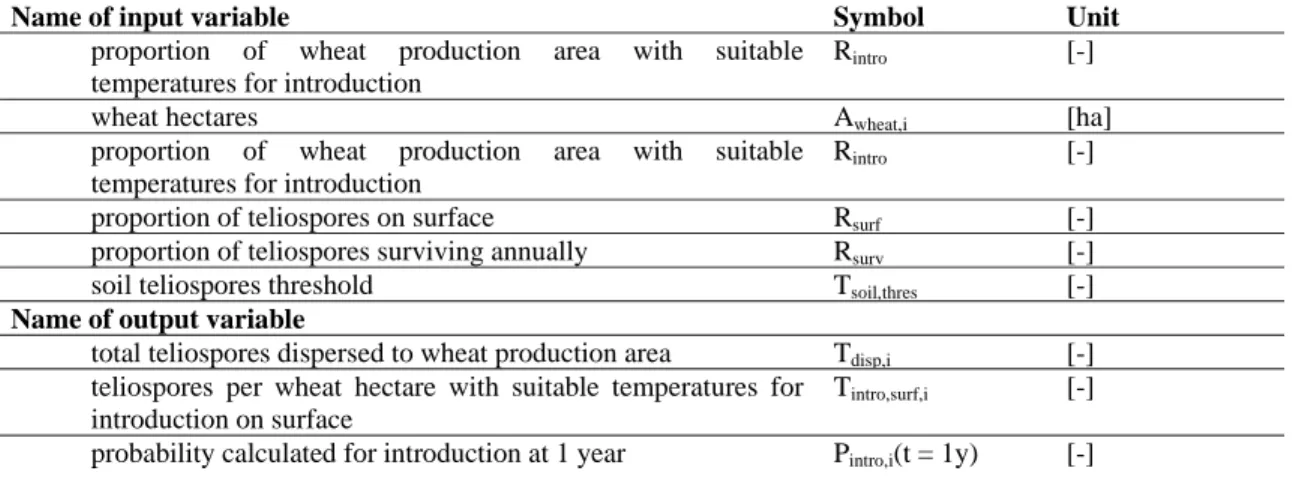
The average number of teliospores per wheat production area is finally multiplied by the proportion of teliospores which are present on the surface of the soil Rsurf. The resulting variable Tintro, surf,i describes the number of teliospores per hectare of wheat production introduced in the first year following use of the US bunted kernel standard. This number is used by the panel as a final model output for further discussion and evaluation. The probabilistic analysis calculates the mean number for all varying or uncertain input variables, the coefficient of variation as a measure of variation and uncertainty, and several percentiles as a description of the resulting distribution. The x % percentile means that in (100-x) % of all combinations the number of teliospores per hectare exceeds the value of the percentile. This might be explained by the variation in time or the uncertainty in the knowledge of correct input values.
Table 13: Introduction sub-pathway (Steps 1 to 11)
Name of input variable Symbol Unit
proportion of wheat production area with suitable temperatures for introduction
Rintro [-]
wheat hectares Awheat,i [ha]
proportion of wheat production area with suitable temperatures for introduction
Rintro [-]
proportion of teliospores on surface Rsurf [-]
proportion of teliospores surviving annually Rsurv [-]
soil teliospores threshold Tsoil,thres [-]
Name of output variable
total teliospores dispersed to wheat production area Tdisp,i [-]
teliospores per wheat hectare with suitable temperatures for introduction on surface
Tintro,surf,i [-]