UNIVERSITY OF NAPLES FEDERICO II
Ph.D in MOLECULAR MEDICINE and MEDICAL BIOTECHNOLOGY - XXXI CICLO
“Small non-coding RNAs and cancer: a bioinformatics
approach”
Tutor Candidate
Prof. Lorenzo Chiariotti Memoli Domenico
Co-Tutor
Prof. Alessandro Weisz
COORDINATOR Prof. Vittorio Enrico
Avvedimento
Small non-coding RNAs and cancer: a bioinformatics approach 2
INDEX
INDEX ………... 2 ABSTRACT ………... 3 1. INTRODUCTION ……… 41.1 New Method for Genomic Analysis ..………. 4
1.2 microRNA (miRNA) …..……….. 5
1.3 Piwi-interacting RNAs .………...….... 6
1.4 Breast Cancer ………...……… 7
1.5 GAPT2 role in BC ……….………... 8
1.6 DOT1L and BC …...………... 8
1.7 Colon-rectal cancer and LINE1 transposable elements .………….. 9
1.8 Pancreatic cancer and Annexin A1 .………... 9
2. AIM ……….. 11
3. MATERIALS AND METHODS ………... 12
4. RESULTS ……… 15
4.1 Part One: Developing iSmaRT and Testing ……….15
Developing Tools …….……….. 15
iSmaRT pipeline …….……….. 15
iSmart main interface ……….. 17
Output of iSmaRT ……….………... 21
Testing procedure iSmaRT on Huntington’s disease data …...…… 23
Testing procedure iSmaRT on GAPT2 silenced BC cell …...……… 25
Testing procedure iSmaRT on BC cell with EPZ a DOT1L inhibitor ……... 34
4.2 Part Two: Application of iSmaRT on Pancreatic tumor …..……. 36
4.3 Part Three: Colon Cancer Transcriptomics Analysis with iSmaRT………..………... 38 5. DISCUSSION ……….. 41 6. CONCLUSION ………... 45 7. ACKNOWLEDGMENTS ……….. 46 8. REFERENCES ………... 47 9. LIST OF PUBLICATION ..………... 55
Small non-coding RNAs and cancer: a bioinformatics approach
3
ABSTRACT
The development of Next-Generation Sequencing (NGS) technologies has added a new method to investigate the role of genes in several diseases, including breast cancer (BC). For example, RNA-Seq is mainly used to analyze the continuously changing cellular transcriptome and finding the pathways enriched/inhibited by the differently expressed genes. Small RNA-Seq is a very similar method allowing the detection of other classes of RNA such as small non-coding RNA (miRNA, piRNA, tRNA). In particular, microRNAs (miRNA) are a small non-coding RNA that regulate gene expression at the post-transcriptional level by binding to the 3'UTR (untranslated region) of target mRNAs, causing their degradation or translation inhibition. Several studies correlated an altered expression of these sncRNAs with the onset and /or progression of different diseases, including cancer. They can be used as biomarkers, playing a key role in the diagnosis, prognosis and prediction of response to specific therapies. Moreover, many studies have focused on the possibility of developing new therapeutic strategies based on microRNAs modulation and their potential use in the personalized management of cancer. Furthermore, also Piwi-interacting RNA (piRNA) is a class of small non-coding RNA molecules expressed in animal cells that are associated with both epigenetic and post-transcriptional gene silencing of retrotransposons and other genetic elements. They are distinct from miRNA in size (26–31 nt rather than 21–24 nt), lack of sequence conservation, and increased complexity. The aim of my research project was to understand the carcinogenic mechanisms and pathways modulated by these mRNAs and smallRNAs, since the clarification of the roles played by these molecules in cancer might provide new opportunities to develop novel strategies for diagnosing and treating this disease using bioinformatics tools and created it. Furthermore, a tool has been created that allows the analysis of smallRNAs by integrating various software to facilitate the use of this technology and to better explore the expected results.
Small non-coding RNAs and cancer: a bioinformatics approach
4
1. INTRODUCTION
Fifteen years ago the Human Genome Project (Human Genome Project) was completed and from there on research on genomes structure and functions made a significant step forward. This was possible thanks to the significant developments in the field of sequencing technologies of DNA, whereby from the ‘Sanger’ DNA sequencing technique, which untill that time was the standard approach, we moved on to the, so-called, Next-Generation Sequencing (NGS), based on massive parallel sequencing technologies. Today, the human genome can be sequenced in less than a week and soon, systematically, down to a couple of days. NGS has allowed remarkable advances in the new era of biology, known as "post-genomics", leading to a greater understanding of how, where and when all genes of a given cell or tissue are regulated, allowing to gather a great amount of data in a single experiment, with significantly lower costs compared to past. This global approach to science has been successfully applied to different areas of research and led to the birth and development of a new set of disciplines, the so-called "-omics", such as transcriptomics (study of the transcriptome), proteomics (study of the proteome), interactomics (study of the interactions between the products of multiple genes), cellomics (studies of cellular functions and impact of drugs at the cell level), genomics (large-scale molecular analyzes of a set of genes, on gene products or on regions of genetic material) and miRNomics (study of miRnoma), each of these stimulating in turn the development of new ones technologies to facilitate work.
1.1 New Methods for Genomic Analysis
Traditional techniques for coding and non-coding RNA analysis represent a limited approach for the study of genomes, because they generally focus on a single gene at a time or on a limited set of them. The advent of Next-Generation-Sequencing has marked a remarkable and important step forward for this field. The global approaches developed, such as the RNA-Seq and smallRNA-Seq, have allowed, in fact, to investigate more in depth and at lower costs, the complex interactions between DNA and proteins and the role played by regulatory transcripts. This progress has also been made possible by the parallel development of methods for data analysis that tries to make the interpretation less problematic. RNA-Seq is used to analyze the continuously changing cellular transcriptome, it is used for look mRNA gene splicing, gene fusion and change in gene expression. RNA-Seq also allows other classes of mRNA like long non-coding RNA and small non-coding RNA. In particular, micro RNA is a small non-coding RNA that regulate
Small non-coding RNAs and cancer: a bioinformatics approach
5
gene expression at the post-transcriptional level by binding to the 3'UTR (untranslated region) of target mRNAs, causing their degradation or translation inhibition. Piwi-interacting RNA (piRNA) is a class of small non-coding RNA molecules expressed in animal cells that are linked to both epigenetic and post-transcriptional gene silencing of retrotransposons and other genetic elements.
1.2 microRNA (miRNA)
miRNAs were first identified in the 1993s with the discovery of let-7 and Lin-4 in a worm (Caenorhabditis elegans) and after the presentation of this small RNA was detected in multiple eukaryotic organisms and mammalian species (Lagos-Quintana et al., 2001). They play an important role in the modulation of biological processes through the regulation of gene expression in a post-transcriptional manner, primarily by binding to the 3’ untranslated region (3’UTR) of messenger RNAs and resulting in a down-regulation of target proteins through the degradation of these mRNAs or by translation inhibition. The miRNA-RISC complex can block translation of target mRNAs into protein and/or induce degradation of target mRNA transcripts (Bartel et al., 2009) (Figure 1.1). The binding between miRNA and its target messenger happens through the complementarity of bases; in mammals, the complementarity in most of the cases is partial and determines a translation of the block while the total complementarity (especially in plants) occurs only rarely and induces degradation of the transcript. miRNAs can modulate about 30% of protein-coding genes in humans (Lewis et al., 2005).
Figure 1.1: miRNAs biogenesis: Several stages in miRNAs maturation started in the nucleus after transcription in pri-miRNA and ended in the cytoplasm by RISC complex (from Spadaro et al, 2012)
Small non-coding RNAs and cancer: a bioinformatics approach
6
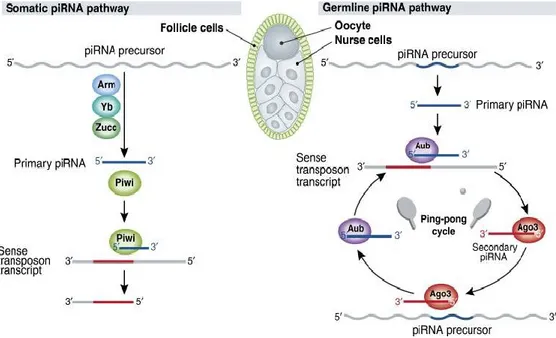
1.3 Piwi-interacting RNAs
Of the other smallRNAs, piRNAs are the least studied and analyzed. One role of piRNAs in germline cell is protect from the double-stranded breaks and insertional mutagenesis caused by active transposons. Derived from long, single-stranded RNAs, nearly all of which are shockingly long and transcribed from genomic ‘clusters'—transposon-rich regions of the genome thought to record the waves of transposon invasions survived by an animal and its evolutionary forebears (Vagin et al., 2013). How show in figure 1.7, piRNA precursor transcripts are fragmented and perhaps trimmed to yield primary piRNAs; primary piRNAs initiate an amplification loop (the ‘ping-pong' cycle) that generates secondary piRNAs; and, finally, the resulting amplified piRNAs silence their regulatory targets, such as the mRNA transcripts of transposons, by guiding a specialized sub-class of Argonaute proteins. These specialized Argonaute proteins are called PIWI proteins, after the founding member of the sub-family, the Drosophila protein, P-element-Induced Wimpy Testes or Piwi (Lin and Spradling, 1997).
Figure 1.2: Biogenesis of piRNAs in the germline and in somatic follicle cells. In the germline, piRNAs are generated through an Aub- and Ago3-dependent piRNA amplication cycle, whereas in somatic cells, biogenesis occurs through a Piwi-dependent, Aub- and Ago3-independent pathway (from Zamorea, 2010).
Small non-coding RNAs and cancer: a bioinformatics approach
7
1.4 Breast Cancer
Breast cancer (BC) is the second cause of cancer death in women aged from 20 to 59 years, with 29% of new cancer diagnoses in the female population worldwide. Breast tumor occurs after pre-pubertal age with an incidence that increases after the third decade of life up to 60 years (Siegel et al., 2016). This cancer is manifest in the mammary gland, an exocrine glandular tissue, responsible for lactation, characterized by modified apocrine secretion and controlled by reproductive hormones.15 to 29 lobes that are segregated in stroma by adipose and connective tissue form it. The lobes are divided into smaller lobules joining up with the alveoli and each lobule has a lactiferous duct that drains into openings of the nipple. When cancer is discovered, microscopic analysis of breast tissue is necessary for a definitive diagnosis to characterize the histotype of disease. The tissue for microscopic analysis is usually obtained via a needle or surgical biopsy. BC generally originates in the epithelium of glandular ducts and lobules, namely respectively ductal or lobular adenocarcinoma; the first is most of the cases. BC can be classified as in situ or invasive carcinoma. They originate from the duct-lobular terminal (TDLU, Terminal Duct Lobular Unit) and, while in situ BCs are characterized by the proliferation of atypical epithelial elements within the lobules and ducts but without overcoming their basement membrane, the invasive form, representing the most advanced form of cancer, are distinguished by their acquired metastatic skill (Pontieri et al., 2005). Further classification takes into account the histological features, distinguishing seven different groups among the invasive carcinomas (American Cancer Society, 2015). The classification of BC has requested the development of several techniques of analysis given its heterogeneity, encompassing multiple tumor entities, each characterized by distinct morphology, behavior and clinical implications. Immunohistochemistry (IHC) classified BCs by their anatomical and molecular features, in particular the presence of the Estrogen Receptor alpha (ERα, a well-established diagnostic and prognostic marker) into ER-positive (hormone-responsive tumor) and ER-negative categories. Today, high throughput proteomics and gene-expression profiling methods are being explored as diagnostic tools. The study to examine comprehensive gene-expression patterns in human BC have identified 4 subtypes (basal-like, HeR2, normal breast-like and luminal) (Perou et al., 2000) and their association to the classical tumor classification led to a better diagnosis of the disease (Sotiriou et al., 2003; Sorlie et al., 2001). The common cause of hereditary BC is an inherited mutation in the BRCA1 and BRCA2 genes (5% to 10% cases of BC), involved in DNA reparation. These mutations can act bind with mutations in key genes of cell proliferation and survival, such as p53, PTEN, ATM, typical of neoplastic transformation of the cells (Robbins
Small non-coding RNAs and cancer: a bioinformatics approach
8
e Cotran, 2006). BC is associated with several risk factors divided into genetic and environmental factors. The environmental factors are the lifestyle (abuse of alcohol, smoking, high fat consumption in the diet), the geographic area, exposure to radiation and to infectious agents, even if the most important factor is the prolonged exposure to estrogenic stimulation like endogenous and exogenous (Platet et al, 2004). For normal development of the mammary gland the estrogen signal is essential and a deregulation of this pathway is responsible for tumor progression. 70% of the BCs are hormone-responsive and express ERα.
1.5 GAPT2 role in BC
The first step in glycerolipid biosynthesis is catalyzed by Glycerol-3-phosphate acyltransferase (GPAT), in which glycerol-3-Glycerol-3-phosphate is acylated to form lysophosphatidic acid. Four isoforms are known such as GPAT1– GPAT4 and have been described which differ in their subcellular location, tissue expression pattern, substrate preference, transcriptional regulation, and sensitivity to sulfhydryl group reagents such as N-ethylmaleimide (Gonzalez-Baro et al., 2017). GPAT2 is a mitochondrial isoform that is highly expressed in the testis, where its expression is transient, being restricted mainly to primary spermatocytes (Cattaneo et al., 2012). Although GPAT2 was initially associated with lipid metabolism a recent work links GPAT2 to the biogenesis of Piwi-interacting RNAs (piRNAs) (Shiromoto et al., 2013). piRNAs are a class of small non-coding RNAs (sncRNAs) of 24-31 nt in length that function in germline cells to silence retrotransposons and maintain genome integrity (Iwasaki et al., 2015). GPAT2 knockdown in MDA-MB-231 BC cells diminished cell proliferation, anchorage-independent growth, migration and tumorigenicity, and increased staurosporine-induced apoptosis. In contrast, GPAT2 over-expression increased cell proliferation rate and resistance to staurosporine-induced apoptosis (Pellon-Maison et al., 2014).
1.6 DOT1L and BC
Based on hypothesis, the molecular partners of ERα involved in the multiprotein complexes that it requires for its transcriptional activity, including epigenetic regulators, represent potentially exploitable targets for new therapies against ER positive and antiestrogens-resistant tumors. For proteomic interaction we identified histone methyltransferase DOT1L (Disruptor of telomeric silencing-1-like) as a component of multiprotein complexes that assemble with ERα in the nuclei of BC cells after estrogen or anti-estrogen treatment. DOT1L catalyzes mono-, di- and tri-methylation of histone H3 on lysine-79 (H3K79me), a marker of transcriptionally active
Small non-coding RNAs and cancer: a bioinformatics approach
9
genes, and is involved in transcription elongation, DNA repair and cell cycle progression. This enzyme is associated with the mystical leukemia fusion protein (MLL) and plays a key role in the transcription mechanisms that support leukemogenesis, and for this reason its inhibitors have been proposed, and clinically tested, as therapeutic targets for leukemia by MLL merger. The role and functional significance of the DOT1L association with ERα in hormone responsive human BC cell nuclei have been studied here in detail. The results demonstrate the co-recruitment of both factors, in combination with other transcriptional epigenetic regulators, into a considerable fraction of ERα -CM-7 cell chromatin, thus influencing the transcription of genes involved in key cellular functions, including ESR1 (encoding ERα), FOXA1 and other ERα co-regulators. These results demonstrate for the first time that DOT1L represents a novel molecular target for epigenetic therapies against endocrine-responsive and ER-positive, hormone-resistant mammary carcinomas.
1.7 Colorectal cancer and LINE-1 transposable elements
Colorectal tumors present with a series of genomic and epigenomic alterations through interactions between neoplastic cells, immune cells and microbiotics. In particular, the hypo-methylation status of the long nucleotide nucleotide element-1 (LINE-1), which constitutes about 18% of the entire human genome, has been associated with a greater chromosomal instability that may cause a low antitumor immunity level in colorectal cancer (Gaudet et al., 2003). In fact this hypomethylation involves a lower density of T cells in the tumor tissue and a worse clinical outcome (Ogino et al., 2008). Other studies have shown that the prognostic association of the methylation level of the LINE-1 tumor with microsatellite instability (MSI) (Rhee et al., 2012). It should also be noted that this instability may be sporadic or hereditary, taking the name of Lynch syndrome. In species such as Drosophila and mouse, the silencing of the Transposable Elements (TE) is performed by piRNAs; in the special case of mice, MIWI2 is necessary in germ cells for the determination of CpG methylation status on genome sequences of transposons (Aravin et al., 2008). Furthermore, piRNAs have also been implicated in silencing the LINE1 in human tumor lines.
1.8 Pancreatic cancer and Annexin A1
Recently, the oncogenic role of Annexin A1 (ANXA1) has been found in pancreatic cancer (PC), where protein expression is directly related to the poor prognosis of patients (Chen et al., 2012). It has also been shown that ANXA1 improves cell migration and invasion by acting both directly in the
Small non-coding RNAs and cancer: a bioinformatics approach
10
intracellular compartment and indirectly through interaction with formyl peptide receptors (FPRs, Belvedere et al., 2012). In addition, the knock-out ANXA1 (KO) in our in vitro model using the CRISPR/Cas9 genome editing system on PC MIA PaCa-2 cells revealed the deregulation of a large number of proteins involved in the organization of cytoskeleton. This led to reversion of the epithelial-to-mesenchymal transition (EMT), leading to a less aggressive phenotype. Lately, the study of the miRNA profile has been found useful as a diagnostic screening method also for PC, where, among the most characterized miRNAs, miR-196a has been associated with recurrence and shorter survival (Kong et al., 2012). miR-196a is considered a discriminating factor between PC and normal pancreas, because it is upregulated only in tumor samples (Wang et al., 2009). Furthermore, in vitro it has been demonstrated that miR-196a has an expression profile directly correlated to the aggressiveness of PC cells, as assessed by EMT (Gaianigo et al., 2017). Understanding the molecular mechanisms of ANXA1 in cancer also implies the study of its relationship with miRNAs. In fact, the protein can regulate downstream gene activation and transcription factors and, on the contrary, can be regulated by these.
Small non-coding RNAs and cancer: a bioinformatics approach
11
2. AIM
This thesis project has consisted in three main parts:
1. To develop a tool, named iSmaRT (Small RNA Tool-kit integrative), simply to use and to investigate the biological roles of small non-coding RNAs (sncRNAs). It will also be tested on various data including Huntington disease and several BC cells;
2. To apply iSmaRT on trancriptomics data from pancreatic cancer
MIA PaCa-2 cells carrying ANXA1 ‘knock-out’ (ANXA1ko);
3. To carry out analysis of patient-derived colorectal cancer transcriptomics data from samples classified according to the level of methylation of the LINE1, microsatellite instability and the presence of the Lynch syndrome.
Small non-coding RNAs and cancer: a bioinformatics approach
12
3. MATERIALS AND METHODS
iSmaRT
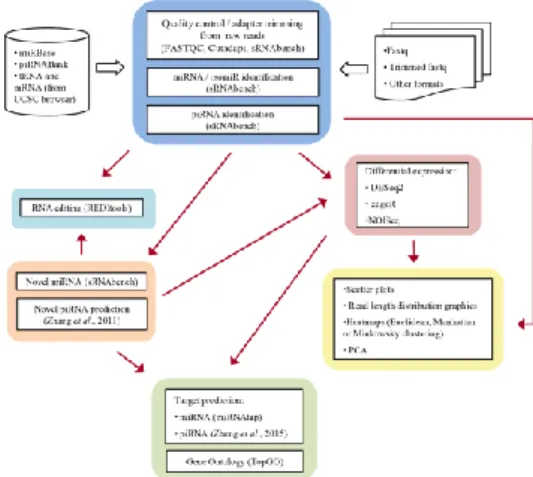
iSmaRT is a pipeline, wrote in Python and developed in a virtual machine, that integrates several third-party software widely used for the analysis of smallRNA-Seq data with own algorithms. sRNAbench (Rueda et al., 2015) is the core of iSmaRT, for its capability to detect several classes of sncRNAs, being used to perform the main analytical steps required. iSmaRT first conducts quality control and filtering of the sequence reads using FASTQC (http://www.bioinformatics.Babraham.ac.uk/projects/fastqc/), while Cutadapt (Martin, 2011) or sRNAbench are used to remove the adapter sequences and low quality reads. Differential expression analysis is performed in iSmaRT integrating three Bioconductor statistical packages: DESeq2 (Love et al, 2014), edgeR (Robinson and Smyth, 2008) and NOISeq (Tarazona et al., 2015). A novel piRNA prediction method was integrated into the tool-kit, working on 25–36nt-long reads filtered out from other classes of sncRNAs and using an algorithm based on k-mer scheme (Zhang et al., 2011). The enrichment analysis of Gene Ontology terms on miRNA and piRNA RNA targets is performed using the R Bioconductor package TopGO (Alexa and Rahnenfuhrer, 2010) and pathway analysis is performed by ReactomePA (Yu and He, 2016). iSmaRT includes also a module for the identification of RNA editing events, comprising REDItools (Picardi and Pesole, 2013).
GPAT2 silencing
For human GPAT2 silencing, MDA-MB-231 cells were transfected using Lipofectamine 2000 Reagent (Life Technologies) with HuSH-29 plasmid (OriGene) coding for shRNA against human GPAT2 mRNA and selected puromycin resistance to generate the respective silenced MDA-MB- 231 cell line (SH). A non-effective scrambled sequence shRNA plasmid was used to create a negative control (SC). Both plasmids also contain a sequence coding for green fluorescent protein driven by a CMV promoter.
Small RNA sequencing library
Total RNA was extracted from the cell line using the standard RNA extraction method with QIAIzol (Qiagen), quantitated with NanoDrop-1000 spectrophotometer (Thermo Fisher Scientific) before integrity assessment with an Agilent 2100 Bioanalyzer (Agilent Technologies). For small RNA-seq, 1 μg of total RNA from SH and SC cells was used for library preparation with Illumina TruSeq small RNA sample preparation Kit. Three independent experiments (two clones per cell line) for each condition, were sequenced (10 pM) on HiSeq2500 (Illumina) with single read for 51 cycles. Small RNA sequencing data was analyzed using iSmaRT (Panero et al., 2017) to identify
Small non-coding RNAs and cancer: a bioinformatics approach
13
the sncRNA families studied, i.e. miRNAs (miRBase v21), piwi-interacting RNAs (piRNABank), and tRNA-derived fragments (tRF, Human genome assembly, GRCh37/hg19) with Minimum Read Count of 3. Rfam and RefGene correspond to reads mapped to Rfam (Nawrocki et al. and Refgene (known human protein-coding and non-protein-coding genes) databases.
Bioinformatics analysis smallRNA-Seq
To identify differentially expressed miRNAs, piRNAs or tRF between SH and SC samples, we used iSmaRT for all the preprocessing of raw file and DESeq2 algorithm based on the normalized number of counts mapped to each sncRNA transcript (Love et al, 2016). Functional enrichment analyses were performed using the databases DAVID, http://david.abcc.ncifcrf.gov/),
Enrichr (HTTP://amp.pharm.mssm.edu/Enrichr/) and FunRich
(www.funrich.org), based on the list of genes associated with the deregulated sncRNAs (P-adj. ≤0.05; FC ≥|1.5|). Data integration, heatmap visualization of differentially expressed transcripts and functional enrichment plots were done with R/Bioconductor packages and the Multi Experiment Viewer software (MeV v4.9) (Saeed et al., 2003). To validate the bioinformatic analysis of small RNA-seq experiments, we compared the global miRNA expression profile of SC from our study with the global miRNA expression profile of the MDA-MB-231 and MCF10 cell lines obtained from the study of (Zhou et al., 2014), in which the authors profiled the cellular small RNAs isolated from these two cell lines by Solexa deep sequencing. Briefly, normalized data were downloaded from GEO (ID#GSE50429) and the miRNAs in common to our libraries were selected (n=228). The comparison was made using a linear regression model in R. The name or GenBank ID, chromosome number, genomic position, strand orientation and sequence length of piRNAs
was obtained from piRNAbank
(http://pirnabank.ibab.ac.in/simple_search.html), and validated with the NCBI Nucleotide Database (https://www.ncbi.nlm.nih.gov/nuccore/). The number of copies in the genome and the genomic loci was obtained from the UCSC Genome Browser. To identify potential target genes of relevant piRNAs, we employed the NCBI database (Human Genomic plus Transcript) based on sequence complementarity using the reverse complement of the piRNA sequence as input. The HomoloGene tool from the NCBI database was employed to evaluate the grade of conservation of the selected putative mRNA targets among different mammalian species. For miRNA target prediction and functional annotations, we used the miRDB online resource (http://www.mirdb.org/miRDB/). To evaluate differences in the abundance of each species of tRF among the upregulated and downregulated group, we used Fisher Test to compare their frequencies with the expected frequencies according to the Genomic tRNA
Small non-coding RNAs and cancer: a bioinformatics approach
14
database (http://gtrnadb.ucsc.edu/). For the identification of putative proteins based on amino acids composition, we employed the AAcompIdent tool (http://web.expasy.org/aacompident/). For piRNA and snoRNA expression levels across human tissues and cell lines, we employed the DASHR database (http://lisanwanglab.org/DASHR/smdb.php). To evaluate and compare differentially expressed miRNAs found in this study with miRNAs
deregulated in BCs, we used the YM500v3 database
(http://driverdb.tms.cmu.edu.tw/ym500v3) which employ TCGA data to contrast normal vs cancer tissue. We selected the comparison of 1096 primary solid tumors against 104 samples of normal breast tissue (Chung et al., 2017). Survival section of YM500 database was employed to survival analysis of commonly deregulated miRNAs.
Small non-coding RNAs and cancer: a bioinformatics approach
15
4. RESULTS
4.1 Part One: Development and testing of iSmaRT tool
Developing toolsA challenging problem in NGS is the choice of the correct strategy to analyse the experimental data. SmallRNA-Seq analysis, for example, need different bioinformatics software and the possibility to perform multiple, subsequent file format conversions that slows-down and makes cumbersome the analytical procedure. For this reason, it was decided to design a tool that allows the use of graphic interfaces and various homemade scripts to solve the problems mentioned above. We will also use various third-party software in both standalone and web-based versions. In addition, implementing different statistical approaches for sncRNAs expression analyses allows users to compare and select the most appropriate method to analyze of their data.
iSmaRT pipeline
iSmaRT is an analytical pipeline, written in Python and R. It can be installed with bash script or it can be used running a virtual machine, that integrates several third-party software widely used for the analysis of smallRNA-Seq data. The workflow of iSmaRT covers several analytical steps with multiple programs, that can also be used independently (Figure 4.1).
Small non-coding RNAs and cancer: a bioinformatics approach
16
All these tools can be used by a Graphical User Interface (GUI) that allows the user to choose different parameters. The tool sRNAbench (Rueda et al., 2015) is the core of iSmaRT and it is used to perform the main analytical steps. iSmaRT starts with the execution of FASTQC in order to perform a quality control of the sequencing. Cutadapt (Martin, 2011) or sRNAbench can be used to remove the adapter sequences and low quality reads. iSmaRT allows to define different libraries to remove all the unwanted reads from the next steps of the analysis. iSmaRT can generate different plots, such as those showing read-length distributions for each of the sncRNA selected by the user, or Principal Component Analysis (PCA) results and heatmaps with different distance metrics. iSmaRT can also perform a differential expression analysis since it integrates three Bioconductor statistical packages: DESeq2 (Love et al, 2014), edgeR (Robinson and Smyth, 2008) and NOISeq (Tarazona et al., 2015). In recent studies, germline piRNAs have been detected also in somatic cells, highlighting the importance of identifying specific piRNAs in mammalian somatic tissues, where their exact number and functional roles still remain to be elucidated (Ross et al., 2014). To address this issue, we integrated in iSmaRT two features that can help researchers to address this issue. The first one is the integration of an algorithm based on k-mer scheme (Zhang et al., 2011) to select the putative new piRNAs from the sequences that are not annotated in the genome. This provides a way to identify novel somatic piRNAs that can then be further studied. The second one, as increasing evidence suggests that piRNAs are able to drive degradation of certain RNA targets via a miRNA-like mechanism that operates by imperfect base-pairing rules (Zhang et al., 2015), is the implementation of the approach proposed by these Authors to identify potential piRNA targets. The enrichment analysis of Gene Ontology terms on miRNA and piRNA RNA targets is performed using the R Bioconductor package TopGO (Alexa and Rahnenfuhrer, 2010) and pathway analysis is performed by ReactomePA (Yu and He, 2016), with the possibility to filter the list of mRNA targets against a dataset of mRNAs of interest, such as for example those expressed in the samples under study. iSmaRT includes also a module for the identification of RNA editing events, comprising REDItools (Picardi and Pesole, 2013). We analyzed with iSmaRT the smallRNAs sequencing data by Hoss et al. (2015), that demonstrated miRNA involvement in Huntington’s disease (HD) pathogenesis by comparing their expression in the prefrontal cortex from 26 symptomatic HD patients and 36 healthy controls. We thereby illustrated the performance of iSmaRT in providing a detailed analysis of miRNA and piRNA differentially expressed and of piRNA-mRNA interactions.
Small non-coding RNAs and cancer: a bioinformatics approach
17
iSmaRT main interface
The iSmaRT main interface, shown in Figure 4.2 reproduces the window that appears when the tool is opening. Each choice provided corresponds to a particular step of the small RNA-Seq data analysis work-flow and opens one or more Graphical Interface (GI), that can be called by clicking the corresponding button.
Figure 4.2: iSmaRT main interface.
The click on Complete analysis opening an interface where it is possible to select input file (Figure 4.3).
Small non-coding RNAs and cancer: a bioinformatics approach
18
If Cutadapt is selected, a new window will appear (Figure 4.4), where it is possible to specify the adapter sequences.
Figure 4.4: iSmaRT cutadapt interface.
The new window (Figure 4.5) is divided in four zones. The first one covers the "Mandatory Parameters", where is it necessary to specify where to save the output data, the path to the database (DB) folder, the fasta (or index) file of mature miRNAs, as downloaded from miRBase, and the fasta file of the pre-miRNAs hairpin sequences.
Small non-coding RNAs and cancer: a bioinformatics approach
19
The "Pre-filtering" panel allows specifying the name of the library file that should be used to filter out certain reads. The "Analysis types and library" panel allows defining the other small RNA libraries (Libs) on which to perform the analysis and the species (hg19 for human). If "noGenome" option is selected (False) then all reads are first mapped to the reference genome of species selected. Afterward, the genome coordinates of the reference small RNA annotation (Libs for miRNAs and other sncRNAs) are determined. In next windows (Figure 4.6) you can select several options of output like Principal Component Analysis (PCA), Scatter-plots on two samples that can be selected from the window, Heatmaps and Read-length distribution graphs. In addition, in this section it is possible to select the Differential expression analysis, Target predictions on miRNAs or on piRNAs and Novel piRNA identification (if the “Novel piRNAs” function is selected). If either of the two “Target predictions” functions is selected, it is also possible to select “ReactomePA” function analysis.
Figure 4.6: iSmaRT select workflow interface.
Small non-coding RNAs and cancer: a bioinformatics approach
20
Figure 4.7: iSmaRT DE interface.
It is possible to select here the test and control groups on which library (miRNA, piRNA, etc.) to perform the analysis and to choose the statistical method to be applied (DESeq2, NoiSeq or edgeR).
Output of iSmaRT
Commands.txt: This file contains all the line commands launched by iSmaRT and, eventually, the error messages;
sRNAbench_analysis: This folder contains all the output of sRNAbench, plus a text file (Terminal.txt) where are saved the messages printed in the terminal by sRNAbench;
FASTQC: This folder contains the output of FASTQC;
R_out: This folder contains the output of the R scripts and, eventually, the error messages;
Tables: This folder contains the tables generated by sRNAbenchDE. If the user selected to perform a differential analysis, the sub-folder ‘name of test group_VS_name of control group’ will contain the table generated by sRNAbench and used for the differential analysis; Differential_analysis: This folder contains the results of the
differential analysis. The first sub-folder indicates the tool used, the second contains indication on the test performed e.g. novel_piRNAs, test_vs_control, etc.
The files that can be generated are:
tool_name_normalized_counts.txt: Table of normalized read counts;
tool_name_log2_med_cent.txt: Table of normalized read counts transformed in log2 and median centered;
tool_name_results_translibs_name.txt: Table of the tool results;
Small non-coding RNAs and cancer: a bioinformatics approach
21
tool_name_results_translibs_name_filtered.txt: Table of the filtered tool results with the column FC that indicates the fold change;
heatmap_norm_counts_log2_med_cent.tiff: Heatmap
generated from the tool_name_log2_med_cent.txt table. Plots: This folder contains sub-folders with the names of the
translibs analyzed. Each sub-folder can contain the following files:
translibs_name.mat: Read counts generated by
sRNAbenchDE;
Heatmap.tiff: Heatmap made using the rlog function of DESeq2;
PCA.tiff: PCA made using the rlog function of DESeq2; ScatterPlots.tiff: Scatterplots of the read counts;
sequencingStat.txt: File generated by sRNAbench.
Read_lengths: This folder contains sub-folders with the names of the samples. In each sub-folder can be found the folder(s) with the name of each translibs analyzed. Each sub-folder can contain the following files:
sample_name_translib_name.txt: This file contains each sequence of the translibs, with its corresponding read counts; frequencies.txt: Read counts of the sequence in the translibs; sample_name.png: Plots of the frequencies.
GO: This folder contains the results of the Gene ontology analysis. Each sub-folder contains a description of what was tested and the can contain the following files (some may be missing if no enrichment was found):
GO_results.txt: table with the enriched GO terms with the associated genes and statistical tests.
enrihMap.tiff
enrichment_results_barplot.tiff enrichment_results_dotplots
novel_piRNAs: This folder contains the results of the analysis for piRNA likes and can contain:
novel_piRNAs.txt: This file contains the genomic location of each piRNA like identified in all samples, and the corresponding read counts in each sample. These putative piRNAs are named p_id_numeber if they have a single
location in the genome
orcp_sequence_id_number_locus_id_number if the
Small non-coding RNAs and cancer: a bioinformatics approach
22
novel_piRNAs.bed: BED file generated using the novel_piRNAs.txt information;
novel_piRNAs.fa: FASTA file generated using the novel_piRNAs.txt information;
piRNA_predictor_ERROR_log.txt: This file can contain errors or warnings of piRNApredictor, if the file is empty, no error/warnings were found/issued by the tool;
info: This folder contains a sub-folder for every sample analyzed. Each sub-folder contains the files:
1. novel_piRNAs.txt, novel_piRNAs.bed and
novel_piRNAs.fa for the piRNA-like identified in each
sample;
2. info folder. This folder contains these files:
All_Reads.fa: FASTA file of the not assigned reads, with new sequence id.
sample_name.txt: Read counts of the reads contained in All_reads.fa;
All_Reads_Table.txt: Tables that contains the information found in All_Reads.fa and
sample_name.txt;
predictedpiRNA_ALL_Reads.fa: piRNAs
predicted by piRNApredictor using as input
All_Reads.fa;
predictedpiRNA_ALL_Reads.bed: BED file of
predictedpiRNA_ALL_Reads.fa;
merge_test.txt: Output of bedtools merge using as input predictedpiRNA_ALL_Reads.bed; piRNA_predictor_error_log.txt: This file can
contain errors or warnings of piRNApredictor, if the file is emptied, no error/warnings were found/issued by the tool;
RNA-editing: This folder contains a sub-folder for every sample analyzed. In each sub-folder the output of REDItools can be found;
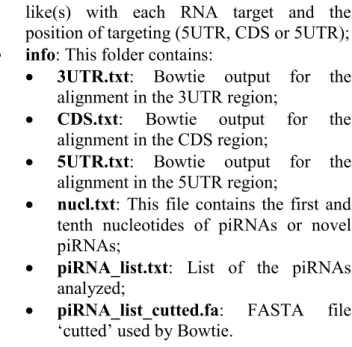
Target_predictions: This folder can contain the miRNAs, piRNAs and novel piRNAs RNA target predictions. For piRNAs and novel piRNA can be found also:
3UTR_CDS_5UTR.txt: This file contains the name(s) of the piRNA(s) or piRNA
Small non-coding RNAs and cancer: a bioinformatics approach
23
like(s) with each RNA target and the position of targeting (5UTR, CDS or 5UTR); info: This folder contains:
3UTR.txt: Bowtie output for the alignment in the 3UTR region;
CDS.txt: Bowtie output for the alignment in the CDS region;
5UTR.txt: Bowtie output for the alignment in the 5UTR region;
nucl.txt: This file contains the first and tenth nucleotides of piRNAs or novel piRNAs;
piRNA_list.txt: List of the piRNAs analyzed;
piRNA_list_cutted.fa: FASTA file ‘cutted’ used by Bowtie.
Testing procedure iSmaRT on Huntington’s disease data
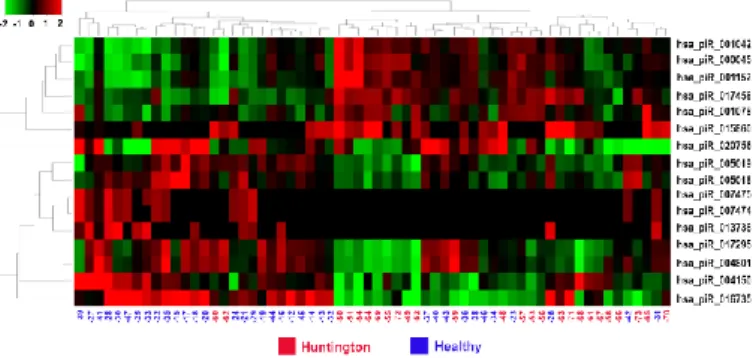
The brain smallRNA-Seq datasets has been analyzed using iSmaRT with the default parameters. After to have have obtained the miRNAs results obtained by the authors we focused on the piRNAs. Considering piRNAs, this allowed identification of 2200 such RNAs present in the datasets analyzed. Differential expression analysis was performed comparing HD and control samples, revealing 16 piRNAs differentially expressed in HD samples. The results are summarized in Figure 4.8 and Figure 4.9.
Figure 4.8: miRNAs differentially expressed in Huntington 's disease vs healthy brain samples. The
heatmap shows the 45 miRNAs identified with iSmaRT as differentially expressed in brain samples of Huntington's disease (Huntington) patients respect to normal (Healthy) individuals.
Small non-coding RNAs and cancer: a bioinformatics approach
24
It is worth noting that cluster analysis revealed a meaningful sample distribution between the two groups. Novel piRNA prediction allowed identification of 40 000 piRNA-like RNAs. To address the potential functional impact of the 16 piRNAs found deregulated in HD, we performed target prediction, followed by Reactome Pathway enrichment analysis (Figure 4.10 and 4.11).
Figure 4.9: piRNAs differentially expressed in Huntington 's disease vs healthy brain samples. The heatmap shows the 16 piRNAs identified with iSmaRT as differentially expressed in brain samples of Huntington's disease (Huntington) patients respect to normal (Healthy) individuals.
Figure 4.10: Summary of ReactomePA GO analysis performed on mRNAs target of differentially expressed piRNA. The barcharts display enriched pathways identified by the ReactomePA of iSmaRT in which are involved the mRNAs target of the 16 piRNAs differentially expressed in Huntington's disease patients brain.
Small non-coding RNAs and cancer: a bioinformatics approach
25
Figure 4.11: enrichMap visualization performed by iSmaRT on mRNAs target of differentially expressed piRNA. Enriched pathways in which are involved the mRNAs target of the 16 piRNAs differentially expressed in Huntington's disease patient brain.
This revealed the involvement of several genes encoding piRNA target mRNAs involved in pathways related to brain physiopathology, such as for example ‘CASP8 activity’ (CFLAR gene, Strand et al., 2005) and ‘Downregulation of TGF-beta receptor signaling/ Downregulation of SMAD2/3:SMAD4 transcriptional activity’ (NEDD4L gene, Ding et al., 2013). Finally, miRNA and piRNA sequence analysis revealed, for a subset of HD samples, the presence of canonical and non-canonical editing events.
Testing procedure iSmaRT on GPAT2 silenced BC cell
To analyze the role of GAPT2 in the biogenesis of piRNAs and the goodness of iSmaRT, GPAT2 silencing was performed by shRNA plasmid transfection and puromycin selection in the MDA231 cell. From scramble control cells (SC) and GPAT2 silenced cells (SH) GPAT2 mRNA expression was reduced by 90% and GPAT2 protein was undetectable in SH cells. Silencing GPAT2 affects sncRNA distribution. Indeed, SC cells, we identified an average of 67% of miRNAs, 3% of piRNAs, 7% of tRF, 5% of Rfam, 7% of Refgene and 11% of non-assigned transcripts, whereas in SH cells, 53% were miRNAs, 8% piRNAs, 13% tRF, 4% Rfam, 9% Refgene and 13% not-assigned transcripts (Figure 4.12). The percentages of total reads for each category differed in SC and SH cells, differences were only significant for the miRNA category, with a decrease after GPAT2 silencing (Figure 4.12).
Small non-coding RNAs and cancer: a bioinformatics approach
26
Figure 4.12: sncRNA distribution in SC and SH cells. Piecharts of the percentages of aligned reads assigned to each category of sncRNA in the SC cells and SH cells. A significant decrease was observed in the abundance of miRNAs of the SH cells * p-value≤0.05.
Total piRNAs abundance did not change after GPAT2 silencing, an upper shift in reading length distribution was observed (Figure 4.13).
Figure 4.13: Length distribution of reads assigned to piRNAs in SC and SH libraries
In SC cells, length distribution was bimodal, with peaks at 27 and 30 nt, whereas in SH cells, only one peak at 29 nt was obtained. Differential expression analysis shows that of the 137 piRNAs identified in SC cells, 77 (56%) were differentially expressed after GPAT2 silencing (p≤0.05, FC≥|1.5|), with 38 upregulated (28%) and 39 downregulated (28%) (Figure 4.14). Length distribution shows that piRNAs of 27 and 28 nt in length were significantly associated with the downregulated group (p-value ≤0.05). There were no differences in the other lengths (Figure 4.14).
Small non-coding RNAs and cancer: a bioinformatics approach
27
Figure 4.14: Piechart representation of the percentages of differentially expressed piRNAs and barchart of the frequencies of piRNAs in the upregulated and downregulated groups distributed according to their nucleotide length.
A lot of the downregulated piRNAs (32/39, 82%) are single copy (p-value≤0.05), being mainly intragenic (27/32, 84%); whereas in the upregulated group, piRNAs with single (18/38, 47%) and multiple (20/38, 52%) copies showed similar frequencies (p-value≤0.05) (Figure 4.15).
Figure 4.15: Heatmap representation of the differentially expressed piRNAs; the name of the host snoRNAs when it corresponds, and copies in the genome are indicated.
Small non-coding RNAs and cancer: a bioinformatics approach
28
Single copy, upregulated piRNAs however were mostly intergenic (14/18, 77%, p-value ≤0.05). Indeed, piR-36011, a multiple copy downregulated piRNA, maps to the loci of the SNar genes (small NF90-associated RNAs). By contrast, none of the upregulated piRNAs is hosted in a SNOR or SNAR gene. Moreover, snoRNAs constituted the host gene of 22 out of 27 (81%) intragenic single copy downregulated piRNAs, which is 56% of all downregulated piRNAs, with a probability value ≤0.05 when compared with the upregulated piRNAs. Certain piRNAs are derived from snoRNAs precursors (Taft et. Al, 2009), and that piRNAs are tissue restricted, now in this work has been evaluated whether there is a correlation in tissue distribution among the downregulated piRNAs and their hosted snoRNAs. For the analysis of the tissue profile of the piRNAs and the host snoRNAs that were available in the database we use DASHR. Unsupervised clustering based on Pearson correlation was assayed on the nine pairs of piRNAsnoRNA obtained from the search. In all cases an almost perfect correlation (~1) was shown, coincident with a co-expression pattern (Figure 4.16).
Figure 4.16: Corrplot of the pairs piRNA-snoRNA.
Four of the top-five upregulated piRNAs previously identified in BC cells (Hashim et. Al., 2014), was found downregulated in the SH cells (piR-31636, piR-57125, piR-35548 and piR-57125). piR-36041 and piR-43772 which were markedly downregulated in MCF7 growing cells, were found upregulated in the SH cells. Furthermore, of the latter group, 36743, piR-36318 and piR-36249 were previously found underexpressed in BC tissues compared to their normal counterparts (Hashim et al., 2014). The less proliferative phenotype of the SH cells agrees with all these data. Expression of four representative piRNAs is shown in Figure 4.17.
Small non-coding RNAs and cancer: a bioinformatics approach
29
Figure 4.17: Boxplots of four representative piRNAs differentially expressed. NDE: Non-Differentially Expressed.
Based on literature evidence that piRNAs would be involved in mRNA target repression via imperfect base pairing between the piRNA and the potential target (Gou et. Al., 2014), we searched for putative mRNA targets by base complementarity for all the differentially expressed piRNAs. The genes targets varied considerably for each piRNA, ranging from no-hits to hundreds of mRNAs. After filtering we obtained a reduced list of targets with functional enrichment of piRNA targets yielded terms mainly linked to lipid metabolism that included sphingolipid de novo biosynthesis, peroxisomal lipid metabolism and synthesis and interconversion of nucleotide di- and triphosphates, among others. The expression of the putative piRNA target ACSS3, a gene coding for acyl-CoA synthetase short-chain family member 3, was assessed by qPCR; as expected, ACSS3 gene expression decreased by 90% in SH cells. As mentioned earlier, iSmaRT allows the analysis of t-rna also.Total reads assigned to tRF did not change after GPAT2 silencing, 275 tRF were identified as differentially expressed (FC≥|1.5|, p-value≤0.05), with 147 tRF downregulated and 128 tRF upregulated. The top 40 deregulated tRF annotated according to the corresponding mature tRNA ID (Figure 4.18).
Figure 4.18: Heatmap
representation of the top 40 deregulated tRF identified in the comparison SC vs SH cells and annotated according to the name of the mature tRNA.
Small non-coding RNAs and cancer: a bioinformatics approach
30
To discover a biological meaning for deregulated tRF, we used the classification for tRNAs proposed by (Gingold et al., 2014). The authors established the existence of two distinct translational programs that operate during proliferation and differentiation, which eventually coordinate the supply and demand of tRNAs. Differentiated cells are less proliferative, and proliferating cells are typically not terminally differentiated, hence, according to the cellular status at which they are expressed, Gingold et al. (2014) classified the tRNAs into proliferation and differentiation tRNAs. Using Venn diagrams, we observed a significant association (p-value≤0.0001) between the subset differentiation tRNAs with the downregulated tRF in our analysis, whereas the opposite occurred with the upregulated ones, with a strong association (p-value≤0.0001) to the proliferation tRNAs subset (Figure 4.19)
Figure 4.19: Venn diagram of the comparison between the upregulated and downregulated tRF with the Gingold classification of tRNAs
With tRNAs differently expressed we then used the CompSite expasy database and obtained a list of scored putative proteins. Functional enrichment of these proteins enabled us to identify the biological processes previously associated to GPAT2, such as phosphatidic acid biosynthesis, phospholipid acyl chain remodeling and regulation of cell death, among others (Figure 4.20).
Small non-coding RNAs and cancer: a bioinformatics approach
31
Figure 4.20: Functional enrichment of the putative proteins obtained from the (tRF)-amino acid frequencies.
In contrast to piRNAs and tRF, miRNAs abundance significantly decreased after GPAT2 silencing (Figure 4.21 and Figure 4.22). Unsupervised hierarchical clustering analysis of differentially expressed miRNAs demonstrated a clear segregation of SC and SH cells (Figure 4.21).
Figure 4.21: Heatmap representation of deregulated miRNAs in SC vs SH cells.
Statistical analysis revealed 213 transcripts differentially expressed (109 upregulated & 104 downregulated) between the two cell line conditions. For this work we choose miR-5100 and miR-34 to validate small RNAseq data. Semiquantitative RT-PCR experiment demonstrates that, as expected, premiR-5100 was upregulated whereas pre-miR-34 was downregulated in SH
Small non-coding RNAs and cancer: a bioinformatics approach
32
cells. Now we using miRDB, to predict putative targets, and the 50 best ranked putative targets for each deregulated miRNA were selected. By pivot tables (cross tabulations), the more relevant targets present in at least 5 miRNAs (>5%) were extracted. This means to select the genes that constitute targets for more than five miRNAs. Two lists of putative gene targets were obtained, one of 51 genes for the upregulated miRNAs, and the other of 109 genes for the downregulated miRNAs. To identify biological processes associated with miRNA targets, functional enrichment analysis using ENRICH database was performed. Pathways analysis revealed specific terms associated with mitochondrial biogenesis and IGF1R signaling for genes associated with upregulated miRNAs, and oxidative metabolism of lipids and lipoproteins for genes associated with downregulated miRNAs (Figure 4.22). Among the putative genes targeted by the upregulated miRNAs were APPL1 and SPRED1, both play critical roles in cell proliferation (Mao et al., 2006; Pasmant et al., 2015).
Figure 4.22: (B) Functional enrichment of the targets of up-regulated miRNAs (red) and downregulated miRNAs (light blue).
Finally, to discover the impact of deregulated miRNAs on the survival of patients with BC, we performed an analysis using the YM500 database. According to YM500 there are 226 miRNAs differentially expressed between BC tumors (n=994) and normal breast (n=103). We compared this group with the 213 deregulated miRNAs identified in our study. We used the normal approximation to the binomial distribution as previously described (Smid et. Al., 2003) to calculate whether the number of deregulated miRNAs derived from each cross-platform comparison was of statistical significance. We found sixty-five miRNAs common to both groups (p-value≤0.05, Figure 4.23).
Small non-coding RNAs and cancer: a bioinformatics approach
33
Figure 4.23: Comparison of differentially expressed miRNAs in SC vs SH cells with differentially expressed miRNAs in normal vs breast tumors indicates a significant association. Venn diagrams of opposite groups (Up vs Down) also showed a significant.
Of the 65 miRNAs, 45 are upregulated and 20 downregulated in YM500 BC tumors, while 36 and 29 are upregulated and downregulated, respectively, in the SH cells from our analysis. We discover a significant association between the miRNAs upregulated in breast tumors with the miRNAs downregulated in the SH cells (22 miRNAs in common, p-value≤0.05), over between the miRNAs downregulated in BC tumors and the upregulated in the SH cells (13 miRNAs in common, p-value≤0.05, Figure 4.23). We found that 9 of the 22 miRNAs that are downregulated in the SH cells have a significant impact on BC patient survival if they are upregulated in tumors; whereas only 2 of the 13 upregulated miRNAs in the SH cells showed poor prognosis. Figure 4.24 shows the Kaplan Meier curves of 6 of the 9 miRNAs downregulated after GPAT2 silencing and upregulated in breast tumors.
Small non-coding RNAs and cancer: a bioinformatics approach
34
Figure 4.24: Kaplan-Meier survival curves of BC patient survival of six miRNA. We then found miRNAs that are downregulated in the SH cells have a significant impact on breast cancer patient survival if they are upregulated in tumors;
Moreover, considering that MDAMB-231 cells are negative for hormone receptors, we performed the survival analysis on a defined group of ER- and PR-negative breast tumors (n=218) for each of the significant miRNAs identified in the comparison normal vs tumor, but no significant association with overall survival was found in any of the miRNA analyzed.
Testing procedure iSmaRT on BC cell with EPZ a DOT1L inhibitor
To investigate the functional significance of the ERα-DOT1L interaction in BC cell nuclei, estrogenstimulated cells were treated with the selective DOT1L inhibitor EPZ004777 (EPZ) on MCF7 cells. Analysis of miRNAs was performed with iSmaRT using using as cutoff parameters FC> = | 1.5 | and pval <= 0.05. In the case of cell treatment with EPZ for 3 days, only 4 miRNAs changed, in all cases showing an upregulation in expression respect to untreated cells (Table 4.1).
Table 4.1: miRNA DE in EPZ 3g.
On the other hand, with a 6-day treatment, the data changes significantly. With these cutoffs we have 36 upregulated miRNAs and 23 downregulated
miRNA rc_norm_DMSO_3g rc_norm_EPZ_3g Fold-Change pval
hsa-miR-133a-3p 2.91 10.96 3.770.037077584
hsa-miR-1538 4.35 19.14 4.400.039833103
hsa-miR-548al 1.00 4.91 4.910.007889279
Small non-coding RNAs and cancer: a bioinformatics approach
35
miRNAs. In particular only has-miR-30c-2-3p his present in both condition but discordant.
Table 4.2: miRNA DE in EPZ 6g.
miRNA rc_norm_DMSO_6g rc_norm_EPZ_6g Fold-change pval
hsa-miR-1306-3p 9.89 1.22 -8.080.005614476 hsa-miR-30c-2-3p 8.85 1.22 -7.250.016545134 hsa-miR-4762-5p 6.60 1.00 -6.600.002889501 hsa-miR-6803-3p 8.49 1.63 -5.220.024740127 hsa-miR-142-3p 4.40 1.00 -4.400.032448753 hsa-miR-6795-3p 4.06 1.00 -4.060.029202612 hsa-miR-6862-3p 10.98 2.85 -3.860.033365664 hsa-miR-4473 18.72 4.93 -3.790.004227637 hsa-miR-6511a-5p 14.47 4.93 -2.930.039025164 hsa-miR-6511b-5p 14.47 4.93 -2.930.039025164 hsa-miR-219a-5p 14.02 4.96 -2.830.049903685 hsa-miR-3679-5p 23.75 9.19 -2.590.023602612 hsa-let-7c-3p 43.73 17.24 -2.540.001817052 hsa-miR-4638-3p 29.08 11.52 -2.520.009176954 hsa-miR-6750-3p 21.87 9.08 -2.41 0.02340518 hsa-miR-95-5p 31.61 14.05 -2.250.016872666 hsa-miR-6886-5p 29.40 13.62 -2.160.025223209 hsa-miR-365b-5p 79.42 39.50 -2.010.010931282 hsa-miR-7-5p 1283.98 773.48 -1.660.035913079 hsa-miR-454-5p 977.54 612.45 -1.600.002785227 hsa-miR-424-5p 1225.25 778.11 -1.570.004976244 hsa-miR-424-3p 537.03 343.94 -1.560.005570036 hsa-miR-340-3p 468.03 309.31 -1.510.015123091 hsa-miR-489-3p 8427.74 12759.29 1.510.003614636 hsa-miR-205-5p 1330.60 2077.03 1.560.004288185 hsa-miR-27b-5p 1381.29 2185.77 1.580.002413951 hsa-miR-1246 164.28 266.87 1.620.005711576 hsa-miR-338-3p 63.99 104.15 1.630.013172527 hsa-miR-378a-5p 47.20 76.90 1.630.032782012 hsa-miR-326 263.26 430.65 1.640.003850568 hsa-miR-504-5p 213.01 350.64 1.65 0.00449435 hsa-miR-143-3p 400.74 694.82 1.730.006595452 hsa-miR-27b-3p 336514.89 588440.37 1.750.000197463 hsa-miR-218-5p 94.97 166.83 1.760.025331602 hsa-miR-335-3p 1174.11 2066.81 1.760.000143118 hsa-miR-708-3p 66.04 118.45 1.79 0.01193539 hsa-miR-1287-5p 319.40 574.64 1.800.000363817 hsa-miR-199b-5p 41.19 74.29 1.800.010585117 hsa-miR-1283 25.26 45.63 1.810.048918489 hsa-miR-23b-3p 8082.66 14618.58 1.81 7.20E-05 hsa-miR-512-3p 21.21 38.71 1.830.044123495 hsa-miR-708-5p 86.99 160.15 1.840.000722596 hsa-miR-147b 31.17 57.46 1.84 0.01797775 hsa-miR-24-1-5p 26.73 51.81 1.940.023499753 hsa-miR-363-3p 99.51 200.00 2.01 8.25E-05 hsa-miR-891a-5p 20.04 43.39 2.170.008979936 hsa-miR-20b-5p 10.93 23.86 2.180.042088296 hsa-miR-184 9.30 22.24 2.390.027618344 hsa-miR-221-3p 258.48 620.61 2.40 9.07E-08 hsa-miR-135b-5p 22.07 56.59 2.560.000378118 hsa-miR-127-3p 10.95 28.99 2.650.006180826 hsa-miR-222-3p 327.10 866.60 2.65 5.90E-10 hsa-miR-570-3p 6.81 20.25 2.980.008393601 hsa-miR-320e 3.57 11.10 3.110.045043443 hsa-miR-7114-3p 1.00 5.37 5.370.002779168 hsa-miR-642a-3p 1.00 5.75 5.750.001740819 hsa-miR-34b-5p 1.00 7.44 7.440.000258768 hsa-miR-133a-3p 1.44 15.65 10.890.000128599 hsa-miR-7641 1.03 16.16 15.74 2.07E-05
Small non-coding RNAs and cancer: a bioinformatics approach
36
Part Two: Application of iSmaRT on pancreatic tumor.
The silencing of the ANXA1 in pancreatic cancer cells was previously
assessed using in vitro models of ANXA1ko MIA PaCa-2 cells created using
the CRISPR/Cas9 genome modification system. To confirm the lack of ANXA1 a Western blot was performed confirming the deletion of ANXA1 with respect to wild type (WT) and PGS MIA PaCa-2 cells. PGS cells were obtained by transfecting MIA PaCa-2 WT cells with an empty vector and were used as a control, as they behave very similar to the parental cell line. iSmaRT was then used to study miRNA change in both conditions. The following PCA (Figure 4.25) shows the difference between samples:
Figure 4.25: PCA of pancreatic cancer samples.
As reported in the heatmap in Figure 4.26, 19 miRNAs appeared to be upregulated and 28 downregulated with the same cutoffs used previously. These miRNAs are listed in Table 4.3.
Figure 4.26: Heatmap representation of deregulated miRNAs in ANXA1ko MIA PaCa-2
Small non-coding RNAs and cancer: a bioinformatics approach
37
Several studies have investigated the role of miRNAs in the PC. Many of them have focused on miR-196a as a potential marker because it appears to be involved in the acquisition of aggression and related to the poor prognosis. When we consider the significant low modulation of mR-196a-5p in the
ANXA1ko MIA PaCa-2 cells, we have transfected the PGS and ANXA1ko
cells with their mimicry to highlight its role in our system. Initially, we performed a wound healing test to test the migratory capacity of the cells. We have seen an increase in the migration rate both in PGS and in ‘knock-out’ cells.
Table 4.3: miRNA DE in ANXA1 KO MIA PaCa-2 cells vs PSG.
This increase appears more evident in the ANXA1ko cells since this clone has
confirmed that it is characterized by a lower migratory behavior. Furthermore, following the same transfection procedures, an invasion test
was performed through the matrigel lining with PGS and ANXA1ko cells. In
the presence of miR-196a-5p mimicry, a strong increase in the invasion rate of the analyzed clones was observed.
Name log2FoldChange pvalue padj FC PGS1 PGS2 PGS3 B11 D6 G5
hsa-miR-335-3p -3,988886412 5,20E-27 4,55E-24 -15,88 368 429 890 29 21 12 hsa-miR-335-5p -3,499910597 1,26E-13 2,75E-11 -11,31 50 106 241 6 4 0 hsa-miR-196a-5p -3,315893732 2,96E-12 4,32E-10 -9,96 245 107 36 4 2 6 hsa-miR-6510-3p -2,798868925 4,70E-15 1,37E-12 -6,96 135 83 124 15 8 12 hsa-miR-135b-3p -2,701423037 2,10E-15 9,20E-13 -6,50 197 173 177 35 16 12 hsa-miR-34a-5p -2,440875382 2,00E-06 0,000116574-5,43 10 25 19 0 1 0 hsa-miR-135b-5p -2,420276737 5,53E-11 6,90E-09 -5,35 508 506 482 121 55 30 hsa-miR-205-5p -2,019857469 9,07E-05 0,003773043-4,06 37 10 4 0 0 0 hsa-miR-4421 -1,9973394 0,000115235 0,004577957-3,99 11 13 10 0 1 0 hsa-miR-1252-5p -1,899994118 0,000227203 0,007943019-3,73 22 7 6 0 0 0 hsa-miR-3664-3p -1,79037834 0,000473434 0,01426832-3,46 23 11 12 1 0 4 hsa-miR-6501-5p -1,621481458 0,001308297 0,032670043-3,08 16 12 21 2 5 0 hsa-miR-10a-3p -1,558956342 7,04E-06 0,00038447-2,95 1.188 469 526 270 190 171 hsa-miR-4524a-5p -1,52699932 0,002489867 0,046300932-2,88 5 14 4 0 0 0 hsa-miR-203a-3p -1,344244283 0,000376896 0,012669507-2,54 223 356 124 78 108 46 hsa-miR-486-5p -1,309498345 1,85E-08 1,47E-06 -2,48328.553 222.534 242.884 90.913 94.842 118.640 hsa-miR-10a-5p -1,215868565 0,000459015 0,01426832-2,321.237.694 453.303 459.268 276.480 245.139 295.758 hsa-miR-548f-3p -1,159929075 0,002476268 0,046300932-2,23 35 32 36 10 13 16 hsa-miR-4461 -1,072940294 0,001408345 0,034191495-2,10 359 460 188 104 178 151 hsa-miR-3177-3p -1,045932113 0,002360282 0,045841925-2,06 65 49 50 25 29 17 hsa-miR-10b-5p -1,014936036 0,001930895 0,040181005-2,02 475 221 214 125 133 155 hsa-miR-589-3p -0,976857478 2,99E-05 0,001450035-1,97 3.059 2.220 2.558 1.338 1.017 1.477 hsa-miR-2116-3p -0,952462563 0,00098909 0,026195905-1,94 281 226 176 144 96 92 hsa-miR-584-5p -0,905178961 0,001602456 0,036856499-1,87 48.437 30.585 29.511 24.624 15.035 15.072 hsa-miR-378e -0,897734504 0,000814801 0,022254239-1,86 189 275 235 125 93 140 hsa-miR-18a-3p -0,778851246 0,001909198 0,040181005-1,72 832 654 538 445 317 376 hsa-miR-378d -0,721127459 0,001694498 0,037974123-1,65 466 633 528 371 286 302 hsa-miR-1275 -0,709818502 0,001553611 0,0366988-1,64 2.220 2.658 2.262 1.248 1.755 1.252 hsa-miR-1269b 0,626999862 0,001885094 0,0401810051,54 1.213 1.354 1.512 2.413 1.934 2.063 hsa-miR-15b-5p 0,65674351 0,001073332 0,0275909581,58 9.158 10.032 7.877 12.664 15.626 15.179 hsa-miR-181a-2-3p 0,840009328 1,77E-06 0,0001144761,79 2.854 2.753 2.737 5.486 4.645 5.073 hsa-miR-628-5p 0,859023846 0,000657596 0,0185399641,81 124 184 174 259 315 335 hsa-miR-3912-3p 0,867255438 0,001994361 0,0405365411,82 40 48 42 86 80 84 hsa-miR-3129-5p 0,899188363 0,000521556 0,0151946671,87 112 158 98 223 237 257 hsa-miR-3129-3p 0,952049042 0,000165186 0,0062770581,93 447 320 269 612 724 763 hsa-miR-449a 0,99430699 0,002188548 0,0434725221,99 59 40 62 160 103 86 hsa-miR-561-5p 1,073417673 0,000445629 0,014268322,10 105 244 174 449 390 352 hsa-miR-9-5p 1,281883283 8,35E-05 0,0036473482,43 297 506 789 1.768 1.197 1.359 hsa-miR-34c-5p 1,32507668 1,83E-06 0,0001144762,51 260 455 298 1.137 788 813 hsa-miR-455-3p 1,341584901 5,63E-09 4,92E-07 2,53 295 395 451 1.081 939 1.020 hsa-miR-2682-3p 1,462539389 2,16E-09 2,10E-07 2,76 69 66 56 194 177 192 hsa-miR-455-5p 1,516880996 1,08E-05 0,0005538352,86 195 483 469 1.779 1.035 1.006 hsa-miR-137 1,569743526 1,53E-09 1,67E-07 2,97 134 165 190 654 420 495 hsa-miR-2682-5p 1,612536848 7,18E-13 1,26E-10 3,06 706 561 465 1.742 1.888 1.990 hsa-miR-34b-5p 1,618102176 0,000196521 0,0071566483,07 5 18 9 65 39 32 hsa-miR-1245a 2,138038481 3,61E-05 0,0016583944,40 0 1 0 10 11 15 hsa-miR-202-5p 2,203988928 1,91E-07 1,39E-05 4,61 6 15 34 170 96 116
Small non-coding RNAs and cancer: a bioinformatics approach
38
Part Three: Colon cancer transcriptomics analysis with
iSmaRT.
From the evidence it was decided to use a part of the series of colorectal carcinomas available for this project to analyze the expression patterns of the small RNA, in particular the piRNA, in different molecular and clinical-pathological subclasses of these neoplasms, applying the experimental methodologies (smallRNA-Seq). Specifically, RNA extracts from 45 samples were analyzed by SmallRNA-Seq, organized in the following 4 experimental groups:
1) 13 samples of normal tissue and 32 of tumor tissue;
2) 4 subgroups with a variable percentage of methylation in the LINE-1 promoter, ie 20 samples> 60.1% (L1), 9 samples 54.1% - 60% (L2), 9 samples 45.8% - 54% (L3) and 7 samples < 45.6% (L4);
3) 16 MSI and 16 MSS samples;
4) 8 MSI S. Lynch samples and 8 sporadic MSI.
For each of the samples an average of 20 million sequences were obtained, the collected data allowed to identify ~ 1200 miRNA and ~ 110 piRNA expressed in the samples. The differential analysis (performed with iSmaRT) of the small RNAs among the different categories under examination (Table 4.4 and Figure 4.27) showed a high number of miRNAs showing significant variations (pValue < 0.05 and FC>=|1.5|) between normal and tumor tissue, instead for the piRNAs the most interesting comparison was MSS Vs MSI, in which it was possible to identify 46 differentially expressed piRNAs (Figure 4.28).